


Servicios Personalizados
Articulo
 Inglés (pdf)
 Articulo en XML
 Referencias del artículo
Indicadores

Links relacionados
-
 Citado por Google
 -
 Similares en Google
Compartir

 Permalink
Water SA
versión On-line ISSN 1816-7950
versión impresa ISSN 0378-4738
Water SA vol.44 no.1 Pretoria ene. 2018
http://dx.doi.org/10.4314/wsa.v44i1.03
http://dx.doi.org/10.4314/wsa.v44i1.03
Assessing the clogging and permeability of degrading packed bed reactors
Anthin BotesI, II; Chris JamesIII; Craig M SheridanI, II, *
IIndustrial and Mining Water Research Unit (IMWaRU), School of Chemical and Metallurgical Engineering, University of the Witwatersrand, Johannesburg, South Africa
IICentre in Water Research and Development (CIWaRD), University of the Witwatersrand, Johannesburg, South Africa
IIISchool of Civil and Environmental Engineering, University of the Witwatersrand, Johannesburg, South Africa
ABSTRACT
In South Africa, the need for water treatment is increasing, especially in the mining sector. As active water treatment technologies are expensive, the mining sector has an increasing need for passive water treatment technology, with low maintenance and operating costs, yet efficient water treatment ability. Literature on passive water treatment suggests that these systems only offer a narrow range of treatment capabilities. Therefore, hybrid water treatment systems could be a solution to low-cost water treatment in South Africa. The degrading packed bed reactor (DPBR) is one of the units comprising the hybrid treatment group. The DPBR's main action is to convert sulfates into sulfides and alkalinity, since this reduces the impact on the environment by increasing the pH and reducing the salinity. In this study, 6 small-scale DPBRs were constructed. Each was classified according to its unique organic source (manure, straw, vegetable food processing waste, wood shavings, chicken litter and a combined sample with layers of all the carbon sources). Synthetic acid mine drainage (AMD) was fed through the 6 bioreactors for a period of 3 months. Permeabilities, leachate samples and effective void volumes were measured from the DPBRs. From the experiments conducted, it was found that the manure and combination bioreactors (with equal layers of manure, straw, compost, wood shavings and chicken litter) had the lowest overall permeabilities, with straw and compost having the highest permeabilities. Linked to this, the experiments showed that the manure and combination bioreactors had the largest decreases in effective porosity with straw and compost having the least. Hydraulically, the combination bioreactor performed the best by incorporating the best attributes from each carbon source. Wood shavings preformed almost as well. Chicken litter clogged within 18 days after the initiation of the experiment and thus was the least effective substrate.
Keywords: degrading packed bed reactor, clogging
INTRODUCTION
In South Africa, the need for water treatment is increasing, especially in the mining sector. As active water treatment technologies are expensive, the mining sector is in need of a passive water treatment technology, with low maintenance and operating costs, yet efficient water treatment ability (Coetser et al., 2004). Literature on passive water treatment suggests that these systems offer only a narrow range of treatment capabilities.Coetser, Molwantwa, Heath, and Pulles (2004) Hybrid water treatment systems could therefore be a solution for low-cost water treatment in South Africa (Johnson and Hallberg, 2002).
Hybrid systems combine treatment processes from both active and passive water treatment systems, utilising the most suitable and cost-effective processes from each (Ávila et al., 2015). Hybrid systems use a segmented approach to treat water and are tailor-made to treat a specific pollution cocktail by targeting a specific pollutant at a specific position in the treatment chain. Although such systems may have high initial capital expenditure (CAPEX) costs to set up the treatment chain, they can potentially save money on long-term operation and maintenance costs (Johnson and Hallberg, 2002; Ávila et al., 2015).
In order for hybrid systems to become a widely used and trusted water treatment technology, existing knowledge gaps need to be addressed by research. Hybrid systems also need to be tested in pilot- and full-scale experiments (Gusek, 2008) before they system can be fully understood. There are numerous areas within the hybrid treatment system with very little or no information about them. These areas need to be studied and optimized.
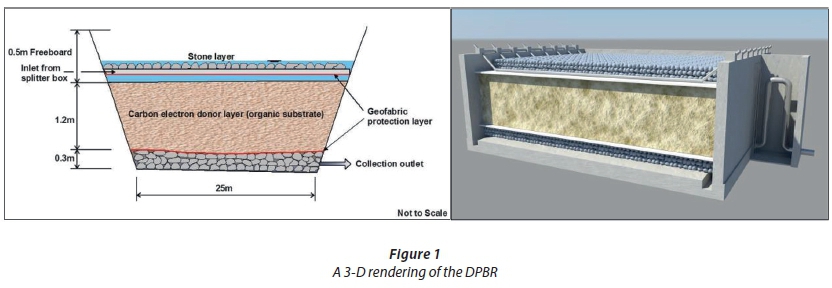
A promising hybrid treatment technology is the degrading packed bed reactor (DPBR) (Pulles and Rose, 2002). The DPBR's main action is to convert sulfates into sulfides and alkalinity. It achieves this by allowing sulfate-rich water to trickle through layers of different types of organic matter as shown in Figure 1. The organic matter donates electrons to the sulfate-reducing bacteria (SRB), and thus the sulfates are reduced to sulfides. This chemical process is well documented by Blowes et al. (1994) and Greenan et al. (2006) and is summarized by Eq. 1 (Lee et al., 2014; Wu et al., 2013).

Although the chemical process is well understood, the hydraulics of such a system remain unclear. The hydraulic processes occurring within a DPBR (or indeed any other reactor) are important to understand as they dictate the time available for reaction.
In order to maximise the remediation potential of the DPBR to treat impacted water, engineers and scientists need to understand the hydraulics behind the system. Polluted water is fed through a trickle system, onto the organic matter. The polluted water needs to remain in contact with organic matter long enough for the reaction to take place, yet not too long for it to have cost implications. Porosity is one of the key drivers in DPBR hydraulic performance. Porosity (or void fraction) is the volume of the space in the reactor, i.e., the volume not occupied by the packing, within which the fluid can flow. As the porosity drops, the amount of possible space within the packing material is reduced; this in turn reduces the hydraulic performance.
A key term in understanding porosity is effective porosity (ϕ). "Effective porosity is defined as the ratio of the interconnecting pore volume to the total volume of the medium" (Bear, 1988 p 44). Another less technical definition from Gibb et al. (1984) is that effective porosity is the number of pore spaces which allow water to move freely through the organic material. Over time, in the DPBR, biofilm growth as well as metal precipitation start reducing the effective porosity of the bioreactor as the biofilm grows into the void and, similarly, metals precipitate into the void.
Although there are numerous publications on the topic of porosity and various mathematical models aiming to predict the porosity of several materials, there is very little information on the porosities of organic materials. The limited research that has been done on the porosities and permeabilities of organic materials looks at flow and transport parameters in a woodchip-based bioreactor (Chun et al., 2009). Chun and colleagues' research mainly focuses on a single, uniformly-graded organic material. Very little is known about the general permeability and porosity values of organic materials such as kraal manure, straw, vegetable food processing waste (compost), wood shavings, chicken litter and a composite sample consisting of equal layers of all of the above carbon sources (Pulles and Rose, 2002), all of which could be used as packing within a DPBR.
The true value of the DPBR lies in its utilisation of waste material (the organic sources described above) to treat wastewater. The DPBR has numerous layers of these materials, placed on top of one another.
For design purposes, it is important to understand the flow rate through the DPBR; clogging of the bed could have significant impacts downstream of the process. It would be incorrect to design a DPBR for the initial flow through the multiple layers of organic materials because the multiple layers are of varying size, shape, packing and porosity (Cameron and Schipper, 2012). One of the biggest parameters that influence the flow of water through constructed wetlands is clogging, and this effect also occurs in DPBRs (Yu et al., 2006; Guiping et al., 2013). In recent years there has been more investigation into clogging in published research as a result of the importance of this phenomenon (Knowles et al., 2010).
Guiping et al. (2013) as well as Zhao et al. (2009) describe clogging as an intricate process which is not yet well understood. The clogging phenomenon therefore contains large gaps in knowledge, which should be the focus for future research.
Clogging can occur through two broad methods: clogging by mechanical mechanisms and clogging through biological mechanisms. During clogging by mechanical mechanisms, solid particles such as metal precipitates in the treated water get lodged between the organic materials, reducing the organic materials' effective porosity. This process is also known as plugging (Iluita and Larachi, 2005). Biological clogging occurs through the growth of biofilms. Biofilms grow naturally in most ecosystems where micro-organisms are found on solid surfaces. In unfavourable systems, biofilms tend to consist of a single layer of attached cells. However, in favourable environments biofilm growth tends to be more extensive (Van Loosdrecht and Heijnen, 1993). The biofilm grows in and around the organic media in the DPBR, and thereby reduces its effective porosity and hydraulic efficiency.
To design a hybrid water treatment process, each step in the water treatment process should be fully understood. The DPBR has two clear knowledge gaps.
• Understanding the way that the organic layers and packing materials influence the porosity of the bed.
• At what point in time does the DPBR need to be repacked. This can be done by determining the length of time it takes for the carbon sources to clog the reactor and whether this occurs before or after the carbon in the bioreactor has been depleted.
In this study, the permeabilities and porosities of the composite organic layers within the DPBR were determined and an indication of how quickly certain carbon sources clog was also obtained.
MATERIALS AND METHODS
Experimental setup
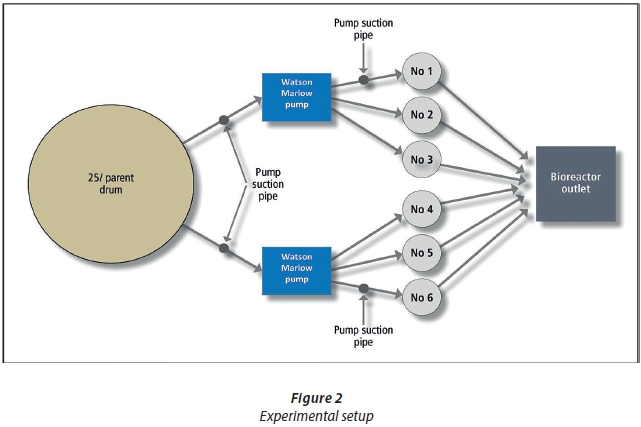
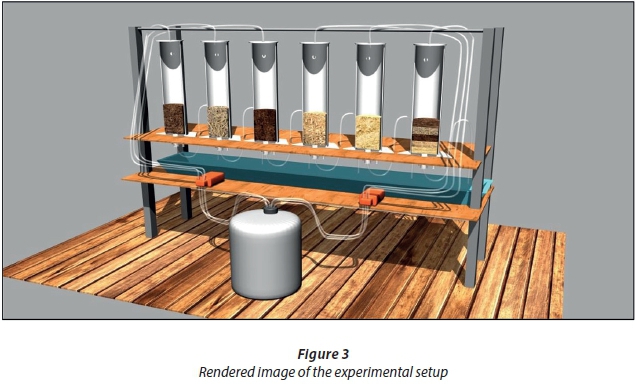
In the manufacture of the lab-scale, six 2 L measuring cylinders were utilized to act as the bioreactor's outer casing. Two Watson Marlow 120DM3 three-channel laboratory peristaltic pumps were used to feed the AMD into the bioreactors. PVC tubing was used to transport the AMD from the feed drum to the bioreactors. Marprene tubing was used within the peristaltic pumps as normal PVC hardens over time due to continual deformation in the peristaltic pump. A schematic of the experimental layout can be seen in Figure 2 and a rendered image of the experimental setup is shown in Figure 3.
In the experiment, 5 bioreactors, each with their own carbon sources, were filled to the 1 200 mL mark. The 6th bioreactor was filled with equal alternating layers of the first 5 carbon sources to the same total mark of 1 200 mL. The bioreactors were then filled with synthetic AMD to the same water level mark. The 5 carbon sources used were kraal manure, straw, vegetable food processing waste (compost), wood shavings and chicken litter. These reactors were not inoculated with any sulfate-reducing bacteria; rather they were left to acclimate on their own.
Synthetic AMD
A 25 L feed drum was filled with synthetic AMD. The synthetic AMD was based upon samples of actual AMD taken from the eMalahleni region, in the Mpumalanga coal fields. This source was chosen on the basis of the researchers having access to a real AMD. This reference AMD would be a useful guide to upscaling the lab data to a pilot plant should it ever be required. The artificial AMD samples were analysed and their chemical compositions were found to be:
• 3 100 mg/L sulfate
• 208 mg/L iron
• pH of 2.6
The AMD was made by adding FeSO4·7H2O (100% pure, unopened bottle, Merck) and 97% sulfuric acid (Merck) to achieve the required Fe and SO42- concentrations and the pH was adjusted by adding a 50% NaOH solution (Merck). This AMD is roughly representative of the mine-site AMD, within the natural variation found at the site.
Effective porosity
The effective porosity of each carbon source was calculated before the falling head permeability test experiment was started and once the falling head permeability test experiment was concluded. This was done to determine the effective porosity drop over the experimental lifespan. The effective porosity was determined by using the effective porosity equation, Eq. 2.
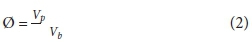
Ø = effective porosity (dimensionless)
Vp = total volume of interconnected voids (cm3)
Vb = bulk volume (cm3)
At the beginning of each experiment, the total volume of water up to the 1 200 mL mark was recorded as the bulk volume. Thereafter, the carbon sources were placed in the bioreactors up to the same 1 200 mL mark. Synthetic AMD was then poured from a 1 500 mL beaker into the bioreactor up to the 1 200 mL mark. The total interconnected voids were deduced from the amount of AMD which fitted into the bioreactor with the organic matter, to the marker point of 1 200 mL.
Falling head permeability tests
Once the experiments were set up and the initial effective porosities were determined, synthetic AMD was fed into the 6 bioreactors to a level of approximately 1 600 mL and the stopwatches were started. When the water level reached the sample level of 1 200 mL, the stopwatches were stopped and the time was recorded (falling head permeability test).
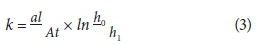
k = permeability (m/min)
a = internal cross sectional area standpipe (m2)
l = length of the sample (m)
A = cross sectional area (m2)
t = time it takes for water level to drop from h0 to h1 (min)
ho = starting height of water above sample (m)
h1 = final height of water above sample (m)
This process was repeated daily for 3 months or until the reactor was fully clogged.
RESULTS AND DISCUSSION
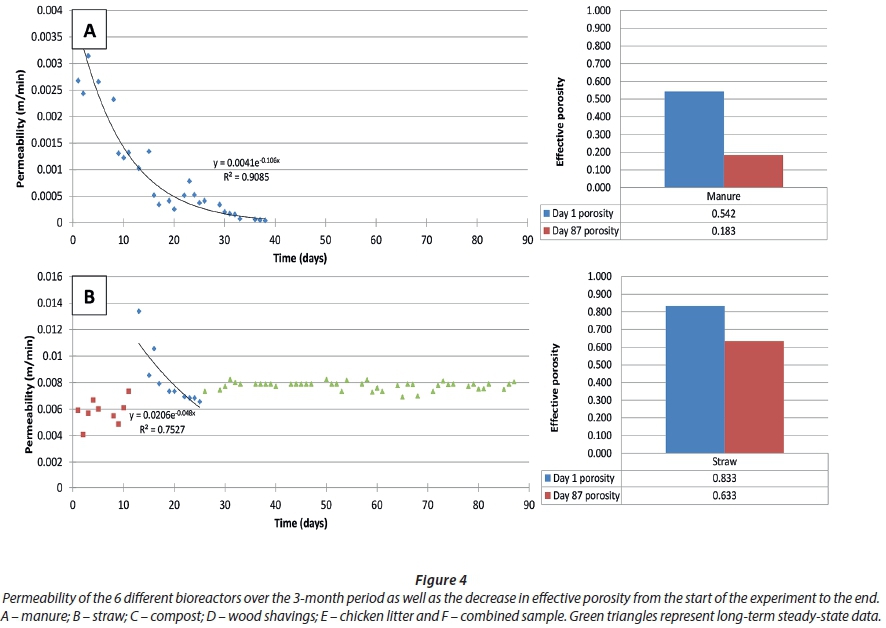
The results of the 6 experiments are shown in Fig. 4. Manure and chicken litter were seen to clog the most rapidly, as seen in Graphs A and E, respectively. None of the other experiments clogged fully over the study period. All of the carbon sources, with the exception of the manure and chicken litter, had an establishment phase, where the initial reading of permeability varied with no obvious trend or pattern in the data. After the establishment phase, exponential trends started developing. These trends started to develop as the bioreactor started to clog. These exponential trends were mainly in the negative direction (clogging of the bioreactor), with the exception of the compost bioreactor. The final phase which was identified was the stabilisation phase. Four of the carbon sources (straw, compost, wood shavings and combination bioreactor) showed a clear stabilisation phase, whereby the permeability values continued to decrease but at a vastly reduced rate for the remainder of the experimental lifespan. This is key, as a relatively constant permeability is reached in the bioreactor; this stabilisation value would be the true permeability design value for the specific carbon source.
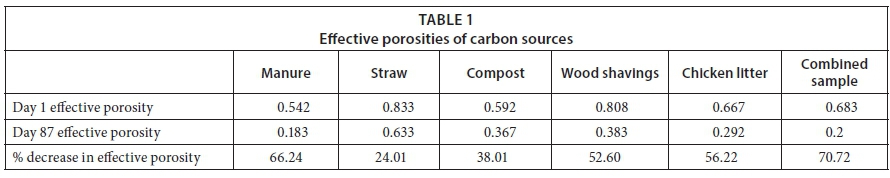
The effective porosities for each of the reactors is given in Table 1. The manure and the combined sample had the largest decrease in effective porosity, indicating that these 2 reactors were precipitating the largest quantity of metals. This consideration of this data with the permeability is important for considering which organic material to pack the reactor with - there is an interplay between clogging (indicating remediation) and permeability (indicating reduced effectiveness). The ideal reactor has lots of clogging but extended permeability.
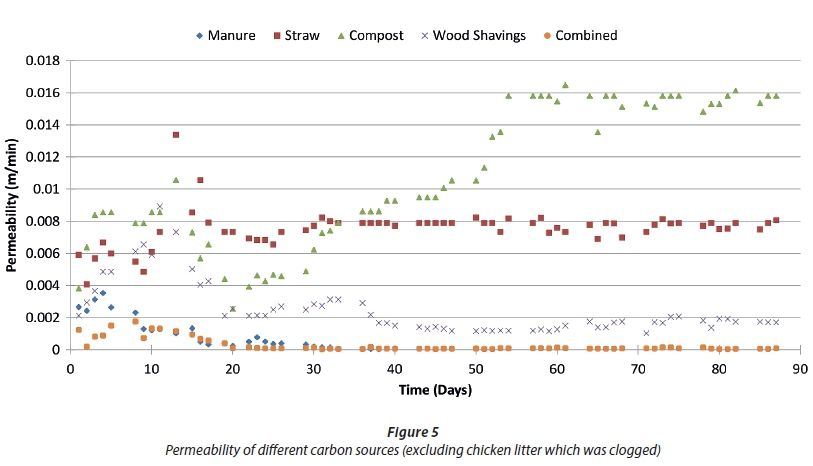
In Figure 5, the results indicate that the compost and straw had the highest overall permeabilities; manure and the combined sample had the lowest. Although the combination bioreactor never fully clogged, it was only as permeable as its least permeable layer, manure.
The average permeabilities of the stabilisation phase for the bioreactor, which did not clog, was determined and can be seen in Figure 6.
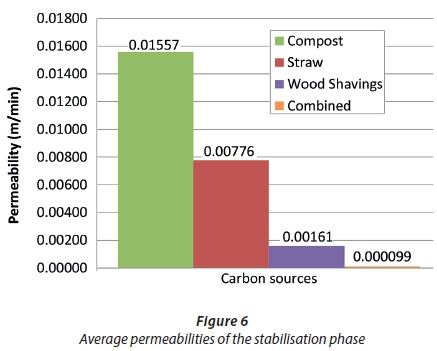
The compost bioreactor had the greatest permeability for the longest length of time and the combination bioreactor had the lowest. The stabilisation phase is of significance because it impacts the steady flow of AMD passing through the bioreactors. The polluted water needs to remain in and amongst the organic matter long enough for this reaction to take place, yet not too long as this increases the costs (a larger bioreactor will be needed to treat larger volumes of AMD). This stabilisation permeability can be used as the hydraulic design permeability of the bioreactor.
CONCLUSION
The chicken litter carbon source had the lowest permeability from the start of the experiment and completely clogged within 18 days of initiation of the experiment (which is why the data are excluded from Figs 5 and 6). It is therefore not recommended as a carbon source in the DPBR.
Manure showed the quickest establishment and started clogging from Day 2 of the experiment. This could be seen as both an advantage and disadvantage. The advantage lies in the fact that the bioreactor very rapidly establishes operating conditions and begins to precipitate metals. The disadvantage is the fact that the fast precipitation of metals clogs up the pores in the bioreactor, as can be seen by a 66% decrease in effective porosity. The manure was also 1 of 2 carbon sources which fully clogged on Day 38 of the experiment.
The straw, compost, wood shavings and combination bioreactors all seemed to stabilise at a certain point in time and a further decrease in permeability occurred at a slow rate thereafter. All 4 reactors stabilised at different times during the experiment, with the straw bioreactor stabilising the quickest and the wood shavings and compost bioreactors taking the longest. This stabilisation permeability can be used as the hydraulic design permeability of the bioreactor.
In the combination reactor, all of the 5 constituent carbon sources, found in equal layers within the bioreactor, seemed to average out the different behaviours of the different bioreactors. The overall permeability of the combination bioreactor was as permeable as its lowest permeable layer, manure. The combination bioreactor's permeability closely followed the manure's permeability graph, with a decrease in effective porosity of 70%. However, the combination bioreactor did not clog over the experimental lifespan. Hydraulically, this bioreactor seemed to be the best performing reactor; it never fully clogged and the AMD moved through the bioreactor at a constant rate.
Further research could explore different thicknesses, combinations and mixtures of specific carbon sources to attain the desired hydraulic parameters within the bioreactor. By varying the thickness, combinations and mixtures, hydraulic attributes could be designed into the system. It is also possible to include a non-degrading packing material to enhance permeability as the packing degrades. This was, however, not considered within the scope of this project.
The hydraulic parameters described in this paper also need to be considered in the context of the microbiology and chemistry of the system. The rates of metal precipitation and sulfate removal need to be assessed and considered at the same time as the permeability of the DPBR. This is the subject of current research.
REFERENCES
ÁVILA C, BAYONA JM, MARTÍN I, SALAS JJ and GARCÍA J (2015) Emerging organic contaminant removal in a full-scale hybrid constructed wetland system for wastewater treatment and reuse. Ecol. Eng. 80 108-116. https://doi.org/10.1016/j.ecoleng.2014.07.056 [ Links ]
BEAR J (1988) Dynamic of Fluids in Porous Media. Dover Publications Inc., New York. [ Links ]
BLOWES DW, ROBERTSON WD, PTACEK CJ and MERKLEY C (1994) Removal of agricultural nitrate from tile-drainage effluent water using in-line bioreactors. J. Contam. Hydrol. 15 207-221. https://doi.org/10.1016/0169-7722(94)90025-6 [ Links ]
CAMERON SG and SCHIPPER LA (2012) Hydraulic properties, hydraulic effiency and nitrate removal f organic carbon media for use in denitrification beds. Ecol. Eng. 42 1-7. [ Links ]
CHUN JA, COOKE RA, EHEART JW and KANG MS (2009) Estimation of flow and transport parameters for woodchip-based bioreactors: 1. laboratory-scale bioreactor. Biosyst. Eng. 104 384-395. https://doi.org/10.1016/j.biosystemseng.2009.06.021 [ Links ]
COETSER SE, MOLWANTWA J, HEATH R and PULLES W (eds) (2004). Implementing the integrated passive treatment system (IMPI) technology at the VCC passive treatment plant. Document Transformation Technologies, Cape Town. [ Links ]
GIBB JP, BARCELONA MJ, RITCHEY JD and LEFAIVRE MH (1984) Effective porosity of geologic. 6 materials: first annual report. Illinois State Water Survey, Champaign, Ill. [ Links ]
GREENAN DM, MOORMAN TB, KASPAR TC, PARKIN TB and JAYNES DB (2006) Comparing carbon substrates for denitrification of subsurface drainage water. J. Environ. Qual. 35 824-829. https://doi.org/10.2134/jeq2005.0247 [ Links ]
GUIPING F, ZHANG J, CHEN W and CHEN Z (2013) Medium clogging and dinamics of organic matter accumulation in constructed wetlands. Ecol. Eng. 60 393-398. https://doi.org/10.1016/j.ecoleng.2013.09.012 [ Links ]
GUSEK JJ (2008) Passive treatment 101: An overview of the technologies. P.E. U.S. EPA/National Groundwater Association's Remediation of Abandoned Mine Lands Conference, 2 October 2008, Denver, CO. [ Links ]
ILIUTA I and LARACHI F (2005) Modelling simultaneous bilogical clogging and physical plugging in trickel-bed bioreactors for wastewater treatment. Chem. Eng. Sci. 60 1477-1489. https://doi.org/10.1016/j.ces.2004.10.016 [ Links ]
JOHNSON BD and HALLBERG KB (2001). Pitfalls of passive mine water treatment. Environ. Sci. Bio Technol. 1 335-343. [ Links ]
KNOWLES PR, GRIFFIN P and DAVIES PA (2010) Complementary methods to investigate the development of clogging within a horizontal sub-surface flow tertiary treatment wetland. Water Res. 44 320-330. https://doi.org/10.1016/j.watres.2009.09.028 [ Links ]
LEE D-J, LIU X and WENG H-L (2014) Sulphate and organic carbon removal by microbial fuel cell with sulphate-reducing bacteria and sulphate-oxidising bacteria anodic biofilm. Bioresour. Technol. 156 14-19. https://doi.org/10.1016/j.biortech.2013.12.129 [ Links ]
PULLES W and ROSE PD (2002) US Patent 7306732 B2. Treatment of Water. [ Links ]
VAN LOOSDRECHT MCM and HEIJNEN SJ (1993) Biofilm bioreactors for waste-water treatment. Trends Biotechnol. 11 (4) 117-121. https://doi.org/10.1016/0167-7799(93)90085-N [ Links ]
WU S, KUSCHK P, WIESSNER A, MULLER J, SAAD R and DONG R (2013) Sulphur transformations in constructed wetlands for wastewater treatment: A review. Ecol. Eng. 52 278-289. https://doi.org/10.1016/j.ecoleng.2012.11.003 [ Links ]
YU T, WU ZB and XU D (2006) Clogging characteristics of the subsurface flow wetland. Environ. Sci. Technol. 29 74-86. [ Links ]
ZHAO L, ZHU W and TONG W (2009) Clogging processes caused by biofilm growth and organic particle accumulation in lab-scale vertical flow constructed wetlands. J. Environ. Sci. 21 (6) 750-757. https://doi.org/10.1016/S1001-0742(08)62336-0 [ Links ]
Received 6 March 2017
Accepted in revised form 4 December 2017
This paper was originally presented at the 2016 Water Institute of Southern Africa (WISA) Biennial Conference, Durban, 15-19 May 2016.
* To whom all correspondence should be addressed. e-mail: craig.sheridan@wits.ac.za

