


Services on Demand
Article
 English (pdf)
 Article in xml format
 Article references
Indicators

Related links
-
 Cited by Google
 -
 Similars in Google
Share

 Permalink
Water SA
On-line version ISSN 1816-7950
Print version ISSN 0378-4738
Water SA vol.44 n.1 Pretoria Jan. 2018
http://dx.doi.org/10.4314/wsa.v44i1.02
http://dx.doi.org/10.4314/wsa.v44i1.02
Development of a coupled dispersive liquid-liquid micro-extraction with supported liquid phase micro-extraction for triclosan determination in wastewater
Thabiso Letseka; Mosotho J George*
Department of Chemistry and Chemical Technology, National University of Lesotho, P.O. Roma 180, Lesotho
ABSTRACT
As attention is drawn towards the monitoring of the so-called emerging pollutants, some common household chemicals are not well researched. Household antimicrobials can also present wastewater treatment challenges if not taken cognisance of. Herein we report the application of a recently reported coupled dispersive liquid-liquid micro-extraction (DLLME) with supported liquid phase micro-extraction (LPME) for the extraction of triclosan from wastewater. A univariate approach was used to investigate various parameters amenable to DLLME while no attempt was made to optimise the LPME, achieving the following optimum conditions: 25 µL of a 1:1 toluene-chloroform mixture with 10% sodium chloride into 1 mL aqueous triclosan solutions and extraction time of 15 min achieving an enrichment efficiency 167 times the reference solution prepared with distilled water, good linearity (R2 = 0.9946) with the estimated limit of detection at 0.013 µg/mL and good repeatability (%RSD ≤ 10). The method showed considerable ruggedness with a similar linearity (R2 = 0.9957) and repeatability (%RSD < 10), with only the limit of detection being compromised (0.31 µg/mL) when applied to a wastewater sample using a matrix-matched standard addition approach. Although the GC-FID method detected triclosan in the wastewater sample, the results were negated by those from the GC-MS; as such it therefore could not be concluded with confidence whether the water contained any triclosan or not. However, the results demonstrated the potential of this method in determination of triclosan in water-based samples when the extraction was coupled to a more rugged system such as a GC-MS.
Keywords: dispersive liquid-liquid microextraction, liquid phase microextraction, coupling, mixed-solvents, triclosan, wastewater
INTRODUCTION
Environmental monitoring remains a daunting challenge for environmental health practitioners and regulators with the continual entry of new chemical compounds into the ecosystem from various sources, which has resulted in coining of the term 'emerging pollutants' (Dimpe and Nomngongo, 2016), owing to the fact that these compounds have not traditionally been of major concern until recently. At the top of this list are the pharmaceuticals (Oliveira et al., 2015), since these are used widely for improving human health. Domestic products are some of the least investigated pharmaceuticals as they are not as widely reported as their medical counterparts. Many domestic products contain antimicrobials that can present a potential disturbance to the natural ecosystem if they are disposed of indiscriminately (Kookana et al., 2014; Zhang et al., 2016). The most commonly used antimicrobials include triclocarban and triclosan that are reportedly used in most domestic personal hygiene products such as hand and body washes, toothpastes, mouth rinses, and in fabrics and plastics to inhibit microbial growth (Thompson et al., 2005). Due to their extensive use, these compounds have been detected in human body fluids such as plasma, urine and breast milk (Silva and Nogueira, 2007).
Environmental monitoring studies have indicated that these compounds are also present in various aquatic environments such as rivers, estuarine water and drinking water, as a result of discharges from wastewater treatment plants (Peng et al., 2016; Madikizela et al., 2017). Triclosan was among the top 7 organic wastewater contaminants found in samples from a network of 139 streams across 30 states in 1999 and 2000 by the United States Geological Survey. Concentrations of up to 74 ng/L were detected in lakes and rivers in Switzerland (Lindström et al., 2002), and in wastewater treatment plant influent in the United States of America, Sweden, Switzerland and Denmark with concentrations ranging from 0.1 to 16.6 μg/L, while concentrations in the effluent ranged from 0.1 to 2.7 μg/L and concentrations in the sludge ranged from 0.028 to 15.6 μg/L (Samsøe-Petersen et al., 2003). Further information on environmental risk assessment of triclosan is available in the EPA publication 'Preliminary ecological hazard and environmental risk assessment science chapter for the triclosan reregistration eligibility decision document' (USEPA, 2008).
This widespread use of these antimicrobials makes them somewhat ubiquitous in the environment, since they cannot undergo microbial degradation. This warrants some serious attention regarding the environmental fate of these chemicals. Consequently, a number of methods are being developed and reported regularly for monitoring of these chemicals (Silva and Nogueira, 2007; Jorge et al., 2009). The most preferred methods are those involving chromatography since they include the online separation of a usually highly complex matrix in which these compounds occur in the environment (George et al., 2014). However, given the complexity of the said matrices, sample preparation is usually paramount to reduce this complexity, remove interference, increase the concentration of the analytes as well as convert those not analysable to be analysable prior to the instrumental analysis. In this respect, liquid-based methods are receiving a lot of attention owing mostly to their ease of modification, affordability, lack of or low sample carry-over and the speed of sampling, relative to their solid-based counterparts (Sarafraz-Yazdi and Amiri, 2010).
A number of liquid-based methods have been and continue to be reported with success since the first publication of the miniaturised drop-based method in the mid-1990s (Dasgupta and Lui, 1996). Three main classes have been reported, namely, supported liquid phase microextraction (LPME) using hollow-fibre membranes impregnated or filled with the organic solvent (Audunsson, 1986; Ho et al., 2002), dispersive liquid-liquid microextraction (DLLME) (Rezaee et al., 2006) employing a binary organic solvents mixture - extracting and dispersing solvents respectively, and the drop-based formats with their reported modifications, some of which include an introduction of a simple air bubble reportedly for either ensuring dynamic extraction (Farajzadeh et al, 2011) or to increase the extraction kinetics through the increased surface area (Williams et al., 2011). However, these techniques are rarely coupled; so far only two attempts have been reported where a modified dispersive solvent microextraction was coupled to headspace solid phase microextraction with some degree of success, except the technical setbacks of fibre swelling (George et al., 2015), and recently a combination of DLLME with HF-LPME for extraction of atrazine and hexestrol from aqueous solutions achieving good figures of merit intermediate between the two techniques (Letseka and George, 2016). However, despite significant attention to the miniaturised liquid-based methods, they are not receiving as much recognition toward becoming established as official methods, possibly due to the disadvantage of the difficulty in automation (Chimuka et al., 2007), and the reported reluctance of the accreditation bodies to change the existing methods (Pawliszyn, 1995) as well as requiring a well-trained analyst with excellent hand-eye coordination to carefully pipette immiscible layers of similar appearance each time compounds are extracted between an aqueous and organic layer (Juhascik and Jenkins, 2009).
Herein we report the application of the recently reported coupled DLLME with HF-LPME (Letseka and George, 2016) for the determination of triclosan from wastewater samples obtained from a sewage water pond that is earmarked for production of biogas using microbial degradation of sewage algae.
EXPERIMENTAL
Chemical and standard solutions
Triclosan [5-Chloro-2-(2,4-dichlorophenoxy)phenol, CAS 3380-34-5] and diphenylamine were obtained from Sigma Aldrich (Johannesburg, South Africa). Acetonitrile, ethanol, ethylacetate, chloroform and toluene were obtained from Riedel-de Haën (Seelze, Germany), and NaCl was obtained from ACE (Johannesburg South Africa). The distilled water was prepared in-house using an ELGA PURELAB Option-Q (London, UK) water system. The Accruel Q3/2 PP polypropylene hollow fibre membrane with dimensions of 600 μm (internal diameter) × 200 μm (wall thickness) × 0.2 μm (pore size) was obtained from Membrana GmbH (Wuppertal Germany) and cut in 1 cm strips using a measuring ruler and a pair of scissors.
The standard stock of concentration 10 mg/mL was prepared by dissolving pre-weighed amounts of triclosan in 1 mL of ethanol. This solution was diluted serially to achieve lower working concentrations as necessary using ethanol or water. All of the solutions were stored in the refrigerator at temperatures below 5°C when not in use.
Instrumentation
Following the extraction of triclosan during optimization, the analysis was carried out using a Varian 3800 Gas Chromatograph (California, USA) equipped with a flame ionization detector and a 30 m × 1 μm × 0.53 mm SGE-BP5 (5% phenyl-95% dimethyl-polysiloxane) column (Texas, USA). Nitrogen gas (5.0 Grade) was used as a carrier gas and maintained at 5 mL/min while hydrogen and air were used for the detector. The injector and detector temperature were set at 250°C and 200°C, respectively. The column was held at 100°C for 2 min, then ramped at 20°C/min to 300°C and held for 3 min to achieve a total run time of 15 min.
For the determination of triclosan in wastewater, the secondary analysis was carried out using a Shimadzu QP2010 GC-MS (Kyoto, Japan) fitted with an Rtx-5ms capillary column of 30 m x 0.25 mm x 0.25 μm dimensions with the same gas chromatograph settings as above, including the use of helium (Grade 5.0) as a carrier gas at a flow rate of 1 mL/min. The mass spectrometer settings included the electron impact voltage of 70 eV with acquisition carried out relative to the tune file, the ion source temperature was set at 200°C and that of the interface at 240°C. Initially the acquisition was set on full scan with the m/z values in the range 50-350 for identification, followed by selected ion monitoring using the m/z values 288 and 218 as a reference and qualifying ions, respectively, derived from the mass spectrum of triclosan standard.
Extraction procedure
The extraction procedure was followed as described elsewhere (Letseka and George, 2016). The 1-mL volumes of 25-µg/mL aqueous triclosan solutions were spiked with 25 µL of an organic solvent (or solvent mixture) and shaken vigorously to achieve homogeneity. After being allowed to stand, a 1-cm long hollow fibre membrane filled with the extracting solvent fitted at the tip of the Hamilton syringe was introduced carefully into the solution. After the extraction time had elapsed, 3 μL was withdrawn and injected into the gas chromatograph for analysis. Different parameters, namely, effect of the different dispersed organic solvent, effect of different compositions of the binary solvent mixture, effect of ionic strength and extraction time, were assessed for their effect on the extraction of triclosan in a univariate fashion.
Among the most commonly studied parameters are ionic strength and H+ ion activity, commonly referred to as pH. However, owing to the weak ionisation ability, pKa = 7.9, triclosan would not be affected that much by the variation of pH of the aqueous solutions. Hence this parameter was not studied.
Real water sampling
The method's applicability to real samples was assessed using water samples from a river and the sewage treatment pond. The water samples were collected in 50-mL Schott bottles as follows: wastewater sample was obtained from the old sewage treatment ponds north of the National University of Lesotho (NUL) Roma campus in Maseru. Despite being decommissioned, this pond system still receives a considerable amount of wastewater from the university residence. As has been stated, this pond is the subject of the biofuel generation project through the enhanced microbial biodegradation of sewage algae. The river water samples were collected from Liphiring River about 3 to 4 km north-west of the Roma campus, and a few meters upstream of the road bridge to avoid the potential traffic-induced organic pollution. The samples were stored in a refrigerator at 5°C till further use. Once the optimised conditions were determined, the samples were subjected to the same treatment as the aqueous surrogates with and without being spiked with the triclosan standard.
The wastewater sample was further subjected to standard addition given the higher recovery that was recorded compared to the river water sample. The matrix-matched linear regression analysis was carried out to determine the linearity, limits of detection and the concentration of triclosan in the sewage water sample.
All the analyses were carried out in triplicate unless otherwise stated under the relevant section of the results and discussion.
RESULTS AND DISCUSSION
Optimization of extraction conditions
Determination of the ideal solvent mixture of the pre-dispersed organic solvent
One of the attributes of solvent microextraction is the ease with which one can change from one solvent to the other for improved extraction. Consequently, the effect of changing solvents on the extraction of triclosan was evaluated for different solvents after dispersing these solvents in respective solutions: methanol, acetonitrile, chloroform, ethylacetate, and toluene, as well as their binary mixtures, having noted the importance of solvent mixtures on extraction improvement (George et al., 2015). Figure 1 shows the representative behaviour for the different solvents and their mixtures following their dispersion and extraction.
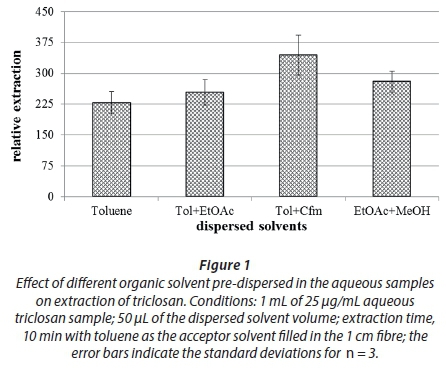
From Fig. 1, it can be seen that the toluene-chloroform mixture (denoted as Tol+Cfm) out-performed the rest of the mixtures, even those not appearing in the figure. The higher extraction with chloroform mixture could be due to the compensatory behaviour of the two solvents; toluene being non-polar and aromatic offers some π-π interactions with triclosan while the chloroform interacts with the polar side of the triclosan. The drop with ethylacetate could be attributed to the greater solubility of this solvent in water, hence leading to a lower recovery of this solvent in the acceptor solvent. Consequently, the toluene-chloroform mixture was chosen as the best dispersing solvent mixture for the subsequent experiments.
Determination of the most effective toluene-chloroform volume ratio on the extraction
To determine the best solvent mixture, different toluene-chloroform mixtures were prepared and spiked into the 1-mL aqueous samples and extracted appropriately. Figure 2 shows the effect of differing toluene-chloroform compositions spiked into the surrogate aqueous solution on the extraction efficiency.
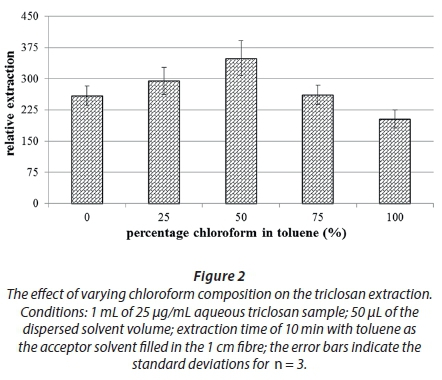
From Fig. 2, a 1:1 mixing ratio of the two solvents demonstrated the highest degree of extraction; consequently, it was regarded as the optimum ratio. The increase in extraction efficiency could be due to the increased polarity of the extracting solution as chloroform is more polar than toluene thus making triclosan more soluble in the extracting solvent, while toluene still offers π-π interactions as mentioned earlier. The decrease in efficiency beyond 50% could be attributed to the fact that there is more solvent remaining in the aqueous solution after the extraction which still can retain the pre-extracted analytes.
Determination of the ideal volume of the pre-dispersed organic solvent
From the previous experiment with related compounds, toluene was chosen as a base solvent given its aromatic nature relative to the analytes; hence it was still applicable for triclosan, and analytes of interest in the current study. Several 5 µg/mL × 1-mL surrogate aqueous solutions were spiked with different volumes of toluene and subjected to 10-min extractions. Figure 3 shows the effect of varying the volume of the dispersed toluene-chloroform mixture on the extraction of triclosan.
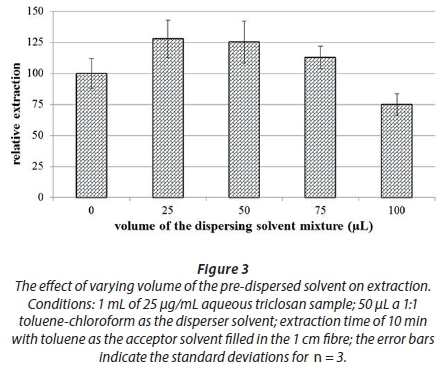
The results in Fig. 3 are referenced against a simple HF-LPME where no dispersing solvent was added to the aqueous solution. As can be seen, the volumes of 25 and 50 µL of toluene-chloroform mixture resulted in an approx. 25% increase over a simple HF-LPME. The results are consistent with those reported previously (Letseka and George, 2016), in that beyond 25 µL of the toluene-chloroform mixture some sedimentation started to form. The lower volume of the dispersed solvent leads to concentration of triclosan due to the higher volume ratio of the aqueous to organic solvent. However, this makes the organic solvent less accessible to the acceptor phase, while at the higher volume of the dispersed solvents the concentration of the analytes gets diluted, and since not all of the organic solvent dispersed in the aqueous solution is completely absorbed into the acceptor phase, a lot of the sample remains in the aqueous solution still dissolved in the dispersed solvents. Consequently, 25 µL was chosen as the ideal solvent volume since the appearance of sedimentation was slow and allowed the 10-min extraction to be completed with only limited intermittent sedimentation being observed in some (and not all) of the trials. The smaller volume used also leads to a smaller volume of organic solvent being discarded as waste after the extraction process is complete.
Effect of increased ionic strength of the aqueous solution on extraction efficiency
The addition of salt is traditionally used to increase the extraction efficiency due to the salting-out effect. This effect is also employed in an effort to increase the ionic strength of the solutions to mimic the natural environmental conditions, as environmental water contains a myriad of dissolved salts that can significantly increase its ionic strength. Usually, sodium chloride is used (Sharifi et al., 2016), with only a few reports of sodium sulphate for this purpose (Zambonin and Palmisano, 2000). This was found to stabilise organic droplets in drop-based methods while also reducing the miscibility of the two solvents (George, 2016). Different amounts of NaCl were added to the 1-mL aqueous surrogates and extracted accordingly. Figure 4 shows the effect of varying NaCl between 0 and 20% (w/v).
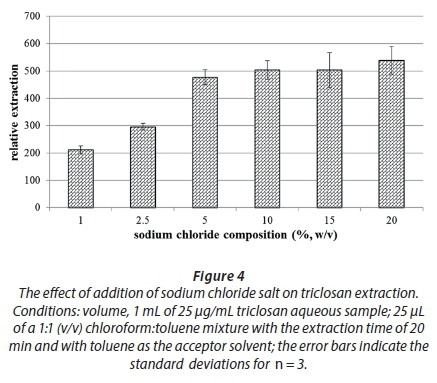
As can be seen from Fig. 4, the extraction efficiency increases with sodium chloride percentage composition until around 10% and is sustained thereafter. The increase can be attributed to the salting-out phenomenon, while the stable part beyond 10% NaCl is difficult to explain. There are reports that at higher NaCl concentrations, not only do the analytes salt out, but even the extracting solvent, hence resulting in a reduction in extraction efficiency (Chen et al., 2014). Therefore, 10% NaCl was chosen to afford the optimum ionic strength.
The effect of varying the extraction time on the extraction
Owing to the fact that the LPME system exposes a much lower surface for mass transfer than both DLLME and drop-based methods, it is typified by the considerably longer extraction times than the other two named techniques. Figure 5 shows the extraction-time profile under the optimised conditions as determined in the preceding sections.
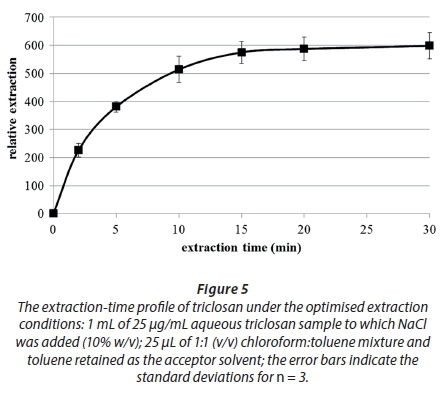
Figure 5 shows that the extraction efficiency increased with time and peaked at around 15 min after which it remained almost constant. This observed extraction time is significantly shorter than the extraction times reported for classical LPME, which takes about 4 to 5 times longer (Chimuka et al., 2007). This therefore is a significant improvement in the extraction rate. The extraction time of 15 min was therefore chosen as an ideal extraction time without stirring - stirring could possibly decrease this time even further.
Validation of the method using the optimised conditions
The optimum conditions can be summarised as follows: spiking of 1 mL aqueous sample solutions with 25 μL of 1:1 toluene:chloroform mixture, 0.1 g (10% m/v) NaCl with the static extraction time of 15 min. The usual validation parameters applicable to newly-developed methods were determined under the optimised conditions (Table 1).
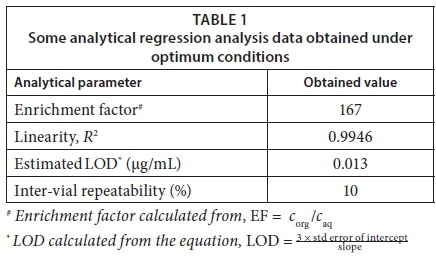
As can be seen in Table 1, the optimised method yielded a very good enrichment factor of 167 relative to the aqueous solution. This is almost double the value obtained with atrazine (87) in the previous study (Letseka and George, 2016). This could be related to the reported poor solubility of triclosan in water, 0.01 g/L; as compared to atrazine with about 3.5 times higher solubility than triclosan at 34.7 mg/L. Since triclosan is less soluble in water, it extracts more into the organic solvent thereby achieving higher enrichment factors. The method further demonstrated sufficient linearity (R2 = 0.9946) in the range 0.1-20 µg/mL, with satisfactory inter-vial repeatability (%RSD < 10%) at a concentration of 1 µg/mL (n = 3) and a limit of detection of 0.013 µg/mL which, interestingly, matched those obtained for the other two analytes, atrazine - 0.018 µg/mL and hexestrol - 0.016 µg/mL, determined using the same approach (Letseka and George, 2016); this is despite triclosan's superior enrichment factor. This could point towards the drawback of the statistical method of determination of limits of detection that relies heavily on the method's analytical sensitivity (slope) (Vial and Jardy, 1999), as opposed to deriving this directly from the 3 × S/N ratio, which is also considered too subjective by other researchers (Ribani et al., 2007). The repeatability of the method was assessed for both inter- and intra-vial, although only the entry for inter-vial repeatability was noted as this was the approach that was used consistently. Accuracy validation was not carried out due to the unavailability of the corresponding certified reference samples.
Application of the extraction method for the determination of triclosan in wastewater samples
The applicability of the method to the real samples, the river and sewage water samples, was carried out by treating the samples as the aqueous surrogates and extracting them under the optimised conditions. The sewage water sample showed a small peak at about the same retention time as triclosan (11 min), while the river water sample did not show anything. The spiked samples showed recoveries of 102% and 140% for river and wastewater samples, respectively, meaning that the triclosan in the analyte could have contributed about 40% of the standard, translating to about 0.4 µg/mL triclosan. Considering that related studies obtained much lower levels of triclosan in sewage water, and the fact that the detector used, FID, is non-discriminatory, prompted the determination of the triclosan in a matrix-matched approach where the matrix effect will be reduced.
To achieve this feat, the wastewater sample was spiked with different volumes of the triclosan standard to achieve different concentrations. These solutions were thereafter extracted and analysed appropriately following the standard addition approach. Table 2 shows the parameters obtained from the regression analysis.
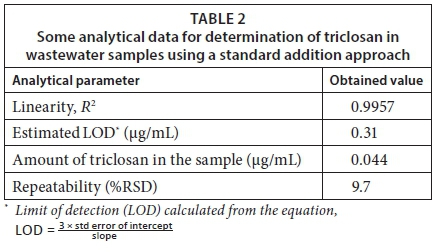
From Table 2, it is clear that the signal obtained with the wastewater could not be attributed to triclosan only. The obtained level with the standard addition approach is far below the LOD of the method (0.31 µg/mL), and hence it is also below the quantitation limit of the method since the quantitation limit is about three times the LOD. Therefore, the obtained amount of 0.044 µg/mL has no significance and as such cannot be stated with confidence. However, this value is considered much better than the 0.4 µg/mL obtained with an external calibration approach, emphasising the importance of the standard addition method in reducing the negative matrix effect.
Given the inconsistency of the obtained amounts of triclosan with the different approaches, namely, external calibration and standard addition, a confirmatory test was carried out using a GC-MS as described in the instrumentation section, using a scanning mode for a simple screening and using selected ion monitoring for quantification. The results demonstrated that the peak at the retention time of triclosan observed during the GC-FID analysis was probably a different compound as triclosan was not detected using a GC-MS, which is a more powerful technique and better suited to identification applications. Given that the GC-MS previously obtained detection limits about three orders of magnitude lower than GC-FID for an optimised extraction for atrazine and hexestrol (Letseka and George, 2016), it was considered prudent to disregard the GC-FID results (showing presence of triclosan) in favour of those from the GC-MS (showing absence or presence below detectable levels). The low level of triclosan, below the detection limits of the method and the instrument, in the wastewater could be explained by its low water-solubility, thus leading to very low amounts dissolving in the wastewater, with the bulk, if any, precipitating out or adsorbing to any solid suspensions present in the pond and thus making it unavailable to the extraction method. Another important factor to consider is that a survey of the antimicrobial-containing products in the local markets around the NUL campus found that they mostly contained triclocarban, further supporting the low levels of dissolved triclosan in the water sample.
However, given the importance of this sewage pond, which has been designated for the production of biogas from sewage microalgae using some microbial agents, it is important to ascertain this amount with confidence, lest it presents negative effects to the microbial activity and hence the biogas yield, should triclosan be present in the sewage water. Therefore, this pond system will be a subject of further studies with better developed and exhaustive techniques such as solid phase extraction coupled to mass spectrometric detection, in order to determine this compound with better confidence.
CONCLUSIONS
The reported method, LPME coupled with DLLME, has demonstrated sufficient applicability in the determination of triclosan, one of the most commonly used domestic antimicrobials. Under the optimum conditions, namely, 25 µL of 1:1 (v/v) chloroform:toluene, 10% NaCl, with 15 min extraction time, the method demonstrated satisfactory figures of merit, including enrichment factor (167), sufficiently low detection limits (0.013 µg/mL) with the use of a flame ionization detector, sufficient linearity (R2 = 0.9946) and significant inter-vial repeatability with %RSD < 10 for n = 3 samples, using external standard calibration.
Comparable parameters were still obtained using the matrix-matched standard addition approach, linearity (R2 = 0.9957), and inter-vial repeatability (%RSD = 9.7%), with only the limit of detection being compromised (0.31 compared to 0.013 µg/mL obtained with standards). However, spurious results were obtained in the application of the method to the sewage water samples, in that the amount of triclosan (0.044 µg/mL) was found to be below the limit of detection (0.31 µg/mL) while using the GC-FID, hinting that the obtained results could be a result of some interference. The GC-MS analysis did not pick up any triclosan in the water sample from both the scanning and selected ion monitoring.
Despite not detecting this analyte, the obtained results still suggest that the coupled dispersive liquid-liquid microextraction with hollow-fibre liquid phase microextraction can claim a place in the extraction protocols for trace analysis of organic pollutants. The results further demonstrate the rigour of the standard addition approach that is so seldom used and reported in literature. On an environmental note, these results do not presume that there is absolutely no triclosan in the river sample, nor the sewage pond; follow-on studies with more exhaustive techniques, such as solid phase extraction, are therefore recommended to confirm or disprove the absence reported herein.
REFERENCES
AUDUNSSON G (1986) Aqueous/aqueous extraction by means of a liquid membrane for sample cleanup and preconcentration of amines in a flow system. Anal. Chem. 58 (13) 2714-2723. https://doi.org/10.1021/ac00126a030 [ Links ]
CHEN PS, HUANG WY and HUANG SD (2014) Analysis of triazine herbicies using an up-and-down-shaker-assisted dispersive liquid-liquid microextraction coupled with gas chromatography mass spectrometry. J. Chromatogr. B 955 116-123. https://doi.org/10.1016/j.jchromb.2014.02.032 [ Links ]
CHIMUKA L, NEFALE F and MASEVHE A (2007) Determination of phenols in water samples using a supported liquid membrane probe and liquid chromatography with photodiode array detection. S. Afr. J. Chem. 60 102-108. [ Links ]
DASGUPTA PK and LUI H (1996) Analytical chemistry in a drop. Solvent extraction in a microdrop. Anal. Chem. 68 (11) 1817-1821. https://doi/abs/10.1021/ac960145h [ Links ]
DIMPE MK and NOMNGONGO PN (2016) Current sample preparation methodologies for analysis of emerging pollutants in different environmental matrices. Trends Anal. Chem. 82 199-207. https://doi.org/10.1016/j.trac.2016.05.023 [ Links ]
FARAJZADEH M, DJOZAN D and KHORRAM P (2011) Development of a new microextraction method based on a dynamic single drop in a narrow-bore tube: application in extraction and preconcentration of some organic pollutants in well water and grape juice samples. Talanta 85 (2) 1135-1142. https://doi.org/10.1016/j.talanta.2011.05.044 [ Links ]
GEORGE MJ (2016) Application of the mixed-solvent BID-SDME technique for determination of some stilbene hormones in water downstream cattle slaughterhouse using gas chromatography and mass spectrometry. Int. J. Environ. Anal. Chem. 96 (3) 247-256. http://dx.doi.org/10.1080/03067319.2016.1150465 [ Links ]
GEORGE MJ, MARJANOVIC L and WILLIAMS DBG (2014) Detection of atrazine and metolachlor in farm soils: gas chromatgraphy-mass spectrometry-based analysis using the bubble-in-drop single drop micro-extractin (BID-SDME) enrichment method. J. Agric. Food Chem. 62 (31) 7676-7681. https://doi.org/10.1021/jf502411t [ Links ]
GEORGE MJ, MARJANOVIC L and WILLIAMS DBG (2015) Picogram-level quantification of some growth hormones in bovine urine using mixed-solvent bubble-in-drop single drop micro-extraction. Talanta 144 445-450. https://doi.org/10.1016/j.talanta.2015.06.070 [ Links ]
GEORGE MJ, MARJANOVIC L and WILLIAMS DBG (2015) Solvent-assisted headspace sampling using solid phase microextraction for the analysis of phenols in water. Anal. Chem. 87 (19) 9559-9562. https://doi.org/10.1021/acs.analchem.5b02539 [ Links ]
HO TS, PEDERSEN-BIERGAAD S and RASMUSSEN KE (2002) Recovery, enrichment and selectivity in liquid-phase micrextraction: Comparison with convenctional liquid-liquid extraction. J. Chromatogr. A 963 (1) 3-17. https://doi.org/10.1016/S0021-9673(02)00215-7 [ Links ]
JORGE R, ELIS B, CARMEN GJ and LLOMPART M (2009) Trace analysis of parabens, triclosan and related chlorophenols in water by headspace solid-phase microextraction with insitu derivetization and gas chromatography-tandem mass spectrometry. J. Chromatogr. A 1216 (23) 4693-4702. https://doi.org/10.1016/j.chroma.2009.04.025 [ Links ]
JUHASCIK MP and JENKINS AJ (2009) comparison of liquid/liquid and solid-phase extraction for alkaline drugs. J. Chromatogr. Sci. 87 (7) 553-557. https://doi.org/10.1093/chromsci/47.7.553 [ Links ]
KOOKANA R, ALI A, SMITH L and ARSHAD M (2014) Contrasting effects of two antimicrobial agents (triclosan and triclocarban) on biomineralisation of an organophosphate pesticide in soils. Chemosphere 107 360-365. https://doi.org/10.1016/j.chemosphere.2013.12.090 [ Links ]
LETSEKA T and GEORGE MJ (2016) Towards coupling dispersive liquid-liquid microextraction with hollow fibre liquid phase microextraction for extraction of organic pollutants of agricultural origin. Anal. Chem. Res. 10 28-32. https://doi.org/10.1016/j.ancr.2016.11.001 [ Links ]
LINDSTRÖM A, BUERGE IJ, BERGVIST PA, MULLER MD and BUSER RH (2002) Occurence and environmental behavior of the bactericide triclosan and its methyl derivative on surface water and waste water. Environ. Sci. Technol. 36 2322-2329. https://doi.org/10.1021/es0114254 [ Links ]
MADIKIZELA L, TAVENGWA N and CHIMUKA L (2017) Status of pharmaceuticals in African water bodies: Occurrence, removal and analytical methods. J. Environ. Manage. 193 211-220. https://doi.org/10.1016/j.jenvman.2017.02.022 [ Links ]
OLIVEIRA TS, MURPHY M, MENDOLA N, WONG V, CARLSON D and WARING L (2015) Characterization of pharmaceuticals and personal care products in hospital effluent and waste water influent/effluent by direct-injection LC-MS-MS. Sci. Total Environ. 518-519 459-478. https://doi.org/10.1016/j.scitotenv.2015.02.104 [ Links ]
PAWLISZYN J (1995) New directions in sample preparation for analysis of organic compounds. Trends Anal. Chem. 14 (3) 113-122. https://doi.org/10.1016/0165-9936(95)94044-F [ Links ]
PENG J, GAO S, LI J, ZHANG Y, JI Y, SHI H and MAO L (2016) Removal of triclosan via peroxidases-mediated reactions in water: reactions, products and detoxification. J. Hazard. Mater. 310 152-160. https://doi.org/10.1016/j.jhazmat.2016.02.037 [ Links ]
REZAEE M, ASSADI Y and HOSSEINI M-RM (2006) Determination of organic in water using dispersive liquid-liquid microextraction. J. Chromatogr. A 1116 (1-2) 1116-1119. https://doi.org/10.1016/j.chroma.2006.03.007 [ Links ]
RIBANI M, COLLINS C and BOTTOLI CB (2007) Validation of chromatographic methods: evaluation of detection and quantification limits in the determination of impurities in omeprazole. J. Chromatogr. A, 1156 (1-2) 201-205. https://doi.org/10.1016/j.chroma.2006.12.080 [ Links ]
SAMSØE-PETERSEN L, WINTHER-NIELSEN M and MADSEN T (2003) Fate and effects of triclosan. Environmental Project No. 861 2003. Miljøprojekt. Danish Environmental Protection Agency, Copenhagen. 47 pp. [ Links ]
SARAFRAZ-YAZDI A and AMIRI A (2010) Liquid-phase microextraction. Trends Anal. Chem. 29 (1) 1-14. https://doi.org/10.1016/j.trac.2009.10.003 [ Links ]
SHARIFI V, ABBASI A and NOSRATI A (2016) application of hollow fibre liquid-liquid phase microectraction and despersive microextraction techniques in analytical toxicology. J. Food Drug Anal. 24 264-276. https://doi.org/10.1016/j.jfda.2015.10.004 [ Links ]
SILVA ARM and NOGUEIRA JMF (2007) New approach on trace analysis of triclosan in personal care products, biological and environmental matrices. Talanta 74 1498-1504. https://doi.org/10.1016/j.talanta.2007.09.040 [ Links ]
THOMPSON A, GRIFFIN P, STUETZ R and CARTMELL E (2005) The fate and removal of triclosan during wastewater treatment. Water Environ. Res. 77 (1) 63-67. https://doi.org/10.2175/106143005X41636 [ Links ]
USEPA (United States Environmental Protection Agency) (2008) National profile - triclosan. Department of Health and Human Sciences, USEPA, Washington DC. [ Links ]
VIAL J and JARDY A (1999) Experimental comparison of the different approaches to estimate LOD and LOQ of an HPLC Method. Anal. Chem. 71 (14) 2672-2677. https://doi.org/10.1021/ac981179n [ Links ]
WILLIAMS DBG, GEORGE MJ, MEYER R and MARJANOVIC L (2011) Bubbles in solvent microextraction: the influence of intentionally introduced bubbles on extraction efficiency. Anal. Chem. 83 (17) 6713-6716. https://pubs.acs.org/doi/full/10.1021/ac201323z [ Links ]
ZAMBONIN C and PALMISANO F (2000) Determination of triazines in soil leachates by solid-phase microextraction coupled to gas chromatography-mass spectrometry J. Chromatogr. A 874 247-255. https://doi.org/10.1016/S0021-9673(99)01267-4 [ Links ]
ZHANG L, NIU J and WANG, Y (2016) Full life-cycle toxicity assessment on triclosan using rotifer Brachionus calyciflorus. Ecotoxicol. Environ. Saf. 127 30-35. https://doi.org/10.1016/j.ecoenv.2015.12.043 [ Links ]
Received 8 February 2017
Accepted in revised form 30 November 2017
* To whom all correspondence should be addressed. +26652213502; fax: +266 2234 0000; e -mail: jm.george@nul.ls or maluti2005@gmail.com

