


Servicios Personalizados
Articulo
 Inglés (pdf)
 Articulo en XML
 Referencias del artículo
Indicadores

Links relacionados
-
 Citado por Google
 -
 Similares en Google
Compartir

 Permalink
Water SA
versión On-line ISSN 1816-7950
versión impresa ISSN 0378-4738
Water SA vol.44 no.1 Pretoria ene. 2018
http://dx.doi.org/10.4314/wsa.v44i1.01
http://dx.doi.org/10.4314/wsa.v44i1.01
The effect of anaerobic baffled reactor effluent on nitrogen and phosphorus leaching from four soils in a laboratory column experiment
Goitom AdhanomI, *; Jeffrey HughesII; Alfred OdindoIII
ICentre for Water Resources Research, School of Agricultural, Earth and Environmental Sciences, University of KwaZulu-Natal, Private Bag X01, Scottsville 3209, South Africa
IISoil Science, School of Agricultural, Earth and Environmental Sciences, University of KwaZulu-Natal, Private Bag X01, Scottsville 3209, South Africa
IIICrop Science, School of Agricultural, Earth and Environmental Sciences, University of KwaZulu-Natal, Private Bag X01, Scottsville 3209, South Africa
ABSTRACT
Leaching of nitrogen and phosphorus from soil columns during application of anaerobic baffled reactor effluent was evaluated. The soils used were from Inanda (Ia), Cartref (Cf), and Sepane (Se) forms, and a silica sand (SS). Each was packed into duplicate columns (103 mm internal diameter; 200 mm length), four each for up-flow and down-flow leaching. Effluent was delivered continuously for 6, 8 and 35 days at high (32 mm·h-1), medium (16 mm·h-1), and low (2 mm·h-1) rates, respectively. At each flow rate, 9 pore volumes were collected. Leachates were analysed for pH, electrical conductivity (EC), nitrate and phosphate. Leachate pH from all soils was lower than the original effluent (6.4). Leachate EC varied between 0.5 and 0.9 dS·m-1 compared to the effluent EC of 0.84 dS· m-1. At high flow rate, the amount of nitrogen leached was similar from all soils. At low and medium rates, more nitrogen was leached from the coarser-textured SS and Cf than the finer-textured Ia and Se, at both flow directions. Flow direction had a greater effect on nitrogen leaching from finer- than coarser-textured soils. Phosphorus concentrations were higher than the original effluent at medium and high flow rates indicating that the soils were a source of phosphorus. At low flow rate, phosphorus concentrations were much lower than the original effluent, indicating soil retention. Phosphorus leaching was greater from coarser- than finer-textured soils in the up-flow columns, but the opposite occurred in the down-flow columns.
Keywords: anaerobic baffled reactor (ABR) effluent, soil types, effluent application rates, flow direction, leaching, soil column
INTRODUCTION
Urban municipalities in South Africa, in common with many worldwide, are faced with increasing challenges of providing housing and related infrastructure. One of these challenges is that of providing adequate sanitation facilities and safe disposal of the wastes produced. One potential option is to reuse these wastes on agricultural land.
Land application of wastewater provides the opportunity of using the water for irrigation while utilising the chemical, physical, and biological properties of the soil/plant system to assimilate the waste components without adversely affecting soil quality or causing contaminants to be released into water or the atmosphere (Loehr, 1984; Chahal et al., 2011). However, application of wastewater to land can affect both soil and water quality. Reuse of wastewaters should maintain a balance between a productive soil environment for crop production and avoidance of degradation of soil and water resources. Wastewaters used for irrigation could influence the physical, chemical and biological properties of the soils (Feigin et al., 1991; Mathan, 1994; Schipper et al., 1996) which, in turn, play an important role in the transformation of nutrients present in the applied wastewater.
One of the low-cost sanitation technologies that has been successfully used in developing countries such as Indonesia (Malisie, 2008; Reynaud et al., 2009) and India (Eales, 2012) is the decentralized wastewater treatment system that incorporates an anaerobic baffled reactor (ABR). The ABR effluent, and notably the nitrogen (N) and phosphorus (P) that it contains, when applied to soils may be leached or retained in the soil and used by plants. The fate of these elements depends on the soil type, effluent properties, and application rates (Chahal et al., 2011). For example, application of domestic wastewater (5.8 mg·L-1 total P) onto a clay loam resulted in 16% of the applied P being leached (Barton et al., 2005), and application of potato processing wastewater (3.6 mg·L-1 total P) onto a sandy loam resulted in 97% to 155% of the applied P being leached (Zvomuya et al., 2005). Annual N leaching loss under a normal rainfall condition predicted by the HYDRUS coupled DAYCENT model was between 5 and 18 kg·ha-1 N (Yuan et al., 2011). Therefore, safe reuse of wastewater effluents must consider the fate of P and N when applied to land, as well as the presence of possible inorganic pollutants, such as heavy metals, and the pathogenic content of the wastewater. The ABR effluent used in the present study contains very low concentrations of inorganic pollutants (Bame et al., 2013; 2014) and investigating the fate of the pathogenic component of the ABR effluent was not within the scope of this paper.
The N and P in ABR effluent are potentially useful for agricultural production and the effluent thus acts as a source of fertigation. However, if application of the effluent exceeds the capacity of the soil/plant system to utilise these elements and the water supplied, then environmental problems can arise. A study by Bame et al. (2013) showed that soil type plays a major role in affecting the chemical composition of leachates from soils treated with ABR effluent compared to leaching with water and those soils of different properties retained plant nutrients from the effluent in varying amounts.
The effect of application of ABR effluent on the movement of N and P in soils with different properties under conditions of continuous effluent application at controlled flow rates in both up-flow and down-flow columns has not been studied. The objectives of this study therefore were to evaluate in both up-flow and down-flow columns: (i) the effect of soil type on N and P leaching following ABR effluent application, and (ii) the effect of effluent application rate on N and P leaching from soil.
MATERIALS AND METHODS
Soils and effluent
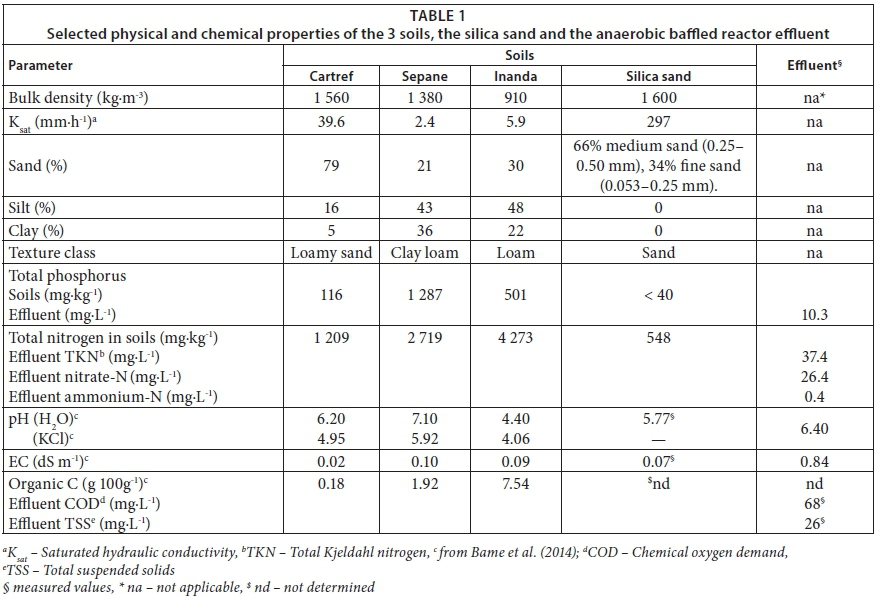
Three contrasting soils and a well-graded silica sand (hereafter included in the term 'soil') were tested to determine their capacity to assimilate N and P from the application of ABR effluent at different flow rates. The soils used were the A horizon of an Inanda form (Ia; Rhodic Hapludox), the E horizon of a Cartref form (Cf; Typic Haplaquept), and the A horizon of a Sepane form (Se; Aquic Haplustalf) (Soil Classification Working Group, 1991; Soil Survey Staff, 2014, respectively); the silica sand (SS) was used as a control material. The soils were air-dried and sieved to pass through a 2-mm mesh. The saturated hydraulic conductivity of the soils was determined using the constant head method (Klute, 1965) and their particle size distribution was determined by the hydrometer method (Bouyoucos, 1962). Initial soil total N was measured using a CNS analyser (LECO CNS-2000) and total P by the molybdenum blue method (Murphy and Riley, 1962) following acid digestion and autoclaving. Soil pH was measured in distilled water and 1 M KCl solution in a 1:2.5 soil: solution ratio (Rowell, 1994) using a radiometer PHM 210 meter. Soil electrical conductivity (EC) was measured in distilled water in a 1:2.5 soil: solution ratio using a CDM 210 EC meter. The ABR effluent was sourced from a pilot plant at Newlands-Mashu near Durban, KwaZulu-Natal, South Africa and total P was determined by the molybdenum blue method and total N by the Kjeldahl method (TKN). The pH and EC of the ABR effluent were measured by a handheld pH/EC probe (HI98312, Hanna instruments Inc.). Selected physical and chemical properties of the soils and effluent are given in Table 1. For more details of the effluent composition, the reader is referred to Bame et al. (2013; 2014).
Column packing and experimental set-up
The soils were prepared by mixing with distilled water to achieve a water content of 20% by volume to enable packing of the columns to their natural bulk densities (Table 1). Each column consisted of a PVC cylinder with an inside diameter of 103 mm and a total length of 200 mm. After fitting a PVC end-cap with rubber O-rings to the base of each column, a layer of gravel (10 mm diameter) was placed in the base of the column and a steel screen and a filter paper placed on top of the gravel to minimize soil loss from the columns during the leaching process. A known volume of wetted soil to produce the depth of each layer was then transferred to each column. Each column was tapped uniformly with a rubber mallet to allow the soil to settle. A paper filter was then laid on top of the soil column and PVC caps fitted with rubber O-rings to prevent leakage were screwed to the top of each column (Fig. 1). Duplicate columns of each soil were prepared giving a total of 8 columns.

Upon completion of the packing, the 8 columns were saturated by up-flow capillary action with 0.01 M CaCl2 to simulate soil solution ionic strength using a standard peristaltic pump (type MHRE, Watson-Marlow Bredel). This method of wetting avoids the possibility of creating dry zones within the soil and prevents the entrapment of air bubbles and channelling in the columns. Once the columns had reached saturation and the flow rate had stabilised, the soils were allowed to drain through the bottom port of the columns.
Pore volume collection, soil sampling and leachate analysis
Following the drainage procedure, columns were placed to allow directional change in flow to simulate (i) continuous saturated conditions using up-flow leaching in 4 of the soil columns, and (ii) typical field conditions where water was applied to the soil surface in the duplicate 4 columns using down-flow leaching. The experiment was started by switching the column input to ABR effluent. The delivery of effluent to a soil column at a specific flow rate was by peristaltic pump (Fig. 2).
The leachate from the columns was collected in round-neck plastic containers based on pore volumes (PVs). The ABR effluent was applied to each of the soil columns at 3 flow rates, i.e., high (4.4 mL·min-1), medium (2.2 mL·min-1), and low (0.304 mL·min-1). These flow rates calculated over the inflow area of the columns were equivalent to about 32, 16 and 2 mm·h-1, respectively. Effluent was applied to the columns continuously for 6 d, 8 d, and 35 d at high, medium and low flow rates, respectively. At these flow rates a total of approximately 35.3 L, 36.6 L, and 26.1 L, respectively, of ABR effluent was applied to the soil columns.
The effluent was applied to all of the columns at the high flow rate, followed by the medium rate and finally at the low flow rate. At each flow rate 9 PVs were collected from each column, before starting with the next lower flow rate. After leaching at the low flow rate, the soils were removed from the columns, and homogeneously mixed. A sample of each soil was analysed for total N and P by the same methods as before and the final gravimetric water content was calculated after drying at 105°C overnight. The pH and EC of the leachates collected from the columns were analysed as described for the ABR effluent. Nitrate and orthophosphate concentrations in the leachate samples were analysed colorimetrically on a discrete photometric analyser (Aquakem 250, Thermo Scientific Gallery).
RESULTS AND DISCUSSION
Leachate EC and pH
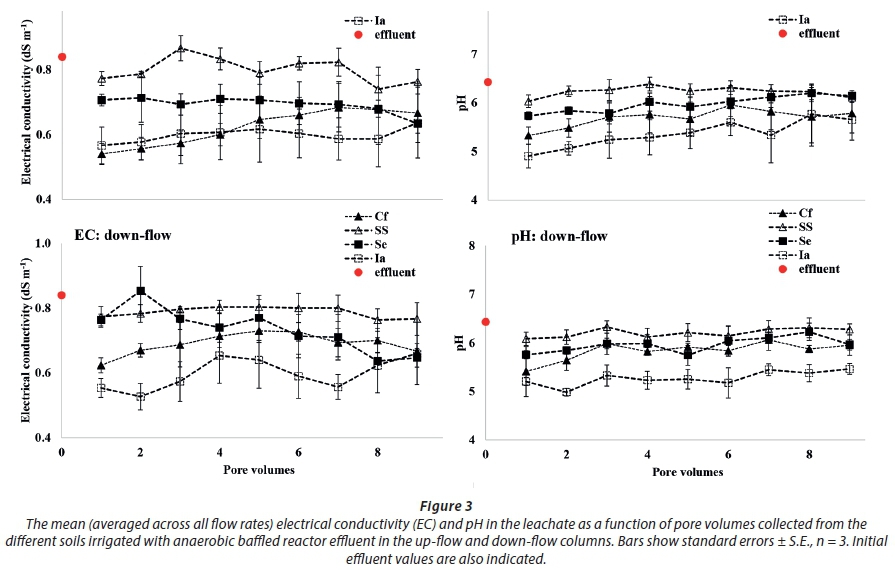
The changes in mean leachate EC, which were averaged across the 3 flow rates collected at each PV are shown in Fig. 3. During the 9 stages of leaching, the mean EC of the leachate at each PV varied between 0.5 and 0.9 dS·m-1 (Fig. 3), compared to the incoming effluent that had an EC of 0.84 dS·m-1 (Table 1). The EC of the leachate at PV1 varied between 0.5 and 0.8 dS·m-1 and after that there was generally an overall gradual increase or decrease in the mean EC values depending on the soil type for the remaining PVs. The Se and SS had the highest EC (0.8 dS·m-1) in the first PV of leachate, while the lowest EC (0.5 dS·m-1) was observed in the leachate of the same PV from the Cf. It was also found that the ABR effluent resulted in higher EC values in the first PVs of leachate compared to the soil EC (Table 1), indicating a low soluble salt (EC) attenuation by the soils. This was further supported by the calculation that 59 to 95% of the applied effluent salts were leached through the soil columns at each PV (Fig. 3). The variation in mean EC values between the 3 flow rates at each PV revealed narrow standard errors in both down-flow and up-flow columns. In addition, the variation in mean EC between PVs for each soil type is quite low (0.05 units).
The EC of the leachate from all the soils, except the Ia, peaked closest to the value of the original effluent at 2, 3 and 5 PVs for the Se, SS, and Cf, respectively. This is in contrast to the expectation that the leachate EC would peak earlier from sandy-textured (SS and Cf) soils than from a finer-textured soil (Se). The EC trend in the Ia may be due to a high adsorption of cations from the effluent causing the soil solution to become more dilute and hence give relatively lower EC values in the leachate as reported by Bame et al. (2014). The EC of the leachate did not show a sharp decline or rise with successive PVs showing that the ions in the leachate attained a gradual equilibrium in the SS, Cf and Se (Fig. 3). This may be due to the continuous supply of effluent that allowed low EC variability between PVs despite the leaching. This suggests that the soil had a minimal impact on the EC of the leachate, after leaching with effluent in a continuous application, resulting in the EC of the leachate being similar to that of the incoming effluent. Similar results were also reported by Kahlon et al. (2013) regarding the effect of soil texture and PVs on the EC of the leachate, though they used columns of sodic soils leached with freshwater.
The pH of the leachate from the Ia and SS soil columns (Fig. 3) was higher than that of the soil (Table 2) throughout the leaching events, but slightly lower than the pH of the original effluent (pH 6.4), which is nearly within an acceptable irrigation water pH range of between 6.5 and 8.0 (Chahal et al., 2011). However, this was not the case for the Cf and Se soils (Fig. 3) where leachate pH was lower than the pH of the soil and effluent (Table 2). The pH of the Ia and SS leachates increased as the amount of effluent entering the soil columns increased, while it decreased in the Cf and Se with final leachate pH values of 6.0 and 6.2, respectively, in the latter 2 soils. Bame et al. (2013), who used Ia and Se soils from the same location as in the present study, and a very similar sandy soil to the Cf, found the same trends in leachate pH in all 3 soils studied from their larger down-flow columns. The effluent is likely to undergo a filtration process as it passes through the soils that will change the chemical characteristics of both the effluent and the soil. This could have caused the fall in pH of the leachate relative to that of the incoming effluent in the Se and Cf soils. The increasing pH of the leachates from the Ia soil with increasing number of PVs was likely a result of the liming effect of the incoming effluent on this initially highly acidic soil, as found by Bame et al. (2013; 2014).
Nitrogen leaching
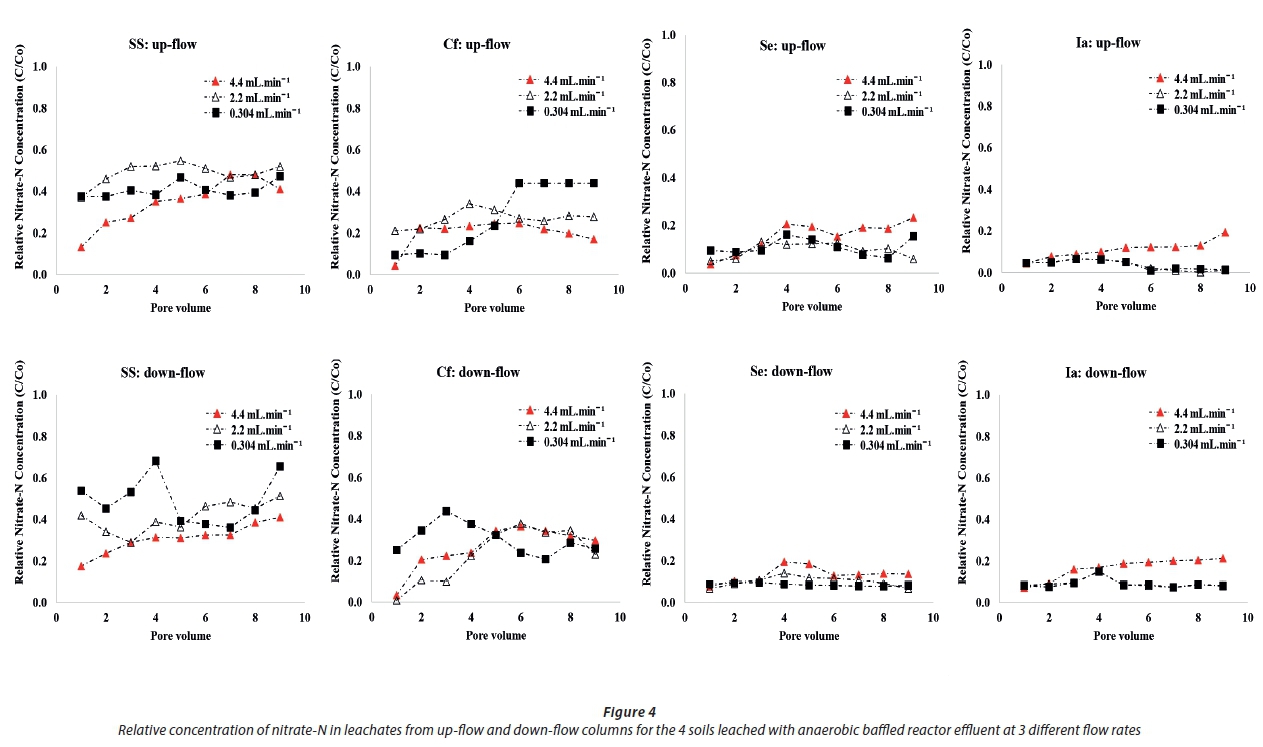
The nitrate-N breakthrough curves were determined by plotting the ratio of the concentration of nitrate-N in the leachate (C) to the total soluble nitrogen-N in the effluent (Co), against PV. The final nitrate-N breakthrough ratio was lower in the Ia and Se soils (C/Co ≤ 0.23) than in the Cf (C/Co = 0.44) and SS (C/Co = 0.68) (Fig. 4). The Se and Ia soils had lower saturated hydraulic conductivities compared to the SS and Cf soils. Moreover, the Se and Ia had higher organic carbon contents (Table 1). These characteristics could promote greater interaction between the Se and Ia soils and the incoming effluent, with subsequent depletion of nitrate through denitrification, a parameter not measured in this study. Sandy-textured soils (SS and Cf), on the other hand, allow relatively high leaching of nitrate due to their higher saturated hydraulic conductivity (Table 1) and lower cation exchange capacity (Bame et al., 2014).
The effect of flow rate on nitrate leaching (Fig. 4) indicated that nitrate-N concentrations from the Ia and Se columns at the high flow rate were higher than at the medium and low flow rates (Fig. 4), which may be due to macro-pore flow at the higher flow rate. The trend in nitrate leaching with low and medium flow rates for the Ia soil in both flow directions was a decrease in the amount of leaching, as well as a delay in the occurrence of maximum leaching with PV with a decrease in the flow rate (Fig. 4; Table 2). This delay in peak nitrate-N leaching may be explained by an increase in the denitrification loss of nitrogen. For example, when the flow rate was decreased from medium to low, the maximum leaching occurred 2 PVs later than at the medium flow rate. On the other hand, in Cf and Se soils under both flow directions, nitrate leaching increased with a decrease in flow rate (Table 2). This increase in nitrate-N leaching in these soils may be attributed to an increased residence time of effluent that promotes oxidation of ammonium in the effluent and organic nitrogen to nitrate thus promoting nitrate leaching. In the SS, flow direction impacted differently such that leached nitrate decreased in the up-flow and increased in the down-flow columns with a decrease in flow rate. The trend in the SS in the up-flow column may be explained by denitrification loss of nitrogen, while ammonification or nitrification might have occurred in the down-flow column.
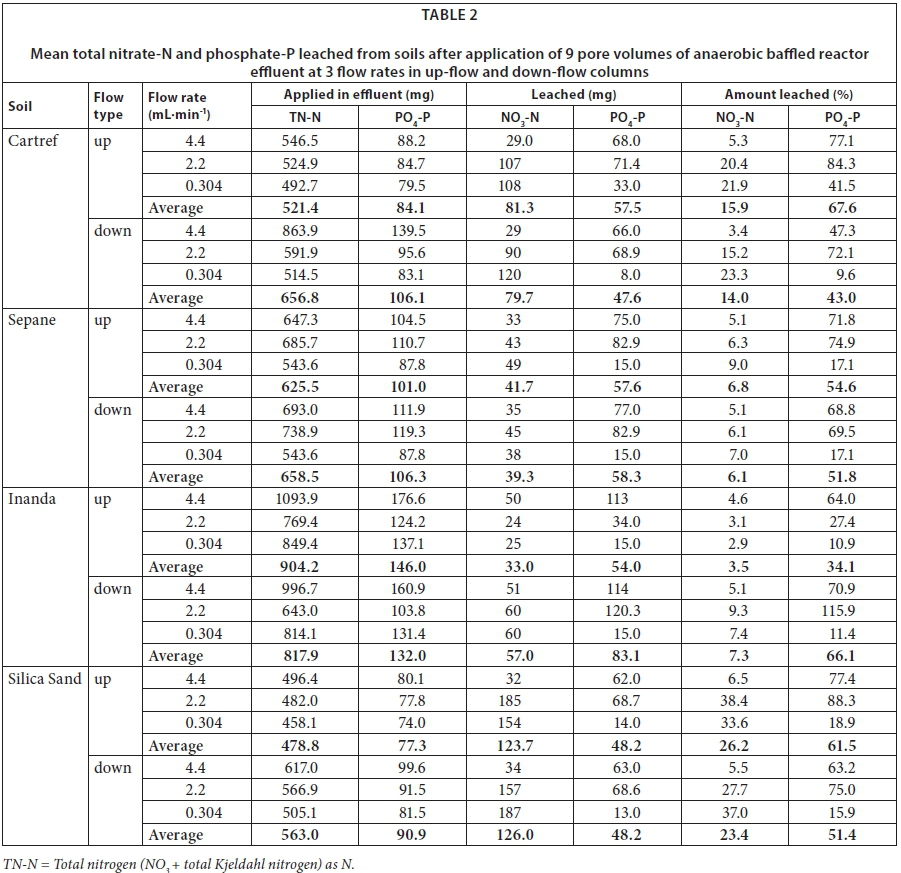
The cumulative nitrate-N leached during the continuous application of effluent to the soils at each flow rate is shown in Fig. 5. At the high application rate, the amount of nitrate leached over the same PVs from all the soils, except the SS, are essentially similar, probably indicating the dominance of piston mode of flow in all the soils. Leaching from the SS was slightly higher than from the other 3 soils, which could be attributed to its higher saturated hydraulic conductivity (Table 1). At the medium and low flow rates (Figs 5b and 5c, respectively; Table 2), however, nitrate leaching showed marked differences between soils in the order of SS > Cf > Se > Ia for the up-flow and SS > Cf > Ia > Se for the down-flow columns.
The difference in nitrate leaching between soils in the down-flow columns seemed to follow the order that the higher the soil saturated hydraulic conductivity the higher the nitrate leaching. In the up-flow columns, the possible reason for a higher leached nitrate from the Se than the Ia may be that the high clay content in the Se allowed a longer residence time and this promoted conversion of ammonium to nitrate, but this could not be verified by the results of this study. Although nitrate-N is generally mobile in all soils, it was observed that it leached faster from the SS and Cf compared to the Ia and Se soils in both flow directions, suggesting that the sandy texture of the former two soils aided more nitrate leaching. This also showed that flow direction had only a minimal effect in causing a noticeable difference in nitrate leaching, except in the Ia and Se soils.
The amounts of nitrate-N leached from the up-flow and down-flow columns (Table 2) averaged over the 3 flow rates for the SS, Cf, Se and Ia were 24.8, 15.0, 6.5 and 5.4%, respectively. In general, the nitrate-N leached was always much lower than the original total nitrogen applied in all soil types (Table 2). Though not measured in this study, denitrification was the most likely source of gaseous loss during the continuous application of effluent under saturated conditions.
In order to understand the significance of soil texture and flow rates on nitrate leaching, the mean cumulative nitrate-N leached from the SS was divided by the mean cumulative leached nitrate-N measured in the Cf, Se and Ia soils at each of the three flow rates. These ratios for the Cf, Se, and Ia, respectively, were 1.1, 1.0 and 0.7 at the high flow rate; 1.7, 4.0, and 5.2 at the medium flow rate, and 1.5, 3.8, and 4.6 at the low flow rate. The ratios at the low and medium flow rates indicate that the effect of effluent application rate on nitrate leaching was higher in coarse-textured than in fine-textured soils. Effluent application at the high flow rate, on the other hand, resulted in similar ratios, showing that a piston mode of flow was the dominant water transport mechanism in these soils, resulting in only small differences in N loss.
Phosphorus leaching
At high effluent application rate, P concentration in the leachates from all soils was initially lower than the original effluent P concentration but increased to above that originally in the effluent with increasing leachate volume. At the medium flow rate, P concentration in the leachates from all soils, except the Ia (up-flow), was always greater than the original P concentration in the effluent (Fig. 6). Less P in the leachate than in the applied effluent for Ia (up-flow) could be due to the retention of P by iron and aluminium oxides and hydroxides in this soil (Bame et al., 2014). The P leaching ratio at the beginning of the effluent application was < 1 due to the displacement of pre-event solution by the effluent diluting the P concentration in the leachate. This ratio was > 1 and became similar to those ratios at the medium flow rate after more than 3 000 mL (6 PVs) of leachate had been collected (Fig. 6).
This suggests that the P sorption capacity of the soils at the high flow rate was saturated at this point, and the high leaching ratios at medium and high flow rates could be a good indicator of the effect of flow rate on the transport process. At the low flow rate, on the other hand, the leachates had a much lower P concentration than that of the original effluent applied over the entire leaching period in all soils (Fig. 6). This could be due to fewer preferential flow paths in the columns at the low flow rate compared to the medium and high flow rates. This means that the low flow rate enabled P to stay longer in the soils thus encouraging more efficient retention of P and hence less leaching.
Despite the fact that phosphate can be strongly adsorbed to soil particles, high concentrations were observed in all leachates under a continuous application of effluent, especially at high and medium flow rates in the soil columns (Fig. 5; Fig. 6). This could be mainly due to the saturated soil conditions and piston mode of movement of the effluent through the soils where macro-pore flow paths contributed to a significant phosphate loading, especially at the higher application rates and under the wet conditions. Enright and Madramootoo (2003) also showed that phosphate could be easily found in subsurface freshwater as the result of macro-pore flow.
Assuming the leachate P breakthrough to be when the leachate P divided by applied effluent P reached 50% of the P applied (C/Co = 0.5), this occurred at PV 1 in the SS, Cf and Se soils. This rapid migration of P in these 3 soils was observed with both flow directions at high and medium flow rates and in the Ia (down-flow) at the high flow rate (Fig. 6). This significant leaching at an early PV indicates the dominance of piston flow in transporting P, which was able to overcome the immobile nature of P in most soils (Van Es et al., 2004). However, this was not the case for the Ia soil (up-flow) at the medium flow rate where C/Co > 0.5 occurred at PV 3. This may have been due to a low gradient of P towards the upper surface of the soil column and/or a relatively high P retention by the soil that delayed the breakthrough point.
The amount of P leached, averaged over all the flow rates, by soil type (Table 2) followed the order: Cf > SS > Se > Ia (up-flow) and Ia > Se > SS > Cf (down-flow). Leaching in the up-flow columns showed that coarse-textured soils leached more P than fine-textured soils, which may be attributed to their high saturated hydraulic conductivity and active flow volume, which is inversely related to the clay content (Glaesner et al., 2011). Unlike the nitrate leaching, the P leaching in down-flow columns from the Se (clay loam) and Ia (loam) soils was higher than from the sandier soils, which agrees with the findings of Djodjic et al. (1999) who showed that, under preferential flow and low active PVs, clay soils leached more P than sandy soils. In addition, the order of P leaching in the down-flow columns is a reflection of initial P values in these soils rather than P applied with the effluent.
In general, a large effluent volume applied over the small area of the columns increased the overall potential P leaching from all the soils. With this in mind, up-flow columns showed higher P leaching compared to down-flow columns for the SS, Cf and Se soils. This suggests that an intense gradient towards the top surface of the soil in the up-flow columns may have caused the physical migration of applied P, in addition to the flow rates that controlled the equilibrium conditions. This implies that the P gradient in the up-flow columns was higher than in the down-flow columns, which thus increased the P concentration in the leachates generated from the up-flow columns. The opposite was true for the Ia, such that the down-flow column leached more P than the up-flow column. In addition, the variability in P leaching between flow directions was larger in the Cf and Ia than in the Se and SS soils. This implies that a steep gradient in P concentration within the column and a more rapid steady state increase resulted in more P in the leachates, while a gentler gradient and a slower equilibrium attainment resulted in less P leaching.
Applicability of findings
In this experiment, the risk of N and P leaching from soil after application of ABR effluent might have been underestimated for N and overestimated for P because the effluent was continuously applied to the soils maintaining permanently wet conditions. These would have led to low P adsorption and large N losses due to denitrification as indicated by the low amount of nitrate leached from all the soils (generally 26.2% or less of the applied N). The results indicated that the risk of P leaching increased in all of the soils, especially when the effluent was applied at high and medium flow rates. The risk of cumulative N leaching was high, especially from the sandy Cf and SS. This may be attributed to the higher saturated hydraulic conductivity of these soils. The trend of N leaching also indicated that different soil types responded differently to effluent application rates. These results therefore have significant agricultural implications should ABR effluent be applied as a source of fertigation for plants.
The conditions imposed on the soils in this study can be considered to represent a worst-case scenario as regards loss of N and P by leaching. Although such conditions would not be expected in real field conditions, there are times when they could be envisaged to occur. One example could be when over-irrigation is necessary to leach an excessive build-up of salts below the root zone, for example at the end of the growing season or before the next growing season. Over-irrigation due to malfunctioning of equipment or poor management could also result in conditions similar to those imposed in the laboratory experiment. A further study that would be of interest is an evaluation of the effects on soil properties of imposing multiple flow rates vis-à-vis single flow rates on the same soil.
The results from this study add to current knowledge of how different moisture regimes and ABR effluent loading rates are linked with N and P leaching. The results from this study can therefore be used to calibrate and validate a water and solute transport model. The calibrated model could be used to create different irrigation scenarios, using different flow rates and initial conditions for different soils. This will then enable the prediction of the impact of various combinations of moisture regimes, nutrient requirements of crops and ABR effluent loading rates on agricultural and environmental indicators.
CONCLUSIONS
The pH of ABR effluent was in the acceptable range of 6.5 to 8.0 for irrigation water, while EC of the effluent was slightly elevated. This suggests that the effluent could be used as a source of fertigation for growing crops. The continuous effluent application to all soils at a controlled flow rate might have underestimated N leaching due to increased denitrification and overestimated P leaching due to low P adsorption. In addition, effluent applied to soils at medium and high flow rates increased the risk of P leaching more in up-flow compared to down-flow columns for the SS, Cf and Se soils. The ABR effluent applied at a low application rate to soils, however, resulted in low P leaching that may enhance soil fertility thus benefiting plant growth. Effluent applied to soils at low and medium flow rates resulted in higher N leaching from the coarser-textured than the finer-textured soils. Flow direction, however, seemed to have only a minimal effect on nitrate leaching from the soils. A relatively low N recovery in the leachates (≤ 26.2% of total N applied) was observed in all soils.
In order to fully assess the risks of N and P leaching, it is necessary to consider the roles of both plants and the subsoil properties. In the present study, the risk of P leaching was probably overestimated because in the field the subsoil would act as a filter to reduce P leaching. Despite the fact that the subsoil may play a major role in reducing leaching, should it become saturated by the application of large volumes of effluent over several days, denitrification would be likely to occur. This could decrease nitrate leaching and at the same time increase the risk of P loss due to piston flow. Plant uptake of both N and P will also influence the leaching behaviour of these elements.
In the pH range of the effluent, up to 26.2% of the applied N and up to 67.6% of the P leached from the test soils as a result of the effluent applications. These leached values reflect the specific experimental conditions imposed on the soil columns and suggest that care should be taken when irrigating using ABR effluent, especially at higher flow rates. It is expected that if plants were grown in the columns, N and P removal efficiency would have been higher resulting in less leaching.
ACKNOWLEDGEMENTS
The Water Research Commission (WRC), South Africa, provided funding for this research as part of WRC Project K5/2220 entitled 'Integrating agriculture in designing on-site, low cost sanitation technologies in social housing schemes'.
REFERENCES
BAME IB, HUGHES JC, TITSHALL W and BUCKLEY CA (2013) Leachate characteristics as influenced by application of anaerobic baffled reactor effluent to three soils: a soil column study. Chemosphere 93 2171-2179. https://doi.org/10.1016/j.chemosphere.2013.07.080 [ Links ]
BAME IB, HUGHES JC, TITSHALL LW and BUCKLEY CA (2014) The effect of irrigation with anaerobic baffled reactor effluent on nutrient availability, soil properties and maize growth. Agric. Water Manage. 134 50-59. https://doi.org/10.1016/j.agwat.2013.11.011 [ Links ]
BARTON L, SCHIPPER LA, BARKLE GF, MCLEOD M, SPEIR TW, TAYLOR MD, MCGIL AC, VAN SCHAIK AP, FITZGERALD NB and PANDEY SP (2005) Land application of domestic effluent onto four soil types: Plant uptake and nutrient leaching. J. Environ. Qual. 34 635-643. https://doi.org/10.2134/jeq2005.0635 [ Links ]
BOUYOUCOS GJ (1962) Hydrometer method improved for making particle size analysis of soils. Agron. J. 54 464-465. https://doi.org/10.2134/agronj1962.00021962005400050028x [ Links ]
CHAHAL MK, TOOR GS, NKEDI-KIZA P and SANTOS BM (2011) Effect of tomato packinghouse wastewater properties on phosphorus and cation leaching in a Spodosol. J. Environ. Qual. 40 999-1009. https://doi.org/10.2134/jeq2010.0369 [ Links ]
DJODJIC F, BERGSTRÖM L, ULÉN B and SHIRMOHAMMADI A (1999) Mode of transport of surface-applied phosphorus-33 through a clay and sandy soil. J. Environ. Qual. 28 1273-1282. https://doi.org/10.2134/jeq1999.00472425002800040031x [ Links ]
EALES K (2012) Community management of decentralized wastewater treatment systems in Indonesia, findings and lessons learned. IWA DEWATS Conference on the Decentralized Wastewater Management in Asia, 20-22 November 2012, Nagpur, India. [ Links ]
ENRIGHT P and MADRAMOOTOO CA (2003) Phosphorus losses in surface runoff and subsurface drainage water on two agricultural fields in Quebec. Canadian Society for Engineering in Agriculture, Food and Biological Systems. CSAE/SCGR Meeting, 6-9 July 2003, Montreal, QC, Canada. [ Links ]
FEIGIN A, RAVINA I and SHALHEVET J (1991) Irrigation with treated sewage effluent: management for environmental protection. Springer-Verlag, Berlin. https://doi.org/10.1007/978-3-642-74480-8 [ Links ]
GLAESNER N, KJAERGAARD C, RUBAEK GH, and MAGID J (2011) Interaction between soil texture and placement of dairy slurry applications: II. Leaching of phosphorus forms. J. Environ. Qual. 40 344-351. https://doi.org/10.2134/jeq2010.0318 [ Links ]
KAHLON UZ, MURTAZA G, MURTAZA B, and HUSSAIN A (2013) Differential response of soil texture for leaching of salts receiving different pore volumes of water in saline sodic soil column. Pak. J. Agric. Sci. 50 191-198. [ Links ]
KLUTE A (1965) Laboratory measurements of hydraulic conductivity of saturated soil. In: Black CA (ed.) Methods of Soil Analysis. Part 1. Agron. Monogr. 9. ASA, Madison, WI. 253-261. [ Links ]
LOEHR RC (1984) Pollution Control for Agriculture. Academic Press, Orlando, FL. [ Links ]
MALISIE AF (2008) Sustainability assessment of on-site sanitation systems for low-income urban areas in Indonesia. PhD thesis, University of Hamburg, Germany. [ Links ]
MATHAN KK (1994) Studies on the influence of long- term municipal sewage effluent irrigation on soil physical properties. Bioresour. Technol. 48 275-276. https://doi.org/10.1016/0960-8524(94)90159-7 [ Links ]
MURPHY J and RILEY JR (1962) A modified single solution method for the determination of phosphate in natural waters. Anal. Chim. Acta 27 31-36. https://doi.org/10.1016/S0003-2670(00)88444-5 [ Links ]
REYNAUD N, BUCKLEY CA and KREBS P (2009) Monitoring results of 108 DEWATS in Indonesia. URL: http://www.susana.org/docs_ccbk/susana_download/2-1660-reynaud--results-of-108-dewats-indonesia.pdf (Accessed 10 January 2017). [ Links ]
ROWELL DL (1994) Soil Science: Methods and Applications. Longman, Harlow, Essex. [ Links ]
SCHIPPER LA, WILLIAMSON JC, KETTLES HA, and SPEIR TW (1996) Impact of land applied tertiary-treated effluent on soil biochemical properties. J. Environ. Qual. 25 1073-1077. https://doi.org/10.2134/jeq1996.00472425002500050020x [ Links ]
SOIL CLASSIFICATION WORKING GROUP (1991) Soil Classification. A Taxonomic System for South Africa. Department of Agriculture and Development, Pretoria, South Africa. [ Links ]
SOIL SURVEY STAFF (2014) Keys to Soil Taxonomy (12th edn). USDA-NRCS, Washington, DC. [ Links ]
VAN ES HM, SCHINDELBECK RR and JOKELA WE (2004) Effect of manure application timing, crop and soil type on phosphorus leaching. J. Environ. Qual. 33 1070-1080. [ Links ]
YUAN F, MEIXNER T, FENN ME and ŠIMŮNEK J (2011) Impact of transient soil water simulation to estimated nitrogen leaching and emission at high- and low-deposition forest sites in Southern California. J. Geophys. Res. 116 1-15. https://doi.org/10.1029/2011JG001644 [ Links ]
ZVOMUYA F, GUPTA SC and ROSEN CJ (2005) Phosphorus leaching in sandy outwash soils following potato-processing wastewater application. J. Environ. Qual. 34 1277-1285. https://doi.org/10.2134/jeq2004.0381 [ Links ]
Received 23 January 2017
Accepted in revised form 29 November 2017
* To whom all correspondence should be addressed. e-mail: goitomta@gmail.com

