


Serviços Personalizados
Artigo
 Inglês (pdf)
 Artigo em XML
 Referências do artigo
Indicadores

Links relacionados
-
 Citado por Google
 -
 Similares em Google
Compartilhar

 Permalink
Water SA
versão On-line ISSN 1816-7950
versão impressa ISSN 0378-4738
Water SA vol.43 no.4 Pretoria Out. 2017
http://dx.doi.org/10.4314/wsa.v43i4.18
Application of the water footprinting method and water accounting framework to a base metal refining process
Ayesha OsmanI, II, III; Frank CrundwellII; Kevin G HardingI; Craig M SheridanI, *
ICentre in Water Research and Development, Industrial and Mining Water Research Unit (IMWaRU), School of Chemical and Metallurgical Engineering, University of the Witwatersrand, Johannesburg, South Africa
IICM Solutions, Unit T5, Pinelands Office Park, 1 Ardeer Road, Modderfontein, 1609, South Africa
IIIDepartment of Civil and Chemical Engineering, College of Science, Engineering and Technology, University of South Africa, Private Bag X6, Florida, 1710, South Africa
ABSTRACT
The key to a sustainable future lies in understanding and utilising resources more efficiently. This holds especially for industries that seek to minimise water usage through better management of resources. Most mineral processing plants have high water requirements, yet often function in an environment where water is becoming increasingly scarce. Further, an increase in population will result in an even greater demand for water, potentially beyond the limits of supply. This would lead to even greater competition for the resource. In South Africa, Gauteng and the North West Provinces are likely to be the first to experience a shortage of potable water. A base metals refinery in Rustenburg sought to understand and minimise its potable water usage, as well as report its usage using global tools and frameworks. The two tools used in this study were the Minerals Council of Australia's 'Water Accounting Framework for the Minerals Industry' (WAF) and the Water Footprinting method (WF). The potable water and stormwater systems were surveyed to assess and determine methods to improve water accountability. Using information from the survey, monthly and yearly water balances were presented in the form of a water balance sheet. Using data from the water balance, an input-output and operational model were drawn up in accordance with the WAF. The WAF models assisted in reporting data in a universally consistent manner. Blue, green and grey WFs were calculated for the refinery and recommendations were made to achieve savings in water consumption.
Keywords: water, base metals, water footprint, water accounting framework
INTRODUCTION
The African continent has been identified as particularly vulnerable to the effects of climate change. The prevalence of existing challenges such as poverty, corrupt governance, ecosystem degradation, natural disasters and conflict, greatly decrease the adaptive capability and exacerbate the vulnerability of the continent to the effects of climate change (Parry et al., 2007). Southern Africa, in particular, is highly susceptible to the possibility of droughts, as a result of heightened water stresses in river basins (Parry et al., 2007) and low rainfall rates. Human activities, such as mining, have also had a negative effect on South Africa's water sources and these effects have been worsened by the expanding economy and population growth (CSIR, 2010)).
The mining industry, in particular, is a major consumer of fresh water, with the copper mining industry using over 1.3 billion m3 of water in 2006 (Gunson et al., 2010). Although water usage by the mining industry accounts for a small percentage (around 2 to 4.5%) of national water usage in mining-concentrated areas such as South Africa, Australia and Chile (Brown, 2013; Bangerter, 2010), the impact can severely affect the availability of fresh water to the local communities by increasing competition or polluting resources.
The key to a sustainable future lies in understanding and utilising resources more efficiently. This holds especially for industries that seek to minimise water usage through the better management of resources.
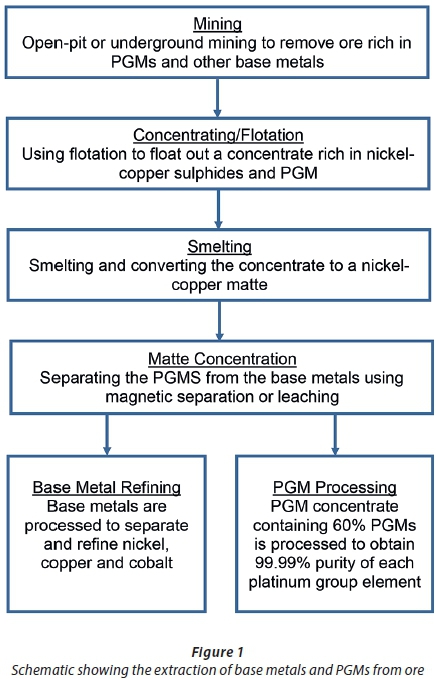
A base metal refinery operating in the North West Province of South Africa was concerned about the sustainability of its operations - particularly regarding its water usage. The refinery operates using a zero-discharge principle which means that no water is released from site and water from contaminated areas is captured during storm events. Ore is processed into saleable base metal products using a hydrometallurgical process which is largely dependent on the availability of potable water. The conventional base metal process, as shown in Fig. 1, typically consists of an underground or open pit mine followed by concentration and smelting processes. The matte concentrate is split into platinum feed and base metal feed. The platinum feed is processed to recover platinum and other precious metals, while the base metal feed is sent to a base metal refinery to be processed into nickel, copper and cobalt products. The base metal refinery requires water for dust control, froth flotation, dilution, reagent mixing, cooling, washing, showers and for pump gland seal water (GSW).
Due to concern about future production interruption or a possible shutdown due to water restrictions, the base metal refinery is striving to reduce its potable water consumption and improve its water accountability to greater than 95%; that is, the refinery would like to account for at least 95% of its water usage. In this way, it aims to understand and manage the resource more effectively by ultimately reducing consumption. Water consumption was reduced in a previous study, (Osman et al., 2013) with the results being used here.
The objective of this paper was to use the water balance results of previous work (Osman et al., 2013), reporting them according to various transparent and globally consistent water assessment methods, in order that they could be compared with other sites. To complete this objective, the Minerals Council of Australia (MCA) Water Accounting Framework (WAF) and Hoekstra's Water Footprinting (WF) methods were used. The aim of the WAF is to obtain a deeper understanding of water usage in the mining industry and allow sites to account for, report on and compare site water management practices. The reporting is performed in a consistent, unambiguous manner that can easily be understood by non-experts and is expressed in the form of a water balance sheet displaying inputs, outputs, water storage or accumulations and water losses (MCA, 2012).
The second method used in this paper was the Water Footprinting (WF) method. WF is the total amount of fresh and virtual water that is consumed, directly and indirectly during a production process. A full WF evaluation aims to reduce the consumption and impacts associated with production. This can be presented as units of water consumed per unit of product produced (Hoekstra, 2003).
METHOD
In order to complete the water accounting framework (WAF) and water footprinting (WF) reports for the site, the following methods were used.
Water accounting framework
The WAF combines an input-output model (with an accuracy statement) and an operational model
Input-output model with accuracy statement
The input-output model provides a report of water inputs and outputs as well as information to add context. Volumetric flows, classified as inputs, diversions or outputs, are reported based on their sources and final end points.
Inputs are classified as volumes of water received by the operation and can be sub-categorised as:
•Surface water (extracted from natural bodies such as lakes and rivers and rainfall runoff or precipitation collected by the facility)
•Groundwater (below the earth's surface or entrained in ore)
•Sea water (water from oceans or estuaries)
•Water supplied by a third party (supplied by external facilities)
Diversions refer to water that is diverted away from the operation and is not used for any tasks.
Outputs are classified as volumes of water that are removed from the operation and can be classified according to the point of receipt outside the facility. Outputs are categorised as:
•Surface water (open to the atmosphere; excluding oceans and estuaries)
•Groundwater (below the earth's surface that could form aquifers or seepage from water stores and tailings)
•Sea water (oceans or estuaries)
•Water supplied to a third party
•Evaporation (water released to the atmosphere during operations)
•Entrainment (lost from the operation in the form of a product or waste stream)
•Other (destinations that are not identified or that cannot be accounted or measured)
Each water input or output has a quality category allocated to it
•Category 1: Water is very close to drinking water and requires minimal treatment (disinfection) in order to ensure it is safe for consumption.
•Category 2: Water requires treatment to remove dissolved solids and adjustment of other parameters before the water is classified as potable.
•Category 3: Water is unsuitable for most purposes and has a salinity of > 5 000 mg/L or a pH of less than 4 or greater than 10. This water requires significant treatment before it can be classified as Category 1 or 2 water.
The accuracy statement provides detail as to whether flows were measured, calculated or estimated. This information has been coupled with the input-output model to provide information as to how flows were obtained.
Operational model
The operational model provides guidance for companies to reduce their water use.
For the operational model, the following definitions have been used:
•Raw water: water received at an input which has not been used
•Worked water: water that has been through equipment or a process
•Treated water: water that has been treated for a particular task, e.g., demineralised water for steam turbines
In order to represent inputs, outputs and operational water in accordance with the framework, the following guideline is to be used.
•Inputs are coloured green
•Outputs are coloured red
•Diversions are coloured yellow
•Stores are coloured blue
•Tasks are coloured grey
•Treatment plants are coloured purple
Data from previous work on site (Osman et al., 2013) was used to draw up the input-output and operational models.
Water footprints
WF can be defined as the total amount of fresh water that is consumed, directly and indirectly, during a production process. A full WF evaluation considers not only the water consumption and its impact, but also makes recommendations to potentially reduce the WFs associated with production (Hoekstra, 2003). The Water Footprint Assessment Manual outlines 4 steps or phases to be followed in completing a WF study. The 4 steps are:
•Setting of goals and scope
•WF accounting
•WF sustainability assessment
•Response formulation
Setting goals and scope
The first step is to identify objectives that are to be achieved from the WF assessment. The scope of the study also needs to be defined. This is done by specifying the system boundaries and time frame of the study. Considerations such as which footprints are of importance and whether supply chain footprints are to be included are decided during this step.
WF accounting
This step entails the collection of data and the calculation of the WF. The total water footprint is classified as the sum of the blue, green and grey water footprints (Eq. 1).

Blue water
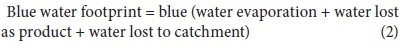
Blue water represents fresh water resources such as surface and ground water that are not returned to the same source. Seawater (water pumped from the ocean) is not included as a blue water source on the basis that the use of sea water does not impact the fresh water resource except if the sea water is discharged to a freshwater body. The blue WF refers to the amount of fresh water that has evaporated, been incorporated into a product or returned to a different location as opposed to its source (Eq. 2):
Green water
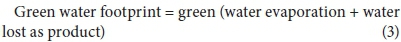
Green water refers to rainwater used during the production process that could have been stored in the soil or temporarily on top of the soil. It can also be described as the amount of rainwater incorporated into the product or lost through evaporation (Eq. 3).
Grey water
The grey WF refers to pollution and is defined as the volume of freshwater that is required to assimilate the load of pollutants given natural background concentrations and existing ambient water quality standards (Eq. 4).

Where:
L is the pollutant load (mass/time)
Cmax is the ambient water quality standard for the pollutant (mass/volume)
Cnat is the natural concentration in the receiving water body (mass/volume)
The refinery operates using a zero-discharge principle. Wastewater is stored on-site and thus no grey WF could be calculated.
WF of a product
A WF can also be calculated for a particular product. This is the total volume of fresh water that is used directly or indirectly in the production process, calculated using either the chain summation approach or the stepwise accumulative method. The chain summation approach is used when only one product or output is produced. The stepwise accumulation method is used when more than one product or output is produced.
For the chain-summation approach, the WF of a product, p, is equal to the sum of the relevant WF divided by the production of the product (Eq. 5).

Where:
WFprod,[p] is the WF (volume/mass) of output or product p
WFproc,[p] is the process WF of the process steps (volume/time)
P[p] is the production quantity of the product p (mass/time)
WF sustainability assessment
The sustainability assessment is used to determine the impact of operations on the local environment and society, as well as the water use compared to local water availability.
WF response formulation
In this step, recommendations are made on how to reduce the impact that the operation has on the local environment. Response formulations can include strategies, targets or policies.
The sustainability assessment and response formulation have been included in the discussion and conclusion sections of this research.
Time frame and boundaries of the on-site study
The study was conducted from November 2010 to October 2011. System boundaries were restricted to the refinery and excluded nearby operations such as smelters or concentrators, i.e., the physical fence surrounding the refinery. Water entering or leaving the site across this boundary was regarded as water into and out of the site.
RESULTS
Water accounting framework
The input-output model and operational model are presented below.
Input-output model with accuracy statement
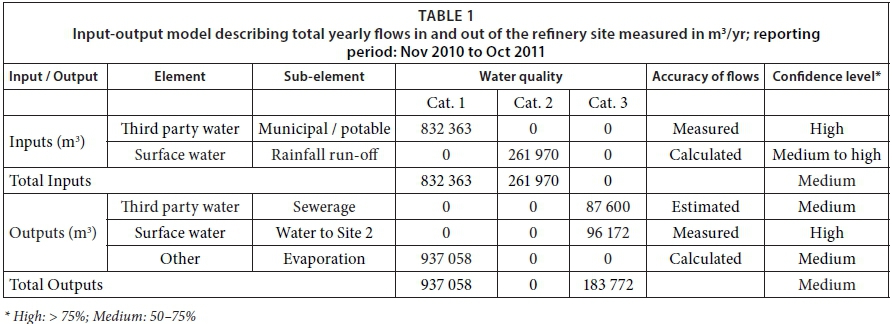
Data obtained from the on-site study (Osman et al., 2013) was used to draw up the input-output and operational model (Table 1).
The input-output model details information regarding all inflows and outflows to and from the site. The flows are classified according their origin and the type of water they contain. Values for the input-output report were obtained from the site water balance.
Inflows to the site were municipal/potable water and rainfall. Municipal water has been classified as Category 1 water as no treatment was required before human consumption. Rainwater run-off from site was collected in rainwater dams. Rainwater and rainwater run-off is not fit for human consumption without some prior treatment and is thus classified as falling in to Category 2 by default. Since the site has a zero-discharge policy, no rainwater was discharged to the environment. The volumetric flow of rain was estimated based on the estimated surface area of the site multiplied by the rainfall measured on site. The accuracy statement has been included with the input-output model and details how flows were obtained as well as confidence levels in the values.
Outflows from the site were evaporation, water transferred to a secondary site which is part of the mine complex (Site 2) and sewage. Evaporation has been classified as Category 1 water because if it were condensed and collected, it would be suitable for drinking purposes. Sewage and the untreated recycled water, sent for use by Site 2, would require significant treatment before the water would be fit for drinking water and has thus been classified as Category 3 water. Site evaporation was calculated in detail for the water balance of 2006. These calculations were modified and used together with evaporation rates obtained from the refinery. Evaporation was calculated per tank and per dam using surface areas. Detailed values are not shown for reasons of confidentiality.
From the on-site study (Osman et al., 2013), water entering with reagents or leaving with products, changes in dam levels, and water flows between sites, have been shown as inflows and outflows from the site.
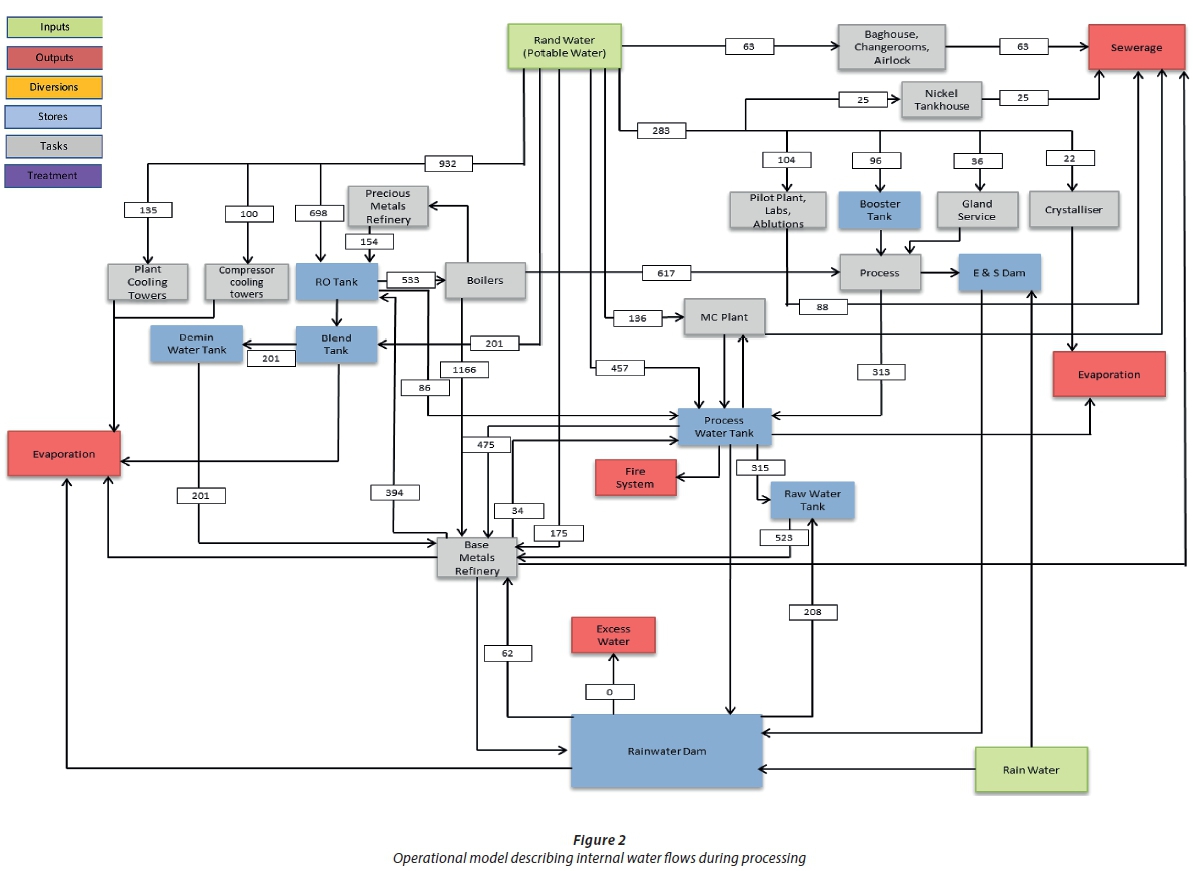
Operational model
The water balance is defined as the 'operational model' by the WAF. In order to represent inputs, outputs and operational water in accordance with the framework, the colour guidelines described in the method were used.
Flowrates used in completing the operational model were obtained from the refinery flowmeter readings shown in the on-site work (Osman et al., 2013). The average daily flowrates for March 2011 are measured in m3/day (Fig. 2).
The operational model provided an indication of on-site water usage during a process. It also showed the complexity of on-site water movement. Water recycling could be seen from the diagram as well as wasteful water flows. An example of a wasteful water flow would have been the use of potable water to top up fire tanks, which in turn provided water to a raw/rainwater tank. The raw/rainwater tank needed to source its water from the dams to provide recycled water for on-site use. This flow of potable water to the fire tank and later the raw water tank was undesirable, as clean water was then being used to provide water for tasks that were able to use secondary/recycled water.
Flows shown in black on the operational model are the measured average daily flowmeter readings obtained from the on-site study (Osman et al., 2013), including those showing a zero flowrate. Lines without flowmeters could not be measured and are not displayed on the operational model. This was due to uncertainties in flowrates and non-disclosure agreements regarding the publication of flowrates that could not be confirmed.
Water footprint
Setting of goals and scope for the refinery
The footprints of the refinery that were calculated were the blue, green and product WF. Supply chain WF's were not included in this research. The refinery does not discharge any wastewater so no dilution water (i.e. grey WF) is required.
The main products produced by the refinery were nickel and copper and these formed 98% of the base metal product. Cobalt was produced in minimal quantities. The WFs were calculated for the base metals (nickel, copper and cobalt) only, as these were the key products produced by the refinery. The chain summation approach was used to calculate the WF of producing 1 t of base metal, as the base metals were regarded as one product together. All the products of the refinery were produced simultaneously and it was not possible to separate the water required to produce individual base metals. The WF of input products was also not known.
WF accounting
The water footprint was calculated for the combined base metals, nickel, copper and cobalt as these were the key products produced by the refinery.
Blue WF
Due to a mixture of blue and green water sources, it was not possible to separate evaporation values for the individual footprints. The blue and green water footprints were thus calculated based on consumption or usage only. Table 2 shows the calculation of the blue water footprint for the refinery.
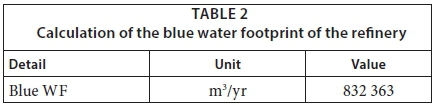
The blue WF of the refinery was calculated to be 832 363 m3/yr.
Green WF
The green water footprint was calculated based on the amount of rainfall that is captured on-site and used during processing or stored. Table 3 shows the calculation of the green water footprint for the Refinery.
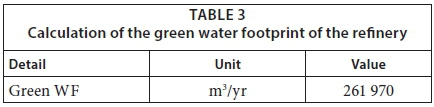
The green WF of the refinery was calculated to be 261 790 m3/yr.
Grey WF
Grey water is the amount of water required to assimilate or dilute pollutants before discharge. The refinery is a zero-discharge site and so no dilution water is required. Thus, no grey WF was calculated.
Product WF
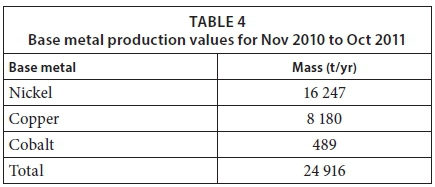
To calculate the WF of the refinery products, the chain-summation formula was used as shown in Eq. 5 of the methodology section. The total amount of base metal produced per year was required to calculate the product WF. Table 4 shows the production values of the base metals for the period Nov 2010 to Oct 2011.
Calculating the product WF:
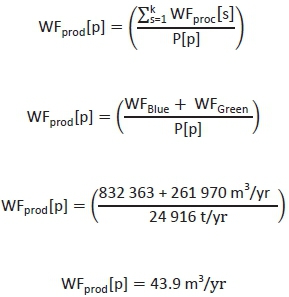
The product WF of the refinery was calculated to be 43.9 m3 of water required to produce 1 t of base metal. The blue WF (76%) contributed more significantly to the product WF than the green WF (24%).
DISCUSSION
Water accounting framework
An input-output model was constructed in accordance with the MCA's WAF. From the model, it was seen that evaporation was 937 058 m3 and was the largest loss of water from the refinery. The evaporative losses per year are 104 696 m3 larger than the potable water (832 363 m3/yr) supplied to the refinery from RWB.
An advantage of the input-output model over other frameworks was the classification of water entering and leaving the site. Water was classified according to quality and source and not simply as an input or discharge from the site. The model also made allowance for confidence levels and mentioned whether the flows were measured or calculated. As a result, assumed flowrates were easily identifiable. Of the water flowing into the site, 24% was of a medium confidence level as the rainfall to site was estimated. The remaining 76% was of a high confidence level as the value was measured using flowmeters. Of the water flowing out of the site, 91% was of a medium confidence level as the values of evaporation and sewage were calculated and estimated respectively. The remaining 9% was of a high confidence level as the value of water pumped between sites is measured using a flowmeter.
An operational model was drawn up in accordance with the MCA WAF. The operational model described internal site water flows during a process. The operational model included water flows between storage facilities on-site to tasks and treatment facilities. The operational model was an indicator of the complexity of on-site water flows. Unwanted recycles or misuse of water were identifiable when the model was studied. One such movement of water was the filling of the rainwater tank from Fire Tank 1. The rainwater tank (water used for washing of floors and cleaning of spills) was to be filled from dam water but was often filled with process water from Fire Tank 1. Fire Tank 1 was topped with potable water when required. Thus, potable water was then indirectly being used instead of water from the dams.
Water footprint
The blue and green WF's of the refinery were calculated to be 832 363 m3/yr and 261 970 m3/yr, respectively. According to Haggard et al. (2015), the blue WF of a platinum mine was 5 537 000 m3/yr, the green WF was 344 000 m3/yr and the grey WF was 5 929 000 m3/yr. The value of the grey WF was high as a significant amount of water was lost through seepage from the tailings dam into underground aquifers. The green WFs of both the mine and the refinery were reasonably comparable (344 000 m3/yr for the platinum mine and 261 970 m3/yr for the refinery). Both the Haggard study and this site are located in North West Province of South Africa but the green WF would depend on size of the site and on how much rainwater was collected. A similar study was performed by Ranchod et al. (2015) to investigate the blue WF of a South African platinum mining operation. It was seen that the largest loss of water during the platinum production process was from evaporation from the mineral processing plant and from the tailings facility. The site used in the study by Haggard et al. (2015) operated using crushing, milling, and smelting, while both Haggard et al., (2015) and Ranchod et al. (2015) utilised a tailings storage facility. The refinery used for this study did not use these processes or tailings facilities as the refinery received treated ore specifically for base metal refining into saleable products.
The product WF was calculated to be 43.9 m3/t of base metal from a sulphide ore feed. Peña and Huijbregts (2013) found that the blue WF of refining sulphide ore was 96 m3 water/t copper for the copper refining process in Chile. The blue WF of the oxide ore refining process, in the study by Peña and Huijbregts (2013) was 40 m3 water/t copper. The WF of the refinery in South Africa uses less water to produce 1 t of base metal from sulphide ores as compared to the copper refining operation in Chile. This may be due to the Chilean operation including the process of crushing and agglomeration whereas the refinery in South Africa receives a crushed, separated feed. For both the refinery in South Africa and the refinery in Chile, evaporation was a major consumer of water.
According to Mudd (2007), an average of 691 m3 of water was required to process 1 kg of gold. Eldorado Gold Corp use between 143 and 407.5 m3 water/kg gold produced. The product WF of a platinum processing plant was calculated to be 201 m3/kg PGM produced (9). These values are significantly higher than the water required to produce 1 t of a base metal. However, gold and PGM's are economically more valuable than copper, nickel or cobalt.
An advantage of the WF method was the classification of blue versus green water. Blue water relied on potable or surface water whilst green water accounted for water from rainfall. It would be a good idea to attempt to reduce the blue WF while increasing the green WF to reduce the amount of potable and surface water used. This is especially important for the refinery which is operating in a water-scarce region.
While the blue, green and product WF provided a good indication of the water usage required by the plant, the grey WF provided no indication of the polluted water that was produced by the process. The reason for this was that the refinery stored the water on-site and did not discharge it. However, the zero-discharge practice means that the grey WF cannot be calculated. Therefore, this method has a significant limitation at this type of site. Allowance should be made in the grey WF for polluted water which is stored and not discharged. Another option would be to create another WF to accommodate polluted water created by a process, irrespective of whether it is stored, diluted or discharged.
CONCLUSIONS
Water accounting framework
Four reports (outputs) were generated using the WAF. The four reports generated provide a good indication of the movement of water into, out of and during a process. Of the water flowing into the site, 24% was of a medium confidence level and 76% was of a high confidence level. Of the water flowing out of the site, 91% was of a medium confidence level and 9% was of a high confidence level. The operational model provided an indication of the complexity of on-site water flows and wasteful water flows were identified.
Water footprinting
WFs were calculated for the process. The blue WF was calculated to be 832 363 m3 and the green WF was calculated to be 261 970 m3 for the period of the study. The product WF was 43.9 m3/t of base metal produced. The refinery did not discharge polluted water and, as a result, no dilution water was required. Thus, no grey WF was calculated. These values were compared to the water usage at other refineries and processing plants and were found to be less than the WFs found in literature. Reasons for this include the fact that the refinery received a crushed, separated feed ore and crushing, agglomeration and smelting were not done at the refinery. The refinery also did not have a tailings storage dam which would have lost water through seepage. The WF method provided a good indication of the surface, potable and rainwater usage by a particular process. Allowance could be made for polluted water that is produced as a result of the operation. This could be done by the creation of an additional WF.
The WAF and WF are not related and do not necessarily feed into each other. They merely report water usage or consumption in different ways. The aim of the study was to report the water usage in a manner that could be globally compared across sites and to set a benchmark for the industry. Using global tools such as the WAF and WF method assisted in reporting site water usage that can now be compared to the water usage at other base metal refineries.
This research provided an opportunity for the refinery to improve water efficiency on-site as well as improve reporting standards. Water usage was reported using global reporting tools to set a comparative benchmark for the base metals industry.
SUMMARY
In this study, the water account and the water footprint were generated for at a specific site. This study was useful for the mine, since the water usage has now been benchmarked. This allows the site to consider further water minimisation studies. Reporting water usage using the WAF and WF method will ensure easier comparison of reports generated and WFs calculated.
As a result of this study, limitations were also found with the methods, especially the WF method. The absence of a grey water footprint is significant. There is scope for further studies to consider how to include or prepare a grey water footprint for zero-discharge sites. This would allow the WF to account for polluted water generated as a result of the process per unit of base metal produced regardless of whether it is discharged or not. The study has also highlighted that there are still gaps in accurate measurement of water (in all its forms) on site, and it may be worthwhile for mines to consider expanding measurement of water and quantification of the impact of the process on water as a way to improve operational sustainability.
REFERENCES
BANGERTER P, DIXON R and VILLEGAS M (2010) Improving overall usage of water in mining-A sustainable development approach. In: Wiertz, J (ed.) 2nd International Congress on Water Management in the Mining Industry, 9-11 June 2010, Santiago. GECAMIN, Santiago [ Links ]
BROWN E (2003) Water for a sustainable minerals industry − a review. Proceedings of Water in Mining 2003. AUSIMM, Brisbane [ Links ]
CSIR (2010) A CSIR perspective on water in South Africa - 2010. CSIR Report No. CSIR/NRE/PW/IR/2011/0012/A. CSIR, Pretoria. [ Links ]
GUNSON AJ, KLEIN B, VEIGA M and KEEVIL NB (2010) Estimating global water withdrawals due to copper mining. In: Wiertz, J (ed.) 2nd International Congress on Water Management in the Mining Industry, 9-11 June 2010, Santiago. GECAMIN, Santiago [ Links ]
HAGGARD E, SHERIDAN C and HARDING K (2015) Quantification of water usage at a South African platinum processing plant. Water SA 41 (2) 279-286. https://doi.org/10.4314/wsa.v41i2.14 [ Links ]
HOEKSTRA AY (2003) An introduction, virtual water trade. Proceedings of the International Expert Meeting on Virtual Water Trade, Value of Water Research Report Series No.12. UNESCO-IHE, Delft. [ Links ]
MINERALS COUNCIL OF AUSTRALIA (2012) Water accounting framework for the minerals industry. URL: http://www.minerals.org.au/focus/sustainable_development/water_accounting (Accessed 11 October 2015). [ Links ]
MUDD GM (2007) Sustainability reporting in the gold mining industry: the need for continual improvement. SSEE 2007 International Conference on Engineering Sustainability, Perth, November 2007. [ Links ]
OSMAN A, SHERIDAN C, HARDING K, CRUNDWELL FK, DU TOIT A and HINES K (2013) Water accountability and efficiency at a base metals refinery. Water in Mining 2013 Conference Proceedings, AUSIMM, Brisbane [ Links ]
PARRY ML, CANZIANI OF, PALUTIKOF JP, VAN DER LINDEN PJ and HANSON CE (2007) Climate Change 2007: Impacts, Adaptation and Vulnerability. Contribution of Working Group II to the Fourth Assessment Report of the Intergovernmental Panel on Climate Change. Cambridge University Press, Cambridge UK. 433-467. [ Links ]
PEÑA CA and HUIJBREGTS MAJ (2013) The blue water footprint of primary copper production in northern Chile. J. Ind. Ecol. 18 (1) 49-58. [ Links ]
RANCHOD N, SHERIDAN C, PLINT N, SLATTER K and HARDING K (2015) Assessing the blue-water footprint of an open cast platinum mine in South Africa. Water SA 41 (2) 287−293. https://doi.org/10.4314/wsa.v41i2.15 [ Links ]
Received 15 March 2017
Accepted in revised form 12 October 2017
This paper was originally presented at the 2016 Water Institute of Southern Africa (WISA) Biennial Conference, Durban, 15-19 May 2016.
* To whom all correspondence should be addressed. e-mail: craig.sheridan@wits.ac.za

