


Services on Demand
Article
 English (pdf)
 Article in xml format
 Article references
Indicators

Related links
-
 Cited by Google
 -
 Similars in Google
Share

 Permalink
Water SA
On-line version ISSN 1816-7950
Print version ISSN 0378-4738
Water SA vol.43 n.4 Pretoria Oct. 2017
http://dx.doi.org/10.4314/wsa.v43i4.10
TDS load contribution from acid mine drainage to Hartbeespoort Dam, South Africa
PJ Hobbs*
Council for Scientific and Industrial Research (CSIR), PO Box 395, Pretoria, 0001, South Africa
ABSTRACT
Evidence of a mine-water impact on groundwater in the karst aquifer downstream of the actively draining West Rand Goldfield can be traced back to the early 1980s. This is attributed to the dewatering of 'fissure water' encountered during mining, and its discharge into the Bloubank Spruit catchment. Rewatering of the subsurface void following the cessation of mining in the late 1990s culminated in mine-water issuing from various point sources (shafts and boreholes) in 2002. The past 6 hydrological years have periodically produced the greatest volume and worst quality of mine-water discharge, causing widespread concern for the receiving aquatic environment. In this regard, the proximal Cradle of Humankind World Heritage Site attracts a much sharper focus than the distal, regionally important Hartbeespoort Dam. Objectivity requires that an assessment of the mine-water impact on the receiving surface water resources must recognise both the subregional and regional scales. The evaluation presented in this communication examines the temporal mine-water impact at both scales, and interprets the results in terms of the influence exerted by the natural hydrosystem in mitigating adverse impacts on the water resources environment. An analysis of the respective contributions of each of the major drainages to the quantity and quality of water impounded in Hartbeespoort Dam indicates that the median total dissolved solids (TDS) load delivered by the Bloubank Spruit system amounted to ~26 kt/a in the past 6 hydrological years. This is ~12% of the regional median total of ~224 kt/a entering the impoundment in the same period. By comparison, the preceding long-term record dating back 30 years to 1979 reflects a 66% lower median annual contribution of 8.6 kt, representing ~10% of a regional median total of ~89 kt/a. Proportionally, therefore, the recent 6-year period of high volume and poor-quality discharge from the Bloubank Spruit catchment represents only a marginally greater TDS load contribution to Hartbeespoort Dam than that which characterises the previous 30 years.
Keywords: acid mine drainage, allogenic water, autogenic water, Cradle of Humankind, karst springs, karst terrane, TDS load
INTRODUCTION
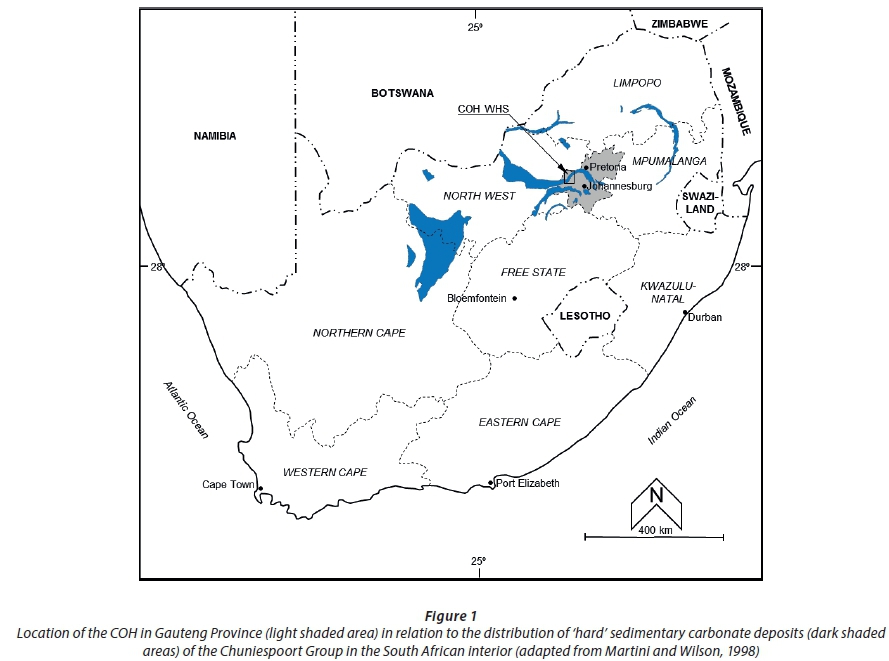
Located on the southeastern boundary of North West Province, South Africa (Fig. 1), Hartbeespoort Dam has regional significance as a supply of water for irrigation, industry and municipal use downstream along the Crocodile River (West). It also supports a thriving residential and tourist industry, and serves a popular recreational purpose. Completed in 1923, it has a full supply capacity (FSC) of ~195 million m3 (Mm3) after the dam wall was raised by 2.4 m to 59 m in the mid-1960s. This is sufficient to impound the observed long-term mean annual runoff (MAR) of ~194 Mm3 (Middleton and Bailey, 2008) from its catchment area of 4 120 km2, and characterises the dam as a 1-MAR (i.e. FSC = MAR) impoundment. It is a warm monomictic water body with mixing in the cold winter season (May-June-July), and has also long experienced eutrophication (Zohary, 1988).
The acid mine drainage (AMD) threat to the dam emanates from the West Rand Goldfield (a.k.a. the Western Basin), and can be traced back to at least the mid-1980s when 'fissure water' encountered in subsurface mining operations was pumped to surface and discharged into the environment. Rewatering of the mine void following the cessation of mining in the late-1990s culminated in mine water discharge on surface (decant as AMD) in late-August 2002. This event triggered a series of interventions and activities driven by concern for the receiving environment, primarily the Cradle of Humankind (COH) (Fig. 1), a UNESCO World Heritage Site (WHS) property.
Initial concern was confounded by a dearth of information and poor understanding of the dynamics that inform the interaction of surface and subsurface waters in the karst environment. Reports in the popular media regarding the negative impacts on the fossil heritage sites, e.g. Béga (2008a; 2008b; 2010; 2013), Seccombe (2008), Groenewald (2010) and Masondo (2010) reflect this situation. This also extended to the scientific literature, e.g. Wells et al. (2009), Durand (2012) and Durand et al. (2010).
In 2009 the Management Authority (MA) of the property commissioned a comprehensive water resources study with a view to better informing this aspect of the environment. The study and a subsequent routine water resources monitoring programme have contributed to a better understanding of the extent and severity of the mine-water threat to the property. This understanding extends to the distal surface water environment represented by the Hartbeespoort Dam.
PHYSICAL ENVIRONMENT
Physiography and climate
The Witwatersrand watershed that forms the continental divide between the Vaal River system to the south (draining westward to the Atlantic Ocean) and the Limpopo River system to the north (draining eastward to the Indian Ocean), also occupies the highest natural elevation of ~1 720 m amsl in the region. Extending to the north of this divide is a diverse landscape that includes undulating terrain with low to moderate relief that follows a SW-NE strike roughly concordant with the main drainages. This terrain is flanked to the southeast by prominent ridges incised at right angles by mainly ephemeral tributaries rising on the divide, and to the northwest by sub-parallel ridges and valleys. The flanking terrain marks a transition in the geology across the landscape, with dolomite sandwiched between older underlying sedimentary strata in the southeast and younger overlying sedimentary rocks in the northwest.
The area of interest falls in the warm temperate summer rainfall region that characterises the typical Highveld climate of the central north-eastern South African interior. Synoptic information sourced from Schulze et al. (1997) indicates a mean annual temperature in the range 16 to 18°C, an A-pan equivalent mean annual potential evaporation in the range of 2 200 to 2 400 mm, and a mean actual evapotranspiration of 1 540 mm/a. The regional mean annual precipitation (MAP) amounts to 696 mm (DWA, 2006). Precipitation reduces to the north, as observed in the 10 to 15% difference between the monthly rainfall on the continental divide and at Sterkfontein Caves, ~13 km to the north, since 2010 (Hobbs, 2015).
Geology
The geology of the wider region is described in numerous texts, e.g., Clendenin (1989), Eriksson and Reczko (1995), Eriksson et al. (2006), Obbes (2001) and Robb and Robb (1998). The study area is dominated by carbonate strata (primarily dolomite) associated with the Malmani Subgroup of the Chuniespoort Group in the Transvaal Supergroup succession of mainly sedimentary strata. The dolomitic strata dip between 15° and 30° to the northwest, disappearing beneath younger Pretoria Group sedimentary rocks (quartzite and shale) roughly coincident with the SW-NE strike of the Skeerpoort River valley. The contact is unconformable. Karst formations underlie ~54% (~27 850 ha) of the COH property. Hamilton-Smith (2006) summarises the significance of karst as having the following:
•Invaluable geological data (particularly in the cave floors)
•Important geomorphic structures and processes
•Characteristic surface and often significant landscapes
•Important surface ecosystems and even more important subterranean ecosystems
•Fossils and cultural heritage (pre-historic, historic and living)
To which must be added:
•Substantial quantities of fresh groundwater, and a capacity to function as a sink for and source of carbon in the global carbon cycle
Hydrology
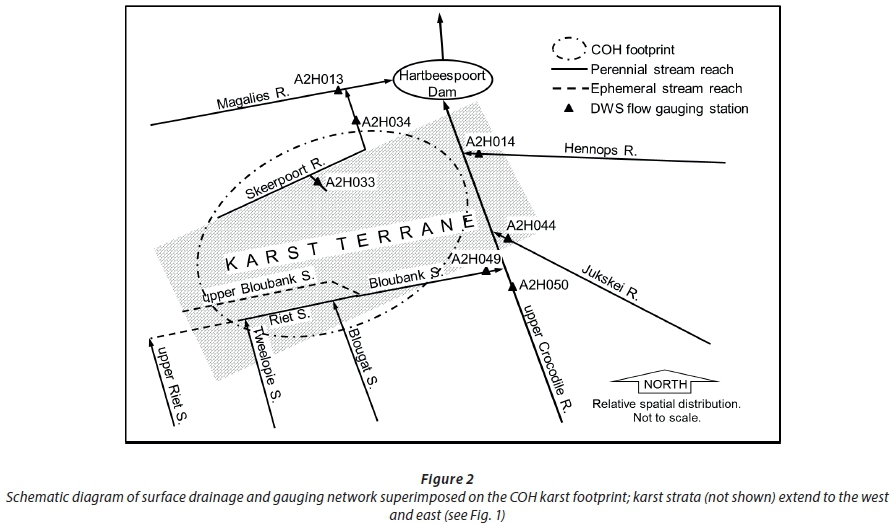
The regional context of the Hartbeespoort Dam catchment comprises major drainages such as the Jukskei and Hennops Rivers draining from the east, the Magalies River draining from the west and the Crocodile River (West) draining from the south (Fig. 2). The subregional context is represented by the upper Crocodile River in the southeast, its tributary the Bloubank Spruit in the southwest, and the nearly pristine Skeerpoort River draining Quaternary Catchment A21G in the northwest (Fig. 2).
The Bloubank Spruit catchment (Quaternary Basin A21D) bears the brunt of poor-quality allogenic water inputs in the form of moderately saline (Hem, 1985) mine-water and bacterially-contaminated municipal wastewater effluent. Mine-water enters the system via the Tweelopie Spruit, and municipal wastewater via the Blougat Spruit, both upper tributaries of the Bloubank Spruit (Fig. 2). These drainages together describe an arcuate clockwise flowpath from southwest to east, traversing ~24 km of dolomitic strata, some 57% (~13.7 km) of which intersects the COH property.
Each of the aforementioned drainages contributes to the quantity and quality of water impounded in Hartbeespoort Dam. An analysis of their respective contributions therefore provides a measure of poor-quality allogenic water impacts. In a subregional context, this is provided by the Department of Water and Sanitation (DWS) flow and quality gauging stations A2H033, A2H034 and A2H049 (Fig. 2). In a regional context, it is obtained through a comparison with the additional similar data provided by Stations A2H013, A2H014, A2H044 and A2H050 (Fig. 2).
An inspection of the discharge data for the different drainages in the period 1973-74 to 2014-15 indicates that the ~195 Mm3 FSC of Hartbeespoort Dam was exceeded in 29 of the 42 hydrological years of mutual record (Fig. 3). The years of deficit, i.e., ∑Q/a < FSC, all precede the 1993-94 hydrological year. The > FSC discharge in the 1986-87 hydrological year ended a prolonged drought period in the central-northeastern interior of the country. The relative constancy of the Bloubank Spruit and Skeerpoort River in the lower runoff years is evident, as is the sustained period of greater runoff commencing in 2005-06. The latter period includes the three highest runoff years (2009-10, 2010-11 and 2013-14) in the 42-year record, shown in Fig. 3.
As shown in Fig. 4, the proportional contribution of the karst basins to discharge in the Hartbeespoort Dam catchment is greater during periods when the aggregate runoff (∑Q/a) is < FSC of the dam. An analysis of the ∑Q < 145 Mm3/a (< FSC ‒ 25%) data returns a median contribution of 16.3%, and that for the ∑Q > 245 Mm3/a (> FSC + 25%) data a median contribution of 11.8%. The ∑Q/a = FSC ± 25% (145 to 245 Mm3) data define a median contribution of 14.1%. Expressed as a percentage of the FSC of the dam for the 36-year truncated long-term record, the two karst-dominated basins A21D and A21G together delivered a median annual contribution of ~16% (~32 Mm3) in the range 8% (2007-08) to 24% (1978-79).
Hydrogeology
The Malmani Subgroup forms a band of dolomitic strata extending from southwest to northeast through the COH property (Fig. 2). Its intersection with the COH represents a fraction of the regional extent of these strata (Fig. 1). In common with many South African karst aquifers (Martini and Kavalieris, 1976), this groundwater system is compartmentalised into what White (1993) refers to as 'karstic groundwater basins'. This characteristic transforms a heterogeneous and anisotropic aquifer of considerable regional extent into smaller segments that facilitate a more meaningful subregional understanding and evaluation of an otherwise complex hydrogeological environment.
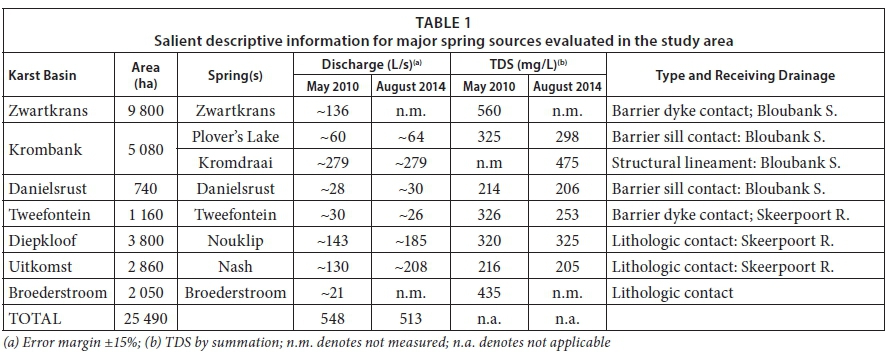
Hobbs et al. (2011) identified 10 compartments in the COH. Seven of the karst basins are drained by springs each producing >20 L/s (Table 1). These basins encompass 25 490 ha, or ~92% of the 27 850 ha footprint of the COH karst terrane. The basins exhibit similar area/discharge relationships that describe a rainfall- derived autogenic recharge of 17 ± 5% of MAP (Hobbs, 2011). Bredenkamp (1988) reports a rainfall-recharge relationship for the 'Transvaal' dolomite that is defined by the equation (R2 = 0.98)
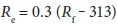
where Re is mean recharge and Rf is annual precipitation (both as mm). Applied to an MAP of 710 mm, the recharge value of 119 mm equates to ~17%.
APPROACH AND METHODOLOGY
Hydrology
Quantification of the surface water resources in regard to quantity and quality was obtained from discharge and chemical data associated with the DWS gauging stations shown in Fig. 2. The contemporary mean monthly discharge and chemistry data were used to calculate monthly TDS load values for each gauging station as a comparative proportional measure of the several (i.e. per gauged basin) and joint inorganic water quality impacts on Hartbeespoort Dam. The shortest of these records, that of Station A2H049, defines the 36-year record of mutual discharge and chemistry data for all of the stations. This dates back to the 1979-80 hydrological year.
The periods of analysis used for the comparison are defined as (a) the full record from 1979-80 to 2014-15, (b) the long-term record ending with the 2008-09 hydrological year, and (c) the recent record spanning the 2009-10 to 2014-15 hydrological years. These periods are also later referred to as the whole record, the truncated long-term record and the recent record, respectively. The rationale for the choice of record periods is evident from Fig. 5, which shows that the past 6 hydrological years experienced a median TDS load of > 1 500 t/month, more than double the median value of ~750 t/month of the preceding record period. This reflects a greater impact from mine-water discharge rising in the Western Basin since the 2008-09 hydrological year.
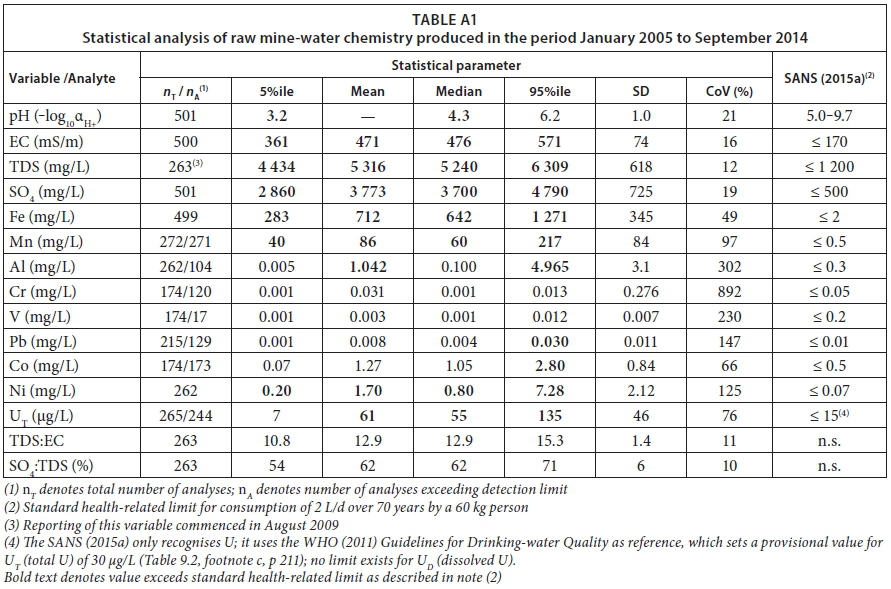
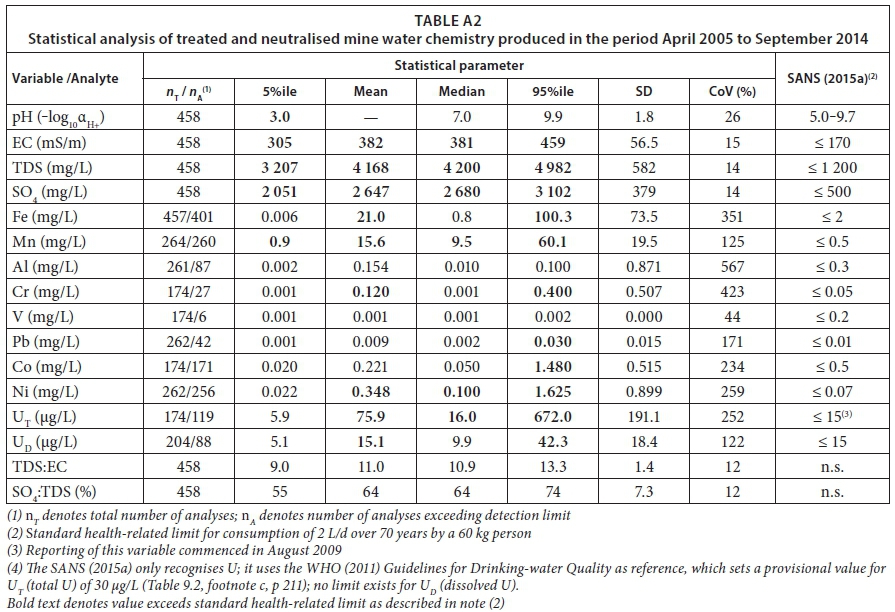
The increase in mine-water discharge observed in the 2009-10 hydrological year commenced in the week of 1 February 2010, and followed high rainfall in the prior summer months. Figure 6 shows that October and November 2009 each experienced ~75 mm, and that each of December 2009 and January 2010 experienced > 150 mm. These circumstances continued in the following hydrological year, abated in the 2011-12 and 2012-13 periods, and spiked again in 2013-14. The severity of the mine-water impact in the recent period was exacerbated by the fact that for some of the time the greater proportion of this water was untreated and, as shown in Fig. 7, acidic with a pH of ~3. Further, the disruption of mine-water treatment as a result of load shedding introduced by Eskom in January 2008 is also evident in Fig. 7, and served to aggravate the situation. The raw (untreated) mine-water, with a median TDS concentration of 5 300 mg/L (Appendix 1, Table A1), has a greater impact than that of treated and neutralised mine-water with a median TDS content of 4 200 mg/L (Appendix 1, Table A2).
The greater proportion of raw mine-water to treated and neutralised mine-water leaving the mine area is explained by the ~24 ML/d capacity (in 2012) of the high-density sludge (HDS) mine-water treatment plant. This capacity was unable to cope with more than twice this volume of AMD issuing from the flooded mine void. An increase in treatment capacity to ~34 ML/d by mid-2013 (Hobbs, 2015) provided respite mainly because of a decrease in raw mine-water discharge to more manageable volumes.
Hydrogeology
Quantification of the groundwater resources in regard to discharge was accomplished by stream gauging measurements, also referred to as synoptic discharge measurements (SDMs), immediately downstream of each of the enumerated springs listed in Table 1. An OTT C20 current meter and Z400 signal counter set with impellor #1-239627 (125 mm diameter, 0.25 pitch) mounted on a 20 mm diameter rod was used for these measurements. Stream cross-sections that best presented a 'clean' (uniform and unobstructed) profile were chosen. An error margin of ±15% was considered acceptable for each SDM.
The discharge of the Nouklip Spring is gauged continuously and instantaneously at Station A2H033 (Fig. 2). Aggregated as monthly values, the record from January 1996 to September 2015, comprising 221 values, reflects a long-term mean and median discharge of ~184 L/s (~5.8 Mm3/a) and ~172 L/s (~5.4 Mm3/a), respectively. These values compare favourably with the SDM values reported in Table 1. Encouragingly, the SDM values differ from the real-time A2H033 values by +1% in May 2014 (173 L/s vs. 171 L/s) and ‒9% in August 2014 (211 L/s vs. 230 L/s), i.e., within the ±15% error margin. The long-term mean and median discharges represent the baseflow of the receiving stream.
Further analysis of the A2H033 flow record reveals a minimum discharge of 53 L/s, a 5%ile value of 129 L/s, a 95%ile value of 275 L/s and a maximum value of 333 L/s. Together with a standard deviation of 48 L/s and a coefficient of variation of 26%, these statistics reflect the relatively constant flows that characterise the Nouklip Spring. This is characteristic of springs draining the late Archaean and early Proterozoic carbonate strata of the South African interior. Martini (2006) refers to 'very regular discharges at resurgences', which is in contrast to the 'flashy' nature of springs that drain the telogenetic and much younger European karst formations (Florea and Vacher, 2006). This characteristic is attributed to the crucial hydrologic functions and roles played by the epikarst and vadose zone also in the regional karst system of the COH. In this regard, Klimchouk (2004) recognises the retardation of throughflow and mixing of recharge in its often lengthy and tortuous pathway to the aquifer as one of the principal factors.
Springwater quality was determined from laboratory chemical analyses, and the TDS values (Table 1) again used to calculate an 'instantaneous' TDS load associated with each source. The hydrochemical record at Station A2H033 from March 1996 to June 2015 reveals a long-term mean and median TDS concentration of 321 mg/L and 323 mg/L, respectively. These are similar to the synoptic values reported for the Nouklip Spring in Table 1. Further statistics for the 51 analyses (an average of 1 analysis every 4.5 months) reveal a minimum TDS value of 272 mg/L, a 5%ile value of 309 mg/L, a 95%ile value of 333 mg/L and a maximum value of 345 mg/L. Together with a standard deviation of 10 mg/L and a coefficient of variation of 3%, the Nouklip Spring is shown to produce water with a consistent TDS concentration. In keeping with their relative constancy of discharge, it is postulated that the springwaters of the Malmani Subgroup dolomites (at least in the study area) are also characterised by consistent TDS concentrations. Together, these circumstances imply comparatively consistent individual TDS loads. As might be expected, Hobbs (2015) reports that these springwaters individually also exhibit consistent inorganic chemical compositions.
RESULTS
Hydrology
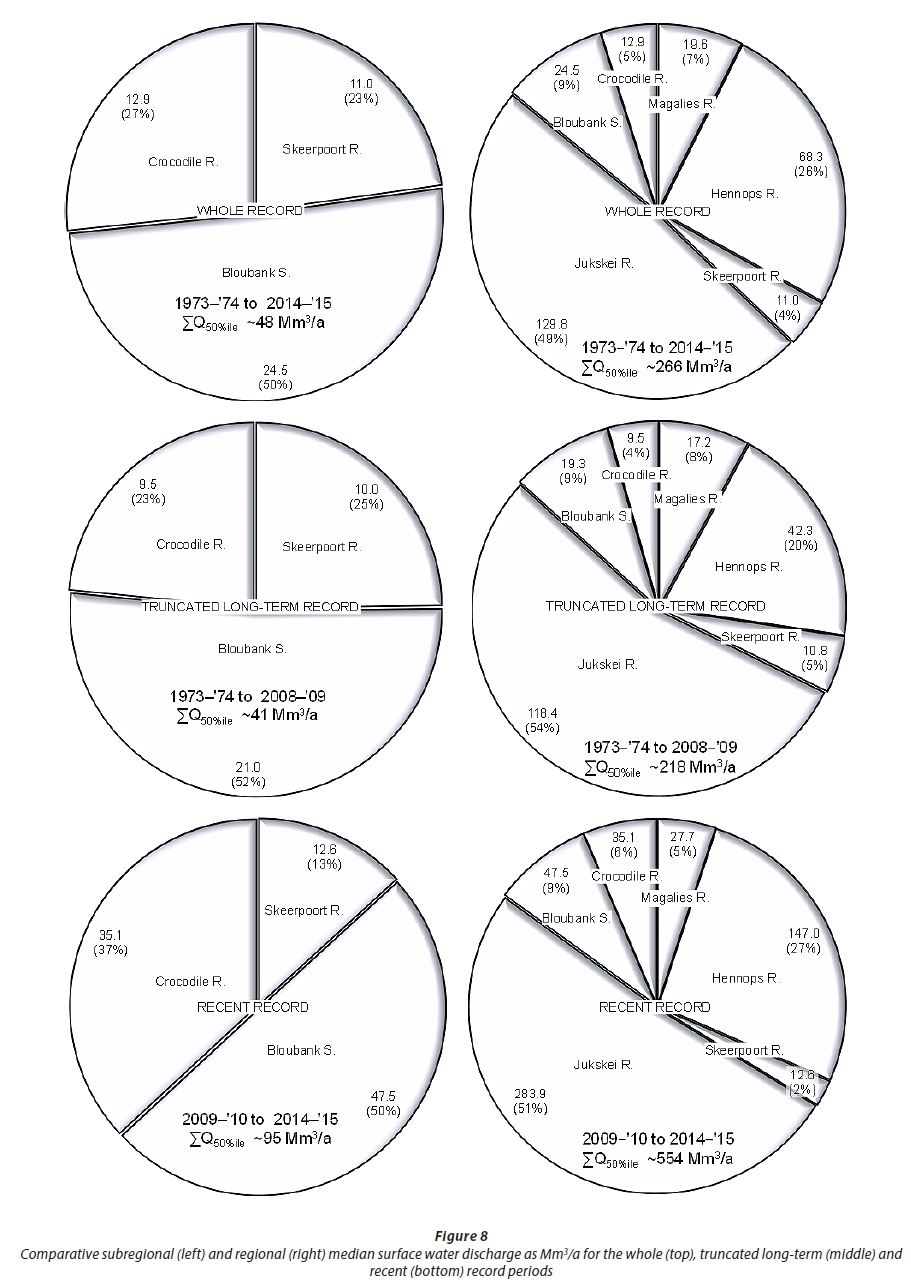
Analysis of the subregional surface water discharge associated with Stations A2H034 (Skeerpoort River), A2H049 (Bloubank Spruit) and A2H050 (upper Crocodile River) in the three periods of assessment returns the results illustrated in Fig. 8. The long-term record period commences with the 1973-74 hydrological year. The Bloubank Spruit contribution amounts to ~51% in all three assessment periods, despite the considerably greater median aggregate discharge of ~95 Mm3/a delivered in the recent period compared to the ~48 Mm3/a of the whole record, and the ~41 Mm3/a of the truncated long-term record. The reduction in the proportional contribution of the Skeerpoort River in the recent period compared to the long-term reflects the greater runoff from the urbanised headwaters of the Crocodile River compared to the nearly pristine natural condition of the Skeerpoort River catchment.
An analysis of the regional surface water discharge in the three assessment periods is also illustrated in Fig. 8. The results again reveal the considerably greater median discharge of ~554 Mm3/a delivered in the recent period, compared to the ~266 Mm3/a of the whole record and ~218 Mm3/a of the truncated long-term record. As for the subregional analysis described above, the proportional contribution (9%) of the Bloubank Spruit is similar in all three assessment periods. This observation applies to all of the regional drainages, dominated by the Jukskei and Hennops Rivers.
The analysis of the surface discharge characteristics indicates that the substantial mine-water discharges in the past 6 years, i.e., since the periodic uncontrolled escape of raw mine-water to the environment in early-2010, manifest no discernible difference in the proportional discharge contribution of the Bloubank Spruit system in either a subregional or a regional context.
Hydrogeology
The aggregate discharge of the springs contributing to flow in the Bloubank Spruit and Skeerpoort River (Table 1) in May 2010 amounted to ~500 L/s (~15.8 Mm3/a) and ~300 L/s (~9.5 Mm3/a), respectively (Hobbs et al., 2011). Individually, these discharges represent ~8% and ~5% of the ~195 Mm3 FSC of Hartbeespoort Dam, amounting to a joint contribution of 13% (25.3 Mm3/a). A similar assessment of the August 2014 data (Table 1) excluding the Zwartkrans Spring, returns a similar combined result, i.e., 25 Mm3/a or 12.8% of FSC. Assigning a similar flow to the Zwartkrans Spring as in May 2010 raises the aggregate August 2014 contribution to 928 L/s (29.3 Mm3/a) or ~15% of FSC.
Excluded from these assessments are the contribution from instream groundwater resurgences, conservatively calculated at ~135 L/s (~4.3 Mm3/a) in the Bloubank Spruit system. The aggregate contribution of karst groundwater to Hartbeespoort Dam is therefore more likely in the range ~15 to 17% of FSC. The TDS concentrations of the springwater (Table 1) indicate that the quality of this water is good to excellent. It can therefore reasonably be expected to mitigate the impact of the poorer quality allogenic water in the Bloubank Spruit system, also to the benefit of the water quality in the dam.
A possible springwater contribution to the upper Crocodile River discharge was not considered. Although the quartzitic strata of the Witwatersrand Supergroup that form the continental divide are known to support numerous springs, their individual discharges are typically small compared to those draining the Malmani Subgroup dolomitic strata. Further, their discharge is more variable as a result of a quicker response to recharge from rainfall and the lower storativity that characterises the mainly fractured rock aquifer. These springs commonly reduce to mere seeps during the dry winter season, and often cease flowing during periods of drought.
OBSERVATIONS
Surface water TDS load
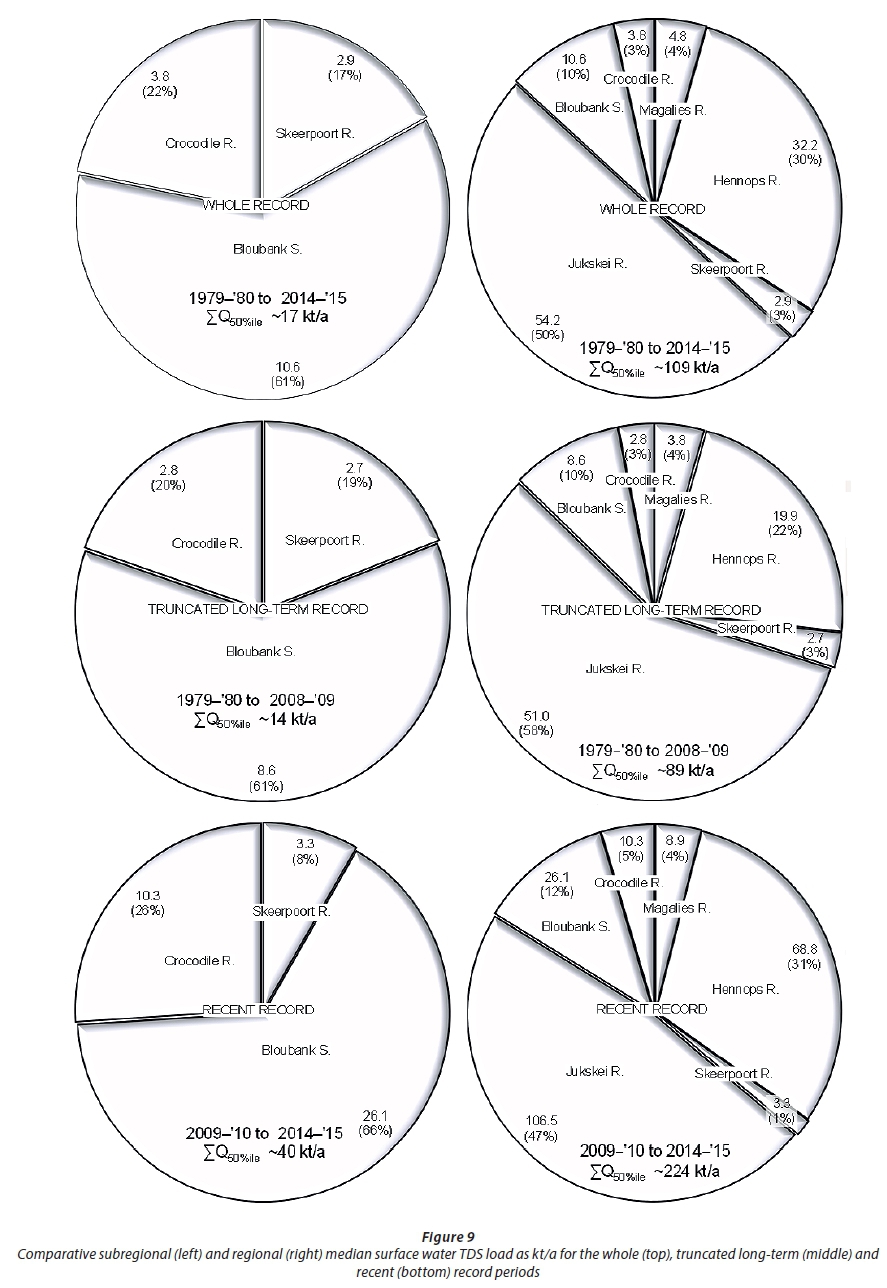
An analysis of the subregional TDS loads reveals an aggregate recent median value of ~40 kt/a, that is some 2.5 times greater than the respective whole and truncated long-term period values of ~17 and ~14 kt/a (Fig. 9). Further, it can be noted that the proportional load contributed by the Bloubank Spruit in each assessment period is similar, increasing from the whole and truncated long-term period values of 61%, to 66% in the recent period. This is despite the 2.6-fold increase, from ~10 to ~26 kt/a, in actual load delivered by this basin. The percentage increases represented by the recent TDS loads compared to the whole and truncated long-term period loads is ~172% for the Bloubank Spruit, ~203% for the Crocodile River and ~18% for the Skeerpoort River. The TDS loads delivered by the Skeerpoort River show the least variability, increasing from ~2.8 kt/a in the longer-term periods to ~3.3 kt/a in the recent period. Nevertheless, the recent proportional contribution of this catchment is reduced to 8% of the subregional total compared to 18% of the longer-term periods. This is attributed to the low TDS load carried in the springwaters that sustain this drainage. Similarly, it is postulated that springwater inputs substantially mitigated the mine-water impact on the recent Bloubank Spruit discharge quality.
The mitigation evident in the Bloubank Spruit system TDS load in a subregional context is less evident in a regional context. This is reflected in the 12% proportional TDS load contribution of this catchment in the recent period compared to the longer-term contributions of 10% (Fig. 9). It is postulated that the moderating influence of the karst springwater input at a regional scale is masked by the substantially greater loads contributed by larger drainages than the Bloubank Spruit. Whereas the proportional loads of the Bloubank Spruit and Crocodile River increased from 10 to 12% and 3 to 5%, respectively (Fig. 9), that of the Skeerpoort River decreased from 3 to 1%. By comparison, the combined TDS loads delivered by the Jukskei and Hennops Rivers remained similar at ~80% in all three assessment periods.
Groundwater TDS Load
The TDS load contributed by groundwater to the Bloubank Spruit and Skeerpoort River via spring discharges is considered comparatively uniform for reasons already discussed. Although both spring discharges and springwater chemistry varies from spring to spring, that delivered by each spring is generally quite consistent.
The springs discharging into the Bloubank Spruit deliver an aggregate and relatively constant TDS load of ~7.8 kt/a. This is similar to the 8.6 kt/a delivered in the truncated long-term record (Fig. 9), and is attributed to the mitigating influence of the better quality springwater inputs rising in this catchment. The ~235% greater load of the recent record (26.1 vs. 8.6 kt/a) reflects a mine-water impact that is only moderately negated by the springwater inputs.
Similarly, the springs discharging into the Skeerpoort River deliver a combined and comparatively regular TDS load of ~3.0 kt/a. This is in excellent agreement with the 2.9 and 2.7 kt/a values that characterise the longer-term assessment periods, and the 3.3 kt/a of the recent record (Fig. 9). This is unsurprising for a primarily groundwater-driven drainage.
CONCLUSIONS
An analysis of the discharge and water chemistry records associated with the main drainages in the Hartbeespoort Dam catchment for three periods of record provides a measure of the temporal mine-water impact in both a subregional and a regional context. The derivation of a TDS load for each record period and spatial scale reveals a slight but noticeable recent proportional mine-water impact at a subregional scale. This impact is less evident at a regional scale. The muted impact is attributed in part to the contribution of good to excellent quality dolomitic groundwater delivered by high-yielding (> 20 L/s) karst springs. This contribution naturally serves to reduce a mine-water impact in the subregional context of the Bloubank Spruit catchment. Its moderating influence at a regional scale is masked by the greater loads delivered by substantially larger drainages than the Bloubank Spruit.
In conclusion, moderately saline poor-quality mine-water actively draining from the Western Basin exhibits a negligible impact on the TDS load reporting to Hartbeespoort Dam, irrespective of the volume of mine-water discharge. A similar future analysis that extends to an evaluation of the TDS load leaving the dam will prove insightful, as will an assessment of sulfate and metal loads (e.g. iron and manganese) entering and leaving the dam.
ACKNOWLEDGEMENTS
The material presented in this communication builds on a presentation delivered at the 14th Biennial Groundwater Conference held from 21 to 23 September 2015 in Muldersdrift, Gauteng Province, South Africa. The organisers of this conference, the Ground Water Division of the Geological Society of South Africa, are thanked for permission to publish much of the Hobbs and Mills (2015) material in this updated communication. The Department of Water and Sanitation staff Marica Erasmus and Busisiwe Sekgomane at Resource Quality Services of this authority are thanked for their prompt provision of discharge and hydrochemical data extracted from the DWS databases. The Management Authority of the COH is recognised for its commitment to evaluating and understanding the water resources of the WHS environment, and for permission to publish this material. Finally, the helpful and constructive comments provided by two anonymous referees is gratefully acknowledged for improving the manuscript.
REFERENCES
BÉGA S (2008a) Pollution threatens Cradle of Humankind. URL: http://www.environment.co.za/topic.asp?TOPIC_ID=2124 (Accessed 6 January 2010). [ Links ]
BÉGA S (2008b) Cradle's heritage status in danger. URL: http://www.iol.co.za/index.php?set_id=1&click_id=13&art_id=vn20081115091504526C425147 (Accessed 6 January 2010). [ Links ]
BÉGA S (2010) Is a river of acid threatening fossil treasures? Study targets mine water at Cradle of Humankind. Saturday Star 17 April 2010. [ Links ]
BÉGA S (2013) Water taints life in Cradle: Toxic mine water chokes country estate. Saturday Star 28 September 2013. [ Links ]
BREDENKAMP DB (1988) Recharge and storativity estimates for dolomite aquifers. In: Proceedings of the workshop on dolomitic ground water of the PWV area. Ground Water Division, Pretoria, 145 pp. [ Links ]
CLENDENIN CW (1989) Tectonic influence on the evolution of the early Proterozoic Transvaal Sea, southern Africa. PhD thesis (unpublished), University of the Witwatersrand, Johannesburg. [ Links ]
DURAND JF (2012) The impact of gold mining on the Witwatersrand on the rivers and karst system of Gauteng and North West Province, South Africa. J. Afr. Earth Sci. 68 24-43. https://doi.org/10.1016/j.jafrearsci.2012.03.013 [ Links ]
DURAND JF, MEEUVIS J and FOURIE M (2010) The threat of mine effluent to the UNESCO status of the Cradle of Humankind World Heritage Site. J. Transdisc. Res. South. Afr. 6 (1) 73-92. https://doi.org/10.4102/td.v6i1.125 [ Links ]
DWA (Department of Water Affairs, South Africa) (2006) Groundwater Resource Assessment 2. Department of Water Affairs, Pretoria. [ Links ]
ERIKSSON PG and RECZKO BFF (1995) The sedimentary and tectonic setting of the Transvaal Supergroup floor rocks to the Bushveld Complex. J. Afr. Earth Sci. 21 487-504. https://doi.org/10.1016/0899-5362(95)00111-5 [ Links ]
ERIKSSON PG, ALTERMANN W and HARTZER FJ (2006) The Transvaal Supergroup and its precursors. In: Johnson MR, Anhaeusser CR and Thomas RJ (eds) The Geology of South Africa. GSSA/CGS, Johannesburg/Pretoria. 691 pp. 237-260. [ Links ]
FLOREA LJ and VACHER HL (2006) Springflow hydrographs: Eogenetic vs. telogenetic karst. Ground Water 44 (3) 352-361. https://doi.org/10.1111/j.1745-6584.2005.00158.x [ Links ]
GROENEWALD Y (2010) Acid mine water pollution a 'ticking time bomb'. Mail & Guardian 8 April 2010. [ Links ]
HAMILTON-SMITH E (2006) Thinking about karst and world heritage. Helictite 39 (2) 51-54. [ Links ]
HEM JD (1985) Study and Interpretation of the Chemical Characteristics of Natural Water (3rd edn). Water-supply Paper 2254, USGS, Alexandria, VA. 263 pp. [ Links ]
HOBBS PJ, BUTLER M, COETZEE H, JAMISON A, LEYLAND R and VENTER J (2011) Situation assessment of the surface water and groundwater resource environments in the Cradle of Humankind World Heritage Site. CSIR, Pretoria. 424 pp. URL: http://www.dwaf.gov.za/ghreport/ (as report 2.2(2657)). [ Links ]
HOBBS PJ (2015) Surface water and groundwater resources monitoring, Cradle of Humankind World Heritage Site, Gauteng Province: Water resources status report for the period April to September 2015. CSIR, Pretoria. 47 pp. URL: http://www.dwaf.gov.za/ghreport/ (as report 2.2(3296)). [ Links ]
HOBBS PJ and MILLS PJ (2015) Where AMD meets karst, and humans theorise (speculate?) whilst nature acts. In: Proceedings of the 14th Biennial Ground Water Division Conference and Exhibition - From Theory to Action, 21-23 September 2015, Muldersdrift. [ Links ]
KLIMCHOUK A (2004) Towards defining, delimiting and classifying epikarst: Its origin, processes and variants of geomorphic evolution. Speleogenesis and Evolution of Karst Aquifers 2 (1) 1-13. URL: http://www.speleogenesis.info/directory/karstbase/pdf/seka_pdf4501.pdf [ Links ]
MARTINI JEJ (2006) Karst and caves. In: Johnson MR, Anhaeusser CR and Thomas RJ (eds.) The Geology of South Africa. GSSA/CGS, Johannesburg/Pretoria. 691 pp. 661-668. [ Links ]
MARTINI J and KAVALIERIS I (1976) The karst of the Transvaal (South Africa). Int. J. Speleol. 8 (3) 229-251. https://doi.org/10.5038/1827-806X.8.3.1 [ Links ]
MARTINI JEJ and WILSON MGC (1998) Limestone and dolomite. In: Wilson MGC and Anhaeusser CR (eds.) The Mineral Resources of South Africa. Handbook 16. CGS, Pretoria. 740 pp. 433-440. [ Links ]
MASONDO M (2010) R7m to clean up toxic water. The Times 19 March 2010. [ Links ]
MIDDLETON BJ and BAILEY AK (2008) Water Resources of South Africa, 2005 Study (WR 2005). Book of Maps. Vers. 1. WRC Report No. TT 382/08. Water Research Commission, Pretoria. 85 pp. [ Links ]
OBBES AM (2001) The structure, stratigraphy and sedimentology of the Black Reef-Malmani-Rooihoogte succession of the Transvaal Supergroup southwest of Pretoria. CGS Bulletin 127. CGS, Pretoria. 89 pp. [ Links ]
ROBB LJ and ROBB VM (1998) Gold in the Witwatersrand basin. 294-349. In: Wilson MGC and Anhaeusser CR (eds.) The Mineral Resources of South Africa. Handbook 16. CGS, Pretoria. 740 pp. [ Links ]
SANS (2015a) South African National Standard 241-1. Drinking water. Part 1: Microbiological, physical, aesthetic and chemical determinands. Edition 2. Standards South Africa, Pretoria. 14 pp. [ Links ]
SANS (2015b) South African National Standard 241-1. Drinking water. Part 2: Application of SANS 241-1. Edition 2. Standards South Africa, Pretoria. 14 pp. [ Links ]
SCHULZE RE, MAHARAJ M, LYNCH SD, HOWE BJ and MELVIL-THOMSON B (1997) South African atlas of agrohydrology and -climatology. WRC Report No. TT 82/96. Water Research Commission, Pretoria. 276 pp. [ Links ]
SECCOMBE A (2008) Mine water calamity. Mining mx. 5 November 2008. URL: http://www.miningmx.com/special_reports/green-book/2008/886408.htm [ Links ]
WELLS JD, VAN MEURS LH, RABIE GF, MOIR F and RUSSELL J (2009) Chapter 15: Terrestrial Minerals. 513-578. In: Strydom HA and King ND (eds) Environmental Management in South Africa (2nd edn). Juta Law, Cape Town. 1142 pp. [ Links ]
WHITE WB (1993) Analysis of karst aquifers. In: Alley WM (ed.) Regional Ground-Water Quality. Van Nostrand Reinhold, New York. 634 pp. 471-489. [ Links ]
ZOHARY T, JARVIS AC, CHUTTER FM, ASHTON PJ and ROBARTS RD (1988) The Hartbeespoort Dam Ecosystem Programme 1980-1988. CSIR, Pretoria. 12 pp. [ Links ]
Received 21 September 2016
Accepted in revised form 9 October 2017
* To whom all correspondence should be addressed. e-mail: phobbs@csir.co.za

