Services on Demand
Article
Indicators
Related links
-
 Cited by Google
 -
 Similars in Google
Share
Water SA
On-line version ISSN 1816-7950
Print version ISSN 0378-4738
Water SA vol.43 n.4 Pretoria Oct. 2017
http://dx.doi.org/10.4314/wsa.v43i4.09
Impact of water hardness on energy consumption of geyser heating elements
Lerato Lethea*
Demand Management Centre of Expertise, Eskom Research, Testing, and Development, Private Bag X40175, Cleveland, 2022, South Africa
ABSTRACT
South Africa is an electricity-stressed country with a growing energy demand. Globally, hot water appliances are major consumers of electricity. Poor water quality for domestic purposes is a concern that may affect the efficiency of hot water appliances. Therefore, the Eskom Research, Testing, and Development Business Unit embarked on a study to examine total water hardness as a chemical parameter that may impact the power consumption of electrical geyser heating elements. An accelerated scaling method was developed to lime-scale the geyser heating elements for about 2 to 3 months. In addition, the geyser heating elements were tested with and without electronic descaler technology. The results showed that the accelerated scaling method developed for shortening the scaling time of geyser heating elements was successful. Furthermore, the results proved that scale formation of 1.5kW and 3kW geyser heating elements due to high total water hardness increased the power consumption by approximately 4% to 12%. This paper also presents energy-efficient electronic descaler technology as an alternative treatment of scaling for geyser heating elements.
Keywords: electronic descaler technology, energy consumption, geyser heating element, scaling, total water hardness
INTRODUCTION
Worldwide, population growth is continuously increasing energy demand. The main consumer of electrical energy globally is water heating (Ibrahim et al., 2014). The total domestic energy consumption percentage of water heating for the USA, Europe, Canada, Australia, Mexico, China, and South Africa is 11%, 14%, 22%, 25%, 29%, 27%, and 32%, respectively (Ibrahim et al., 2014). South Africa, in particular, was electricity stressed in the past decade, and this led to the introduction of load shedding by Eskom. The impact of water quality on hot water technologies has been studied since the 1940s (Stickford et al., 1984) and includes work by Arunchala (2011), Dobersek and Goricanec (2007) and Brazeau and Edwards (2011). In particular, the effect of scaling on energy efficiency has been researched by Widder and Baechler (2013).
The power industry is exploring treatment technologies that reduce scale deposit formation caused by high mineral content in water (Dobersek and Goricanec, 2007). Dobersek and Goricanec (2014) explain that scale deposits in hard water are due to the decrease in solubility of calcium carbonate with increasing temperature. Subsequently, energy is lost because of the precipitated scale with very low thermal conductivity on the heat-transfer surfaces (Dobersek and Goricanec, 2014). Dobersek and Goricanec (2014) showed that energy consumption of electrical heaters increased by more than 15% as a result of scale deposits of a 1 mm layer. The focus of the research presented in this paper was to study the impact of total water hardness on the power consumption of South African residential geyser heating elements with a developed accelerated scaling method.
Background
Geysers are pressurised vessels used to heat and supply hot water for domestic and industrial purposes. A thermostat is a component of a geyser used to control the temperature of the water being heated. The heating element turns on when the temperature of the water drops below the set point of the thermostat and will turn off to prevent the water from overheating. Residential geysers are usually equipped with a 1.5, 2, or 3 kW heating element in a 150 or 200 L water tank (Catherine et al., 2012). The materials of construction for heating elements include steel, stainless steel, aluminium, copper, fluoropolymer, brass, iron, nickel alloy, and polyimide (Gouws and Le Roux, 2012). Arunchala (2011) indicated that the performance of a geyser may deteriorate within 5 to 12 years of its installation. Performance deterioration factors may include the manufacture of the geyser, operating conditions, water quality, and inadequate maintenance (Arunchala, 2011).
Total water hardness is expressed as the concentration of calcium carbonate that is equivalent to the total concentration of all multivalent ions in a water sample. Ca and Mg ions dominate metal ion concentrations and are the main contributors to water hardness (Skoog et al., 2014). Additional contributors include Al, Zn, Ba, Fe, Sr, and Mn (Sengupta, 2013). Water hardness salt types are provided in Table 1 (Sengupta, 2013). Carbonate hardness is formed by the carbonate, bicarbonate, and hydroxides anions that result in alkalinity (Sengupta, 2013). Alkalinity is defined as the capacity to neutralise acid (De Zuane, 1997). Hydroxide minerals have the ability to neutralise acids, and hence are grouped in the carbonate hardness class (Sengupta, 2013, Table 1). Carbonate hardness can be removed simply by boiling the water (Sengupta, 2013). In comparison, non-carbonate hardness is formed by anions such as chlorides and sulphates (Widder and Baechler, 2013) and the scale deposits cannot be broken down by boiling the water (Sengupta, 2013).
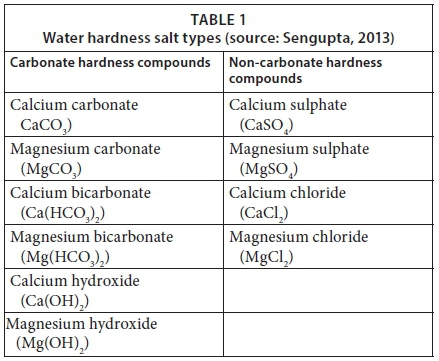
Total water hardness determination is important because precipitation of carbonate minerals may occur on heating the water, ultimately clogging pipes and boilers (Skoog et al., 2014). Scale formation result from the bicarbonate ion breakdown, as shown in Eq. 1 (Antony et al., 2011). High pH and alkaline conditions also promote precipitation of magnesium hydroxide, as shown in Eq. 2 (Hasson et al., 2010). The mineral content of water can be further classified as soft, moderately hard, hard, and very hard (Sengupta, 2013, Table 2). The sources of water hardness include geological minerals such as limestone and dolomite (Sengupta, 2013).


Numerous water indices are used to predict the scaling and corrosion occurrence resulting from the water. These indices include the Langelier saturation index (LSI), Ryznar stability index (RSI), Puckorius scaling index (PSI), Larson-Skold index (LS), and aggressive index (AI) (Shams et al., 2012). The LSI is the most widely used indicator of water scale potential, calculated using pH as the main variable (Saifelnasr et al., 2013). The LSI calculation takes into consideration the alkalinity (mg/L as CaCO3), the calcium hardness (mg/L as CaCO3), the total dissolved solids (mg/L TDS), actual pH, and temperature (°C) of water. The equations of the LSI, RSI, and PSI and the resulting water condition are given in Table 3, where pHs represents the saturation pH. The PSI is obtained by calculating the equilibrium pH (pHeq) using Eq. 3 (Saifelnasr et al., 2013).

Treatment solutions that reduce water hardness scaling include chemical processes, electrochemical processes, and nanofiltration. Ras and Ghizellaoui (2012) applied potassium hydrogen phosphate (K2HPO4) and potassium phosphate (K3PO4) scale inhibitors to reduce calcium carbonate (CaCO3) scale formation in Hamma water. These scale inhibitors blocked the growth sites of CaCO3 forming scale deposits (Ras and Ghizellaoui, 2012). In this study, the objectives were, therefore: (i) to develop a scaling acceleration method to shorten the test times for scaling the geyser heating element, (ii) to investigate the impact of scaling deposits due to total water hardness on energy consumption of geyser heating elements, and (iii) to test electronic descaler technology with the accelerated scaling method of geyser heating elements.
MATERIALS AND METHODS
Straight-shaped geyser heating elements of 1.5 and 2kW with copper, coated with nickel, were the selected samples for this research. Twenty-litre high-density polyethylene (HDPE) heater buckets were constructed for testing of the geyser heating elements. Visual examination of all water buckets for geyser heating elements was done before testing. All experiments were performed at the H2O Science Laboratory under the Demand Management Centre of Expertise in the Eskom Research, Testing, and Development Business Unit. The laboratory room temperature was maintained between 19°C and 21°C. Close-view pictures of the geyser heating elements tested are shown in Fig. 1.
Water hardness meters and indicators
An EC-1385 meter tester was used to test the laboratory water before preparation of hard-water salt solutions. The EC-1385 meter is a three-in-one parameter water quality tester that measures the electrical conductivity (EC), total dissolved solids (TDS), and the conductivity factor. Natural water usually contains dissolved ion salts, which provide a pathway for the flow of electrons through the solution, called electrical conductivity (Gopalan et al., 2008). The conductivity factor of dissolved salts in solution is a measure of the activity of the charged particles related to their concentration by a factor (Skoog et al., 2014). The term 'total dissolved solids' (TDS) refers to the wide variety of inorganic salts and organic matter that are dissolved in the water (Gopalan et al., 2008). A water hardness test strip was also used for water hardness testing of the tap water at the laboratory, reported asmg/L CaCO3. This water hardness test involved the immersion of a test strip with 4 small square coloured fields in a 100 mL water sample. The test strip was immersed in the tap water sample for approximately a minute, until the colour chart results appeared. The results of a water hardness test strip depend on the concentration of the total water hardness of the water sample.
Preparation of salt solutions
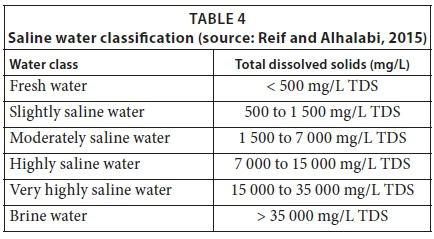
The aim of developing the scaling acceleration method was to prepare salt solutions that could be classified as moderately saline water with a TDS between 1500 and 7000mg/L, or highly saline water with a TDS between 7000 and 15000mg/L. The classification of saline water based on TDS (mg/L) is given in Table 4. The four salt types that were used to prepare the salt solution were calcium carbonate (CaCO3), calcium sulphate (CaSO4·2H2O), magnesium chloride hexahydrate (MgCl2·6H2O), and magnesium sulphate (MgSO4·7H2O). These salts contribute to water hardness, resulting in scale formation, as shown in Table 1. This test method is laboratory developed. About 35g of each salt was required to achieve a high hardness of water, made up to 20L of tap water, to prepare the first salt solution. In order to prepare Solution 1, small quantities of salts of about 10g were weighed and dissolved in a 1000mL beaker with tap water and stirred for at least 5min on a magnetic stirrer. These concentrated solutions were then mixed together and diluted to 20L. Adjustments of pH of prepared solutions were done using sodium hydroxide (NaOH) pellets. Approximately 5g of NaOH pellets were used to obtain a pH range between 8 and 9. The second salt solution was prepared by dissolving approximately 105g of each salt using a similar approach to Solution 1, also made up to 20 L.
Geyser heating element experiments
Water analysis
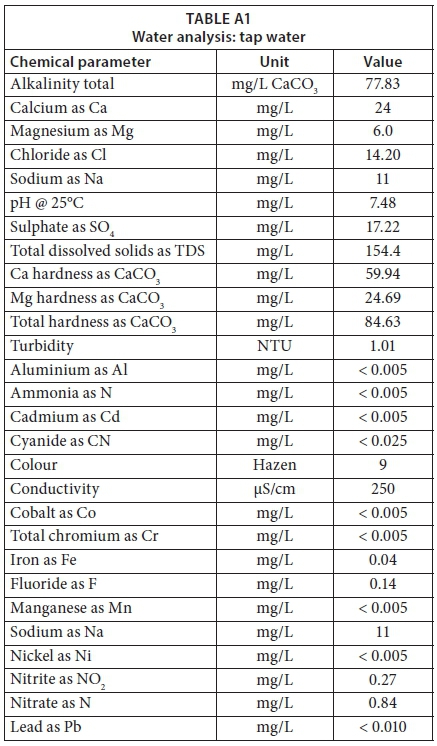
The tap water sample from the H2O Science Laboratory was sent to the Central Water Laboratory in the Eskom Research, Testing, and Development Business Unit for analysis to better understand the chemistry of the water used for geyser heating element experiments (Appendix A). In addition, the water samples of the two prepared salt solutions were tested at the same laboratory.
Scaling acceleration of heating element experiments
The electrical geyser heating elements were exposed to prepared salt solutions in 20 L buckets. The geyser heating element thermostats were set to 70°C instead of the normal geyser heating element temperature of 50°C or 65°C. The increased temperature accelerated the scaling process, as the higher temperature caused calcium carbonate to precipitate out of the solution and produce scale in the water heaters (Widder and Baechler, 2013). The accelerated scaling experiments ran for at least 2 to 3 months. Scale deposit formation of the geyser heating elements being tested and inspected was photographed before testing and during the 2 to 3 months of the scaling period. Accelerated scaling method experiments, indicating the type of heating element and experimental conditions, are shown in Table 5.
Power consumption experiments
The energy consumption was measured for both new and trial geyser heating elements to monitor the power used during the experiments. Wireless electricity monitors were used in these experiments, mainly to monitor and display the power used by the geyser heating elements. In addition, these monitors were used to provide evidence of the overall time used for the scaling acceleration of each geyser heating element. Wireless electricity monitors were used as a troubleshooting mechanism to indicate whether the heating elements were, in fact, drawing power and were functional. These monitors showed the amount of power each geyser heating element consumed while running. Portable remote monitoring systems (PRMS) were also used to record the power consumption and temperature of the geyser heating elements while testing them. These PRMS were calibrated before being utilised. A PT100 resistance temperature detector ranging between 0°C and 100°C was installed in the data logger for temperature measurements of the geyser heater elements. The power consumption experiments, indicating the type of heating element and experimental conditions, are shown in Table 6.
Heating cycle and temperature experiments of heating elements
The aim of heating cycle and temperature experiments was to show whether scaling deposits could affect the heating process of heating elements. The heating cycle and temperature reading experiments are shown in Table 7. These experiments were done by setting a thermostat temperature at 50°C or 60°C with unscaled and scaled heating elements. The fluctuation behaviour of the heating cycle and temperature of the heating elements was observed.
Electronic descaler technology experiments
Electronic descaler technology is an inexpensive technology that can be applied externally to water system pipes for treatment of scale formation. The treatment is achieved by connecting the descaler technology to the water heater bucket with the heating element being tested. This technology does not require cutting or plumbing of pipework. The descaler technology produces a frequency-modulated waveform. On application of these frequencies, an oscillating electric field is generated in the water, which agitates the water molecules. This ultimately triggers carbon dioxide (CO2) release, resulting in premature precipitation of calcium bicarbonate. Figure 2 shows the exterior and interior of the electronic descaler technology, as well the heating element experiment, with and without the descaler. The electronic descaler technology experiments, indicating the type of heating element and experimental conditions, are shown in Table 8.
RESULTS AND DISCUSSION
Water analysis
Table 9 provides the water chemistry results for tap water sampled from the H2O Science Laboratory and for the prepared salt solutions. A pH between 8 and 9 was achieved for the prepared salt solution. The Langelier saturation index (LSI), Ryznar stability index (RSI), and Puckorius scaling index (PSI) were also calculated for the tap water and prepared Salt Solutions 1 and 2, presented in Table 9. Furthermore, tap water from the H2O Science Laboratory was classified based on the concentration of total water hardness. The obtained calcium (Ca) hardness as CaCO3 was 59.94mg/L, the magnesium (Mg) hardness as CaCO3 was 24.69 mg/L, and the total water hardness as CaCO3 was 84.63mg/L for the tap water. Therefore, the tap water that was used to prepare salt solutions was classified as moderately hard water, which falls under the 61 to 120mg/L as CaCO3 category, based on Table 2.
In addition, the scaling and corrosion indices for tap water were calculated to indicate whether the tap water influenced the scaling formation or corrosive region of the geyser heating elements, as shown in Table 9. The tap water LSI of −0.76 indicated that the water was undersaturated, with a tendency to remove existing calcium carbonate scaling. The tap water RSI of 9.0 and PSI of 9.17 concurred that the tap water was more likely to cause corrosion than scaling. Therefore, it was clear that the chemistry of the tap water at the H2O Science Laboratory needed to be changed so that more scaling would be formed.
Salt Solution 1 contained calcium (Ca) hardness as CaCO3 of 2247.75 mg/L, magnesium (Mg) hardness as CaCO3 of 2633.74 mg/L, and total water hardness as CaCO3 of 4881.49mg/L. The total dissolved solids (TDS) in prepared Salt Solution 1 measured 5202.2mg/L. Therefore, prepared Salt Solution 1 was classified as moderately saline water, categorised between 1500 and 7000mg/L of TDS, based on Table 4. For prepared Salt Solution 1, the LSI was 2.94, RSI was 2.24, and PSI was 0.64, indicating that the water was supersaturated and had a tendency to form heavy and serious scaling. The results for prepared Salt Solution 2 showed Ca hardness as CaCO3 of 9990.01mg/L, Mg hardness as CaCO3 of 4938.27mg/L, and total water hardness as CaCO3 of 14928.28mg/L. The TDS in prepared Salt Solution 2 was 8649.60mg/L. This meant that the prepared Salt Solution 2 was classified as highly saline and categorised between 7 000 and 15 000mg/L of TDS, based on Table 4. For Salt Solution 2, the LSI was 4.70, RSI was −0.44, and PSI was −1.62, indicating that the water was supersaturated and had a tendency to form heavy and serious scaling, as shown in Table 9.
Scaling acceleration of heating elements
The first objective of this research was to develop a scaling acceleration method to shorten the test times for scaling the geyser heating elements (refer to Table 5 for experimental set up). In Experiment A1, prepared Salt Solution 1 was applied to a 1.5kW straight-shaped copper geyser heating element, coated with nickel. Figure 3 shows experimental results of the 1.5kW straight shaped heating element. In A1 (control), no scaling was formed. In A2, the build-up of scaling had started, which is called the nucleation stage, after 4 weeks of the trial. In A3, about a 1 to 3mm layer of lime scale was formed.
Figure 4 illustrates the state before and after a spiral-shaped copper 3 kW geyser heating element was exposed to the accelerated scaling process. Experiment B1 in Fig. 4 shows a new unscaled copper-coated 3 kW geyser heating element control. Experiment B2 shows the nucleation stage after 4 weeks of running the trial. Lastly, Experiment B3 shows a scaled 3 kW geyser heating element after 9 weeks of trial. The scale formation of the copper-coated surface 3 kW geyser heating element in Fig. 4 was not as significant as the copper-coated, with nickel, material of the heating element shown in Fig. 3. The copper material of the geyser heating element in Fig. 4 showed more resistance to scale formation than the copper-coated, with nickel, material. The findings of both experiments A and B confirmed that the developed scaling acceleration was a success, and the geyser heating elements were able to form scale within 9 weeks of the trials.
Power consumption of heating elements
The second research objective was to investigate the relationship between the power consumption of geyser heating elements and scaling formation due to total water hardness. The power consumption of scaled geyser heating elements was compared to new unscaled geyser heating elements. The power consumption experimental conditions indicating the type of heating element are shown in Table 6. The first trial was to compare the power consumption of the scaled copper-coated, with nickel, 1.5 kWgeyser heating element (A2) to the unscaled new heating element control (A1). Table 10 shows the power consumption comparison results of the scaled A2 experiment and the unscaled A1 experiment. The overall findings showed that the build-up of calcium carbonate deposits on the geyser heating elements led to increased power consumption by 6.8%.
The second trial was to compare a scaled copper-coated 3 kWgeyser heating element (B2) to the unscaled new heating element control (B1). The overall findings showed that the difference in power consumption between Experiments B1 and B2 was 11.8% (Table 10). The above experiments have indicated that scale formation on heating elements resulting from water hardness had an impact on power consumption. The third trial involved two scaled 3 kWcopper-coated, with nickel, heating elements, connected to the descaler; the only difference was that one heating element was immersed in the prepared Salt Solution 1 (C1), and another heating element immersed in tap water (C2). Figure 5 shows images of Experiments C1 and C2. About a 3.7% difference in power consumption between Experiments C1 and C2 was obtained (Table 10). The findings of this trial also confirmed that a change in solution media from prepared salt solution to tap water lowered the power consumption percentage.
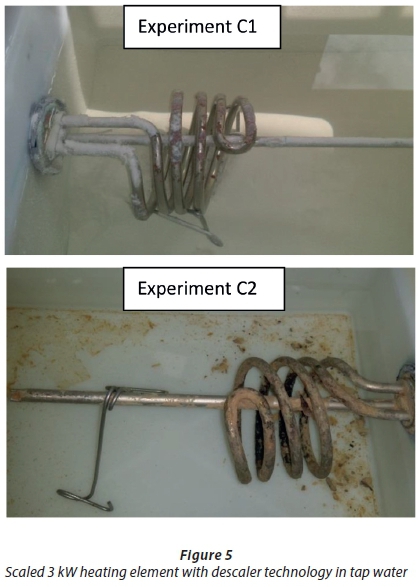
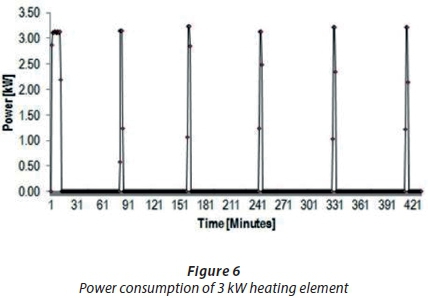
Figure 6 shows the typical heating cycle and power consumption of a 3 kW heating element for a testing period of 7 h (B2). The heating element was set at 50°C on a thermostat, and then the power consumption was observed as the thermostat switched on and off. The results of these power consumption trials proved that scale formation of 1.5 kWand 3 kWgeyser heating elements due to high total water hardness increased the power consumption by approximately 4% to 12%.
Heating cycle and temperature event fluctuations of heating elements
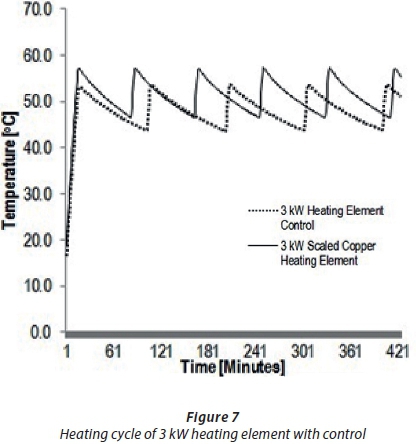
The heating cycle and temperature event fluctuation behaviour of heating elements was investigated by observing the behaviour of scaled and unscaled heating elements when a thermostat was set at a certain temperature. The experiments, indicating the type of heating element and experimental conditions for heating cycle and temperature event fluctuations, are shown in Table 7. An unscaled spiral-shaped 3 kWscaled copper-coated heating element (B1), was compared to a scaled one (B2). Figure 7 shows the results of the temperature readings for Experiments B1 and B2 at 50°C on the thermostat. These results indicate that the temperature of the scaled element (B2) was, on average, higher than that of the unscaled B1. It can also be predicted that, based on the results shown in Fig. 7, the scale formation in Experiment B2 caused the rise in temperature above the set point of 50°C, eventually increasing the power consumption.
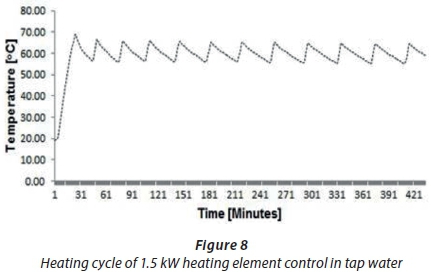
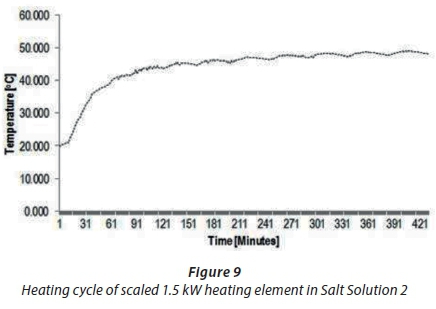
A second trial was performed to compare the heating cycle of an unscaled straight-shaped 1.5 kWcopper-coated heating element (A1) with the scaled heating element (A4). Figures 8 and 9 show the typical temperature and heating cycle of Experiments A1 and A4, respectively. The results presented in Fig. 8 illustrate the typical or normal behaviour of a new heating element with a thermostat switching on and off within 5°C to 6°C of the set 60°C thermostat temperature. The fluctuations in the temperature findings shown in Fig. 9 for Experiment A4 did not define the start and stop events, which ought to depend on the set temperature of the thermostat of 60°C, compared to the A1 results depicted in Fig. 8. These findings showed that the thermostat temperature was about 40°C instead 60°C. The results in Fig. 9 confirmed that the scale formation due to scale deposits on the heating elements led to decreased operational performance of the thermostat. Scaling of heating elements due to total water hardness caused drifting of the thermostat temperature setting.
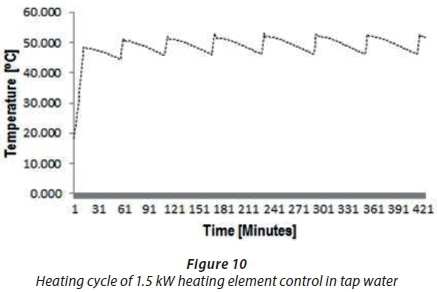
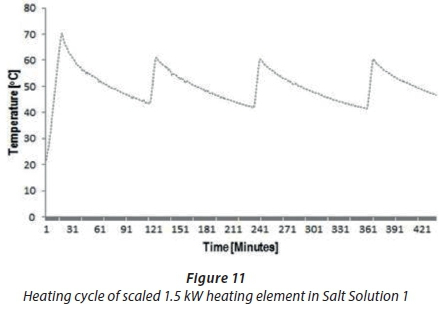
The last experiment (A2) was performed with a scaled 1.5 kWstraight-shaped copper-coated heating element, which was immersed in prepared Salt Solution 1 at 50°C. Figure 11 shows the results obtained in Experiment A2. The findings for A2 indicated a different abnormal fluctuation behaviour of temperature compared with unscaled 1.5 kWheating element (A5), as shown in Fig. 10. The start and stop temperature events in Fig. 11 were abnormal and longer. Typically, a thermostat will switch on and off every 30 min, as shown in Fig. 10, but in Fig. 11 it is seen that this occurred after about 1.5 h. These results confirmed the inefficient performance of the thermostat caused by scale formation on heating elements.
Electronic descaler technology
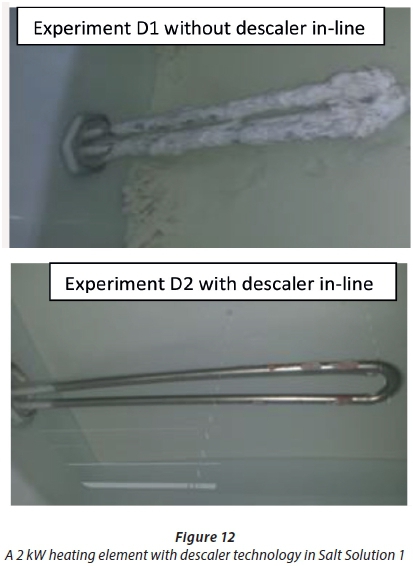
The third research objective was to investigate whether the descaler technology would inhibit or minimise the scaling formation on the 2 kWgeyser heating element. Experiment D1, a new 2 kWstraight-shaped heating element, copper-coated, without descaler was compared to Experiment D2 connected to a descaler. The type of heating element and experimental conditions are shown in Table 8. Figure 12 shows that there was insignificant scale formation in Experiment D2 because the descaler technology was connected, compared to the heating element without the descaler in D1. These results confirmed that electronic descaler technology did, indeed, minimise the formation of scaling deposits on the 2 kWgeyser heating element.
Another trial was performed to investigate the amount of power used by the electronic descaler to provide evidence that the descaler did not have excessive power consumption. A new straight-shaped 2 kWheating element, copper-coated, with descaler (D2) was compared to Experiment D3 without descaler (refer to Table 6 for experimental set up). Table 11 shows the obtained power consumption difference between Experiments D3 and D2 to be 0.47 kW. These results confirmed that lower power usage was required by the descaler to minimise scale formation on the heating elements. In addition, the overall power consumption findings of Experiment D2 with a descaler are illustrated in Figs 13 and 14.
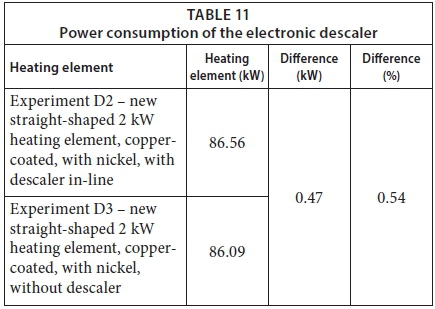
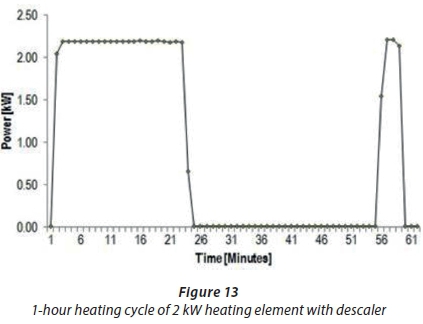
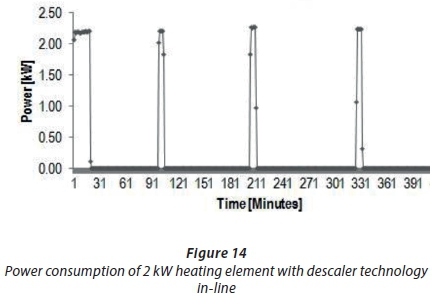
Figure 13 shows the 1-h heating cycle results of Experiment D2 with the thermostat set at 50°C. In Fig. 13, it can be observed that about 2.2 kWof power was consumed with the 2 kWheating element in a salt solution connected to the descaler. These results showed that the heating element continued to consume the same amount of power for about 25 min, and only after 30 min did the heating element switch on to consume more power. Figure 13 shows that the amount of power required for the descaler to treat scale build-up was low; hence, it was regarded as energy efficient. Figure 14 shows the additional results of Experiment D2; the duration of the experiment was, however, 7 h. The findings in Fig. 14 indicated that about 2.2 kWof peak power was consumed throughout the testing period. The heating cycle pattern was delayed to about 60 min, as shown in Fig. 14. This might be due to the fact that Salt Solution 1, with high water hardness, was used in this experiment. The third objective was, thus, achieved because the descaler was able to minimise scale formation at a lower power usage.
CONCLUSION
This research sought to investigate the impact of scale formation due to total water hardness on the power consumption of hot water technologies such as geyser heating elements. The first research objective was to develop a scaling acceleration method to shorten the time required for geyser heating element testing. The acceleration method was developed using calcium carbonate (CaCO3), calcium sulphate (CaSO4·2H2O), magnesium chloride hexahydrate (MgCl2·6H2O), and magnesium sulphate (MgSO4·7H2O). Scaling formation acceleration factors included a fixed operating thermostat temperature of 70°C, a scale formation time of 2 to 3 months, Salt Solution 1, and a pH range between 8 and 9. The development of a scaling acceleration method for heating elements was achieved.
The second research objective investigated the relationship between power consumption of geyser heating elements and scale formation due to total water hardness. It was shown that scale formation of heating elements increased power consumption by approximately 4% to 12%, depending on the type of material of the heating element and scale formation layer. Moreover, it was found that scaling altered the set temperature of thermostats, ultimately having an impact on the overall performance of heating elements.
The third research objective was to test electronic descaler technology on heating elements, using the accelerated scaling method. The overall findings indicated that there was minimal scale formation on the heating elements. The technology also operated successfully when a more concentrated solution (Salt Solution 1), was applied. In addition, the electronic descaler technology used an insignificant amount of power throughout the experimental duration when compared to the heating elements without the technology.
ACKNOWLEDGEMENTS
The author, Lerato Lethea, would like to extend her gratitude to the Demand Management Centre of Expertise Middle Manager, Mrs Ronel Clarke, at Eskom Research, Testing, and Development, for supporting this research project performed under the H2O Science Laboratory. Her management and leadership are sincerely acknowledged.
REFERENCES
ANTONY A, LOW JH, GRAY S, CHILDRESS AE, LE-CLECH P and LESLIE g (2011) Scale formation and control in high pressure membrane water treatment systems: A review. J. Membr. Sci. 383 1-16. https://doi.org/10.1016/j.memsci.2011.08.054 [ Links ]
ARUNCHALA UC (2011) Performance deterioration of thermosiphon solar flat plate water heater due to scaling. IIUM Eng. J. Special Issue, Mechanical Engineering, 2011 117-132. [ Links ]
BRAZEAU RH and EDWARDS MA (2011) A review of sustainability of residential hot water infrastructure: Public health, environmental impacts, and consumer drivers. J. Green Build. 6 (4) 77-95. https://doi.org/10.3992/jgb.6.4.77 [ Links ]
CATHERINE Q, WHEELER J, WILKINSON R and DE JAGER g (2012) Hot water usage profiling to improve geyser efficiency. J. Energ. South. Afr. 23 (1) 39-45. [ Links ]
DE ZUANE J (1997) Handbook of Drinking Water Quality (2nd edn). John Wiley & Sons Inc., New York. 29 pp. [ Links ]
DOBERSEK D and GORICANEC D (2007) Influence of water scale on thermal flow losses of domestic appliances. Int. J. Math. Models Meth. Appl. Sci. 2 (1) 55-61. https://doi.org/10.1016/j.energy.2014.09.024 [ Links ]
DOBERSEK D and GORICANEC D (2014) An experimentally evaluated magnetic device's efficiency for water-scale reduction on electric heaters. Energy 77271-278. [ Links ]
GOPALAN R, ANAND A and SUGUMAR RW (2008) A Laboratory Manual for Environmental Chemistry. I.K. International Publishing House Pvt. Ltd, New Delhi. 191 pp. [ Links ]
GOUWS R and LE ROUX E (2012) Efficiency and cost analysis of a designed in-line water heating system compared to a conventional water heating system in South Africa. J. Energ. South. Afr. 23 (3) 9-15. [ Links ]
HASSON D, SIDORENKO g and SEMIAT R (2010) Calcium carbonate hardness removal by a novel electrochemical seeds system. Desalination 236 (1-3) 285-289. https://doi.org/10.1016/j.desal.2010.06.036 [ Links ]
IBRAHIM O, FARDOUN F, YOUNES R and LOUAHLIA-GUALOUS H (2014) Review of water-heating systems: General selection approach based on energy and environmental aspects. Build. Environ. 72259-286. https://doi.org/10.1016/j.buildenv.2013.09.006 [ Links ]
RAS HS and GHIZELLAOUI S (2012) Determination of anti-scale effect of hard water by test of electrodeposition. Proc. Eng. 33 357-365. https://doi.org/10.1016/j.proeng.2012.01.1215 [ Links ]
REIF JH and ALHALABI W (2015) Solar-thermal powered desalination: Its significant challenges and potential. Renew. Sustainable Energ. Rev. 48 152-165. https://doi.org/10.1016/j.rser.2015.03.065 [ Links ]
SAIFELNASR A, BAKHEIT M, KAMAL K and LILA A (2013) Calcium carbonate scale formation, prediction and treatment (Case study Gumry Oilfield - PDOC). Int. Lett. Chem. Phys. Astron. 12 47-58. https://doi.org/10.18052/www.scipress.com/ILCPA.17.47 [ Links ]
SENGUPTA P (2013) Potential health impacts of hard water. Int. J. Prev. Med. 4 (8) 866-875. [ Links ]
SHAMS M, MOHAMADI A and SAJADI SA (2012) Evaluation of corrosion and scaling potential of water in rural water supply distribution networks of Tabas, Iran. World Appl. Sci. J. 17 (11) 1484-1489. [ Links ]
SKOOG DA, WEST DM, HOLLER FJ and CROUCH SR (2014) Fundamentals of Analytical Chemistry (9th edn). Brooks/Cole Cengage Learning, Belmont USA. 436 pp. [ Links ]
STICKFORD GH Jr. and JOHNSON OD (1984) The effect of hard-water scale buildup on water heater life-cycle efficiency, Gas Research Institute, Battelle Columbus, Ohio, United States. E238-E251. [ Links ]
WIDDER SH and BAECHLER MC (November 2013) Impacts of water quality on residential water heating equipment. Battelle Pacific Northwest National Laboratory, Richland, Washington 99352, PNNL-22921, 1.1-4.3. [ Links ]
Received 25 July 2017
Accepted in revised form 9 October 2017
* To whom all correspondence should be addressed. e-mail: Lerato.Lethea@eskom.co.za
