


Servicios Personalizados
Articulo
 Inglés (pdf)
 Articulo en XML
 Referencias del artículo
Indicadores

Links relacionados
-
 Citado por Google
 -
 Similares en Google
Compartir

 Permalink
Water SA
versión On-line ISSN 1816-7950
versión impresa ISSN 0378-4738
Water SA vol.43 no.4 Pretoria oct. 2017
http://dx.doi.org/10.4314/wsa.v43i4.04
Hydraulic performance of sluice gate with unloaded upstream rotor
Mohamed ElgamalI, II, *; Neveen Abdel-MageedIII; Ahmed HelmyII; Ashraf GhanemII
IAl Imam Mohammad Ibn Saud Islamic University, IMSIU, Riyadh, Saudi Arabia
IIIrrigation and Hydraulics Department, Cairo University, Egypt
IIIFaculty of Engineering, Banha University, Banha, Egypt (PO Box 11629, Shoubra, Egypt
ABSTRACT
This study presents video analysis of the hydraulic performance of a sluice gate with an unloaded upstream built-in rotor. A number of laboratory experiments were conducted using two unloaded rotor shapes. The first was the cross-shaped rotor and the second was the Savonius-like rotor. A new video analysis technique was introduced for measuring rotor angular speed and its perturbation. Swift speed cameras and Tracker software were used to measure the upstream backwater depth and to estimate the instantaneous variation of the rotor speed. The study shows that adding a rotor upstream of the gate caused the upstream water level to increase such that the averaged normalized afflux increased to 1.72 and 0.9 for the cross-shaped and the Savonius rotors, respectively. Lab experiments indicated that the water flow-structure interaction for the sluice-rotor is quite complex and nonlinear. Two main flow regimes were distinguished. The flow regimes are: the flow through a rotor with possible weir flow conditions and the orifice flow conditions. The time-averaged angular speed of the tested Savonius-like rotor ranged between 0 and 300 r/min. As the upstream backwater depth increased, the angular speed increased; however, the rate was significantly lower for the orifice flow condition compared to the flow under rotor and weir flow conditions. The video analysis also indicated that significant perturbation exists for the rotor angular speed. The normalized perturbation intensity varied from a minimum of 8% to a maximum of 60%.
Keywords: sluice gate, rotor, angular speed, video analysis, hydropower
INTRODUCTION
Sluice gates are hydraulic structures that were conventionally used by ancient civilizations to control upstream water levels in rivers, streams and open irrigation networks, by adjusting gate openings. A large number of experimental and numerical research studies have been directed towards the investigation of the hydraulics of flow under single controlling gates. Examples of such research studies are Binnie (1952), Rajaratnam and Subramanya (1967), Swamee (1992) and Petriala (2002). Other studies have been conducted to study the hydraulic performance of modified versions of sluice gates designed to achieve specific objectives such as constant flow or constant upstream water levels (Helmi and El-Gamal, 2012).
For many decades, scientists and engineers have been trying to obtain clean energy from the sun, wind and flowing water. Hydropower from rivers is one of the best renewable sources of green energy, since it is relatively predictable compared to other sources such as wind energy. Accordingly, several research efforts have been made to generate hydropower from open channels using different runner or rotor shapes (Hydrovolts, 2013; Khan et al., 2009). The historical Savonius runners were used for power generation from wind, tides and sea waves (Zingman, 2007) and (Yaakob et al., 2012). Recently a number of studies have been conducted to investigate the hydraulic performance of the Savonius rotor in open channel power generation applications (Carravetta et al., 2014; Giugni et al., 2014; Golecha et al., 2011; Lubitz et al., 2014; Nakajima et al., 2008a, 2008b; Rachman, et al., 2013).
In this study, the hydraulic performance of a sluice gate with an upstream hydropower rotor was investigated experimentally under unloaded conditions. Adding a rotor to the sluice gate could be used for many applications. For instance, the roto-sluice gate system could be used to generate energy while controlling the water level upstream of the gate. This can be done by controlling the load on the rotor that would cause the angular speed of the rotor to change and thus the water level to be adjusted accordingly. In other words, instead of changing the gate opening, the load acting on the rotor could be controlled to produce the required water level adjustment. Doing so will significantly reduce the required conventional power cost for lifting the gate. Moreover, the gained hydropower that is generated by the rotor is an extra benefit of the system.
Another application of a hydropower rotor is that of generating energy while dissipating it. In this application, the proposed rotors could be used to replace the energy dissipater baffle blocks that are commonly used in stilling basins to dissipate energy downstream of hydraulic structures. This would enable the conversion of part of the stream energy downstream of sluice gates to useful energy rather than just wasting and dissipating it. A third application for the roto-sluice gate is related to the enhancement of turbulent mixing and air entrainment properties for the water volumes passing through the gate.
The focus of this paper is to investigate the hydraulic performance of the unloaded roto-sluice gate only. Two types of rotor blades were experimentally examined. The first is the cross-shaped flat rotor and the second is the Savonius-like rotor. All rotors were set just upstream of the sluice gate and the new hydraulic performance of the gate was examined and compared with the base case where no hydropower rotor exists.
METHODOLOGY
Experimental setup
The lab experiments were conducted in the Irrigation and Hydraulics Laboratory, Cairo University, using a rectangular tilting flume that is 12 m long with a cross-section of 300 mm width and 500 mm depth. The flume has an adjustable bed slope. A tailwater gate at the end of the flume was used to control the downstream water level. Water was circulated between the flume and a set of connected ground tanks via a pumping system. The pumping system was supplied with a gate valve to control the discharge and a 100 mm turbine-type flow meter to measure the volumetric flow rate (Fig. 1). A vertical gauge was fixed upstream of the gate to measure the water level. A relatively high-speed digital camera was used to measure the rotor angular speed. A high-power torch (about 200 lumen) was used as a concentrated light source to adequately light up the revolving rotor.
Rotors under investigation
The original Savonius rotor was invented by Sirgurd Johannes Savonius in 1922, to generate energy from wind power (Yaakob et al., 2012). In this study, the Savonius rotor (with minor differences from the original dimensions, hereafter called 'Savonius-like' rotor) was selected, since it does not generally require a high head difference and the rotor is classified as a drag-based or kinetic energy-based rotor (Zingman, 2007).
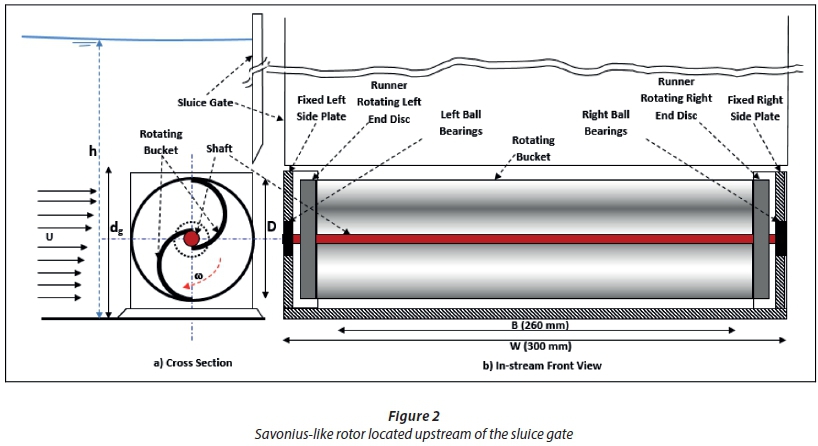
The rotor for this experimental setup was made of Plexiglas material with an average density of 1.19 gm/cm3. The rotor consists of two blades (or buckets) supported by two end (right and left) rotating discs of diameter D (D = 60 mm) (Fig. 2).
The end rotating discs are concentrically mounted on a horizontal shaft that is held by ball bearings that are fastened in the fixed right and left side plates (Fig. 2). The blades constitute two thin semi-circular buckets (3 mm in thickness): one is concave and the other is convex. Each bucket has an outer diameter that is slightly greater than ½ the rotor diameter D. Due to the slight bucket overlap at the shaft location, the total distance from one bucket tip to the other is D. As water flows from left to right (see Fig. 2), the rotor starts to rotate in the clockwise direction, mainly due to the drag difference between the concave and convex buckets. According to White (White, 2015), the typical drag coefficient for the concave bucket (CD = 2.3) is nearly twice the drag coefficient for the convex bucket (CD = 1.2). The drag difference between the concave and convex buckets ensures that the rotor revolves in different velocity field conditions.
Measurement of angular speed
One of the parameters that require measurement is the angular speed of the rotating rotor. Approaches that are commonly used to measure the angular speed include the use of tachometers, stroboscopes and, more recently, by using video analysis. The video analysis approach is a new technique that has recently been applied and successfully used to study the fundamental physics of rigid body motion, including projectile trajectory, 2D-collision and rotational dynamics of cylindrical plates (Robert, 2007; Eadkhong et al., 2012).
A number of smartphone freeware applications (RPM meter, RPM calculator) are currently available to approximately determine the average angular speed of a rotating object, like the rotor of a small fan or a low-speed spinning machine. However, such applications are not yet well examined and most of them were attempted for small r/min speed ranges (up to 400 r/min). Moreover, based on the authors' experience, such applications are not yet successful in obtaining the angular speed of rotating objects submerged in water.
In this study, the video analysis technique was used to measure the instantaneous angular speed of a rotating rotor that is submerged in water. The technique can be used without the need to dim the light (contrary to stroboscopes). It can also be used to determine more information about the unsteadiness of the angular speed by measuring the rotor angular speed perturbation and its time-averaged value. Obtaining information about the perturbation intensity of the angular speed of a revolving rotor is important for identifying the favourable operation setting of a revolving rotor. It is also expected that the perturbation intensity could be used as an index for selecting the relevant position of a hydropower rotor in a river or a channel reach for a given flow field.
The adopted technique relies on the use of high-speed cameras. A number of point-and-shoot digital cameras or bridge cameras are currently available on the market that are capable of recording relevant resolution images at swift frame rates, and which are priced under 200 USD. In order to help in selecting the relevant camera for a given application, the authors prepared Table 1 as a guide to identify the required minimum frame per second (fps) rate for the camera to be used in similar studies. The values given in Table 1 are based on allowing about 10 frames for each full rotor revolution to ensure an acceptable resolution for calculating the angular speed perturbation and to avoid the necessity of applying sophisticated image processing filters on the captured snapshots.
A 16 megapixel Fujifilm digital camera, model FinePix F770 EXR, was used in the experiments. The camera has a number of movie mode options including: 30 frame/s with resolution HD 1 920 × 1 080; 80 frame/s with resolution HS 640 × 480 and 160 frame/s with resolution HS 320 × 240. Accordingly, a maximum angular speed of about 1 000 r/min could be measured using the selected F770 camera model, with fair resolution.
In order to analyse the recorded videos, two approaches could be used. The first approach is based on a manual analysis frame by frame and this could be conducted by using free video player software such as QuickTime Player (version 7.7.6) or similar. Such a video player could be used to track the object variations from frame to frame on a manual basis. Using a 160 frame/s setting with measurement duration of 10 s means that manual analysis of more than 1 500 shots for a single angular speed measurement would be needed, which renders the manual handling approach too time consuming. The second video analysis approach is to use one of the available video analysis and modelling software programs to automatically analyse the captured frames. Currently there are many different video analysis software available, including: Vernier, Tracker, Logger Pro and many others (Eadkhong et al., 2012).
In this study, Tracker software (version 4.86) was used. Tracker is freeware video analysis software that was developed by Brown in 2011 as a project of Open Source Physics (Brown, 2013).
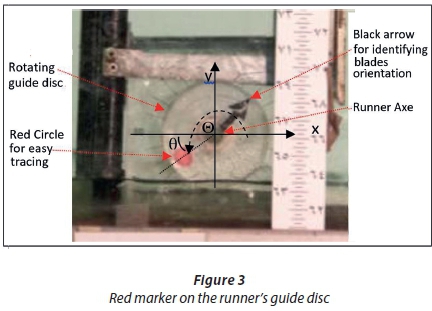
In order to use Tracker to measure the angular velocity, a red marker, a dot of radius 5 mm, is drawn on the runner rotating end disc (Fig. 3). A set of x and y axes is also positioned at the centre of the runner's axe. A black arrow was also added to visually identify the blade orientation in cases of low angular speed rates. The red marker is auto-tracked via Tracker and the temporal variation of the x and y coordinates of the red marker are identified and plotted (example shown in Fig. 4). Figure 4 also shows the typical results of the auto-tracking procedure performed by Tracker. The coordinates of the red marker were then used to determine the angular speed as indicated in the following steps:
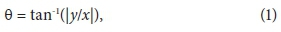
- Determine the acute angle (θ) of the line (in radians) from the origin to the red mark as:
- Determine the polar angle Θ (measured from the positive x-axis and anti-clockwise) according to the location of the red mark as follows:
- for the first quadrant; Θ = θ
- for the second quadrant; Θ =π−θ
- for the third quadrant; Θ = π + θ
- for the fourth quadrant; Θ = 2π−θ
- Determine the instantaneous angular speed ω(t) of the runner; where t denotes time;

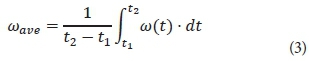
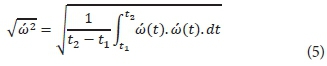
- Use a suitable time scale (generally 5 to 10 s) and determine the time-averaged value of the angular speed (ωave)
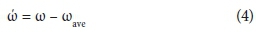
The instantaneous perturbation of the angular speed (is defined as:
The root mean square of instantaneous perturbation of the angular speed (is defined as:
Experimental runs
As a base run and for comparison purposes, a sluice gate with a gate opening (dg) of 70 mm with no rotors was tested first. The tailwater gate was kept open to avoid any effect of downstream submergence on gate performance. The sluice gate rating curve with no rotor is presented in Fig. 5. The discrepancy between the rating curve trends of the sluice gate for rising and falling stages (increasing and decreasing flow while the gate opening is kept constant) is known as hysteresis and is shown in Fig. 5. It was observed that the hysteresis for the gate with no rotor case is not significant. Figure 5 also presents the analytical rating curve for the gate (for orifice flow stage) as per Eq. 6.
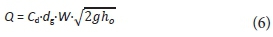
Where ho is the water flow depth upstream of the gate in the case of no rotor, W is the flume width, Cd is the discharge coefficient and dg is the gate opening. The discharge coefficient that gives the best match of the analytical equation, Eq. 6, with the measurements is Cd = 0.66.
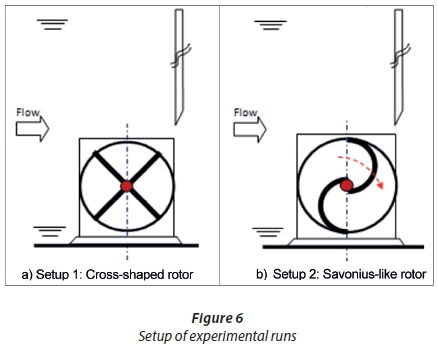
Two rotor shapes were examined in this study. For Setup 1, a cross-shaped rotor (Fig. 6a) that is made of flat plexiglas sheets was adopted. For Setup 2, a Savonius-like rotor (Fig. 6b) made of plexiglas sheets was used. The flow discharge for both model setups was changed from 0 to 30 L/s and the corresponding rating curve (h versus Q) and angular speed (ω) were measured.
RESULTS AND DISCUSSION
The flow structure through the roto-sluice gate is complex and nonlinear due to the mutual interactions among the flow, the gate and the rotor. Two main flow regimes could be distinguished: the low-flow regime and the high-flow regime. The low-flow regime takes place when the upstream water surface does not touch the lower tip of the gate. For the low-flow regime scenario, the flow pattern comprises the flow through the rotor with possible weir flow condition and no gate interaction with the flow. In this case, the upstream backwater depth ratio is relatively shallow and less than 1.4−1.6 times the gate opening (h/dg ≤ 1.4−1.6). The high flow regime occurs when the upstream water surface submerges the lower tip of the gate (h/dg > 1.6). In this case full interaction exists among the flow, the rotor and the gate (Fig. 7).
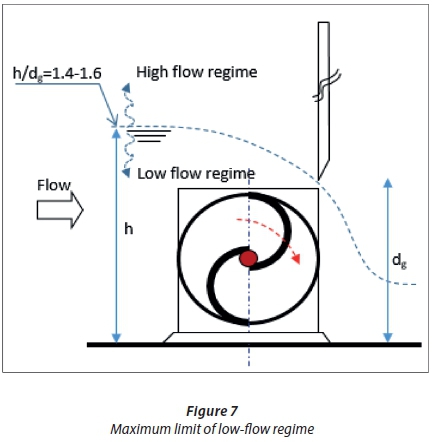
Figure 8 shows the dimensionless rating curve of the sluice gate with a Savonius-like rotor located just upstream of the gate (Setup 2, Fig. 6b). It also presents a comparison of the corresponding dimensionless rating curves for the cross-shaped case (Setup 1) and for the no-rotor case (base run). It is clear that adding the Savonius-like rotor produces upstream damming which is significantly lower than the corresponding values produced by adding the cross-shaped rotor.
For comparison and discussion purposes, it is convenient to define the following hydraulic parameters:
•ho is the flow depth upstream of the gate for the case using no rotor
•h is the flow depth upstream of the gate for the case when using a rotor (refer to Fig. 2)
•The afflux is defined as the increase in the upstream flow depth as a result of using a rotor over the corresponding value of the no rotor case; the afflux = (h − ho)
•The normalized afflux is defined as the afflux divided by a reference damming which is the corresponding damming in the case of no rotor; the normalized afflux = (h − ho)/ho
•The normalized flow rate is a dimensionless number and is calculated as:

Figure 9 presents how the normalized afflux varies with the normalized flow rate. The figure shows that the normalized afflux varies from a minimum of 0.74 to a maximum of 1.37, with an average value of 0.9 for the Savonius-like rotor case corresponding to values of 1.06 (minimum), 2.31 (maximum) and 1.72 (average), respectively, for the cross-shaped rotor case. This means that the tested Savonius-like rotor produces normalized afflux values 48% less than the cross-shaped rotor.
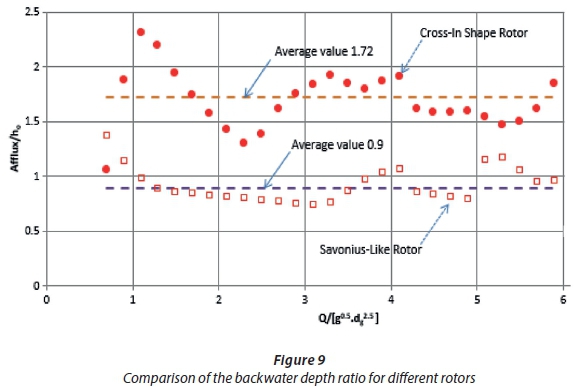
Figure 10 describes how the angular speed of the Savonius-like rotor increases with the increase in the upstream backwater depth. The average angular speed varies from 0 to a maximum value of the order of 300 r/min as the upstream backwater depth increases. The angular speed seems to increase linearly with the upstream backwater depth; however the trend of increase differs based on the flow regime. The rate of increase of the angular speed is significantly higher in the low-flow regime (weir flow) compared to the high-flow regime (orifice flow). In the case of the low-flow regime, the main source of flow constriction is the rotor, whereas in the case of the high-flow regime, the gate in addition to the rotor causes the main flow constriction and flow diversion towards the gate opening. This means that the flow constriction is larger for the high-flow regime compared to the low-flow regime and this might justify the change in the rate of increase of the angular speed between the two flow regimes. Figure 10 also describes the variation of the root mean square (rms) perturbation of the angular speed with upstream backwater depth at the gate. Relatively high rms perturbations exist at low and high backwater depth values and minimum rms perturbation exists at mid values of h/dg (h/dg = 3.0).
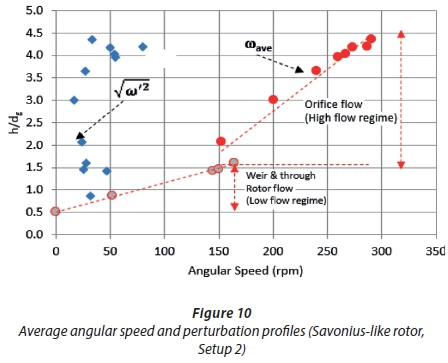
In order to draw a more generic conclusion from Fig. 10, angular speed should be normalized. In this regard, the time-averaged angular speed (wave) was normalized using a reference angular speed scale (wo). The reference angular speed was defined as the speed of the rotor in the case of assuming a no-slip condition between the boundary flow and the rotor peripheral speed, while neglecting all the hydrodynamic losses under the gate opening (i.e. coefficient of discharge Cd = 1). Based on the aforementioned definition, the angular speed scale (wo) could be expressed as given in Eq. 7:
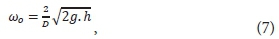
Where: D is the rotor diameter and h is the upstream backwater depth measured from the bed.
The outcomes of the normalisation process are presented in Fig. 11. Also, the rms perturbation of the angular speed  is normalized using the time-averaged angular speed (wave) and the outcomes are presented in Fig. 12.
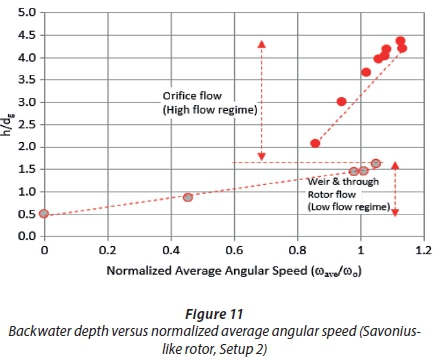
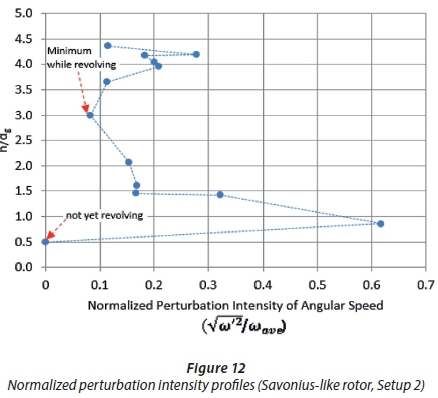
Figure 12 shows that the minimum normalized perturbation intensity (during rotor revolving) is about 0.085 (i.e., 8.5%) and is located in the middle of the orifice regime. The minimum normalized perturbation intensity could be looked at as the most favourable revolving condition because it is characterised by the least oscillations. On the contrary, the point that has the condition of greatest unsteadiness (with the highest oscillations) is located close to h/dg = 1 (i.e. at the commencement of weir flow regime - in such a case, the maximum normalized perturbation intensity is more than 60%).
Temporal variation of angular speed
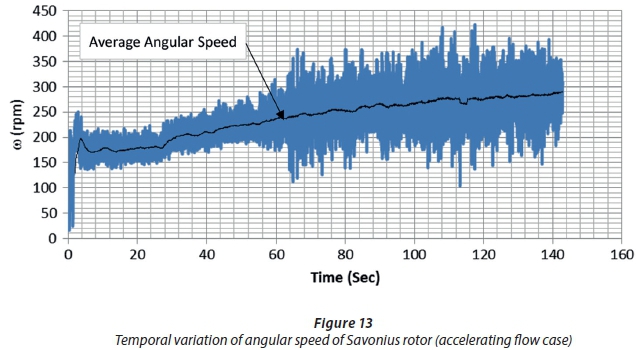
Experimental results indicated that the angular speed varies with time for the cases of local 'temporal' accelerating (Fig. 13) and decelerating flow (Fig. 14). For this experiment, the upstream backwater depth and the angular speed were automatically observed by two high-speed cameras. The accelerating flow case was produced by turning on the water-supplying pump to enable simulation of the rising limb of a flood wave. The decelerating flow case was produced by turning off the pump and preventing water from recirculating back into the channel flume.
Comparing Figs 13 and 14, it is observed that the perturbation intensity of the angular speed is greater in the accelerating flow case compared to the decelerating flow case. The abovementioned observation apparently contradicts the fact of having less flow turbulence intensity in case of accelerating flow and high flow turbulence for the decelerating flow (Song and Chiew, 2001; Heidari et al., 2016). It should be emphasized that those studies reported in the literature describe the flow turbulence intensity in the case of convective accelerating/decelerating flow with no rotor. In this study, our observations are related to the local (temporal) accelerating/decelerating flow with a revolving rotor. In the case of a revolving rotor, the flow-rotor interaction is significantly different and more complicated compared to the abovementioned case studies.
CONCLUSION
In this study, the hydraulic performance of a sluice gate provided with a rotor located upstream of the gate was examined. Two plexiglas small-scale models for two different rotor shapes were studied in the laboratory. The first rotor is a plain cross-shaped rotor and the second rotor is a Savonious-like rotor.
A new measuring approach based on video analysis was proposed and adopted to measure the temporal variation of the angular speed of the rotor. The new approach made use of point-and-shoot cameras (available on the market) that have the capability of capturing video at a high frame rate. An automated analysis for the captured video measurements was conducted using freeware software called Tracker (version 4.7.6), so as to track the revolving motion of a traced object (red circle in this study) that was marked on the rotor. It has been observed that a point-and-shoot camera (currently costing less than 200 USD) capable of capturing 160 frames/s with a fair resolution (320 x 240 or better) could be used to measure the temporal variation of a maximum angular speed up to ω = 1 000 r/min.
After using the aforementioned system for tracking the angular speed, the following conclusions can be made:
•Setting the cross-shaped rotor upstream of the gate resulted in a non-revolving rotor, because there is no significant difference in the drag forces of the upper (above the shaft) and the lower (below the shaft) blades of the rotor. As the cross-shaped rotor is not rotating, significant obstruction is caused to the flow passing underneath the gate and, as a result, a significant damming is observed for this rotor shape, with an observed average afflux ratio of 1.72.
•Setting the Savonius-like rotor upstream of the gate resulted in a rotating rotor, because there is a significant difference in the drag forces between the upper (concave bucket) and the lower (convex bucket) blades of the rotor. Due to the rotation of the Savonius-like rotor, the upstream damming is significantly decreased (in comparison to the cross-shaped rotor) with an observed average afflux ratio of 0.9.
•The flow structure through the gate with a revolving rotor is complex and nonlinear. Two main flow regimes could be distinguished. These flow regimes are: the flow through a rotor with possible weir flow regime (low flow) and the orifice flow regime (high flow). The first flow regime takes place when the upstream water surface does not touch the lower tip of the gate. In this case, the upstream backwater depth ratio is relatively shallow and less than 1.4-1.6 times the gate opening (h/dg ≤ 1.4−1.6). The second flow regime exists when the upstream water surface submerges the lower tip of the gate (h/dg > 1.6).
•It was observed that the time-averaged angular speed of the tested Savonius-like rotor ranged between 0 and 300 r/min and, as expected, it increased as the upstream backwater depth increased. However, the rate of increase is significantly lower for the orifice flow regime compared to the flow through the rotor and weir flow regime.
•With the help of the video analysis, it was possible to identify the perturbation of the angular speed of the rotor to calculate the normalized perturbation intensity, to help in identifying the favourable operating condition that produces the least perturbation of the rotor. For the test cases under consideration, the favourable operating condition exists at h/dg = 3 with a normalized perturbation intensity of 8.5%.
•It should be emphasised that the presented work is an initial study that focused on investigating the hydraulic performance of a sluice gate with upstream unloaded rotors. The obtained results are considered valuable as they provide insight into the interaction of flow and unloaded rotors. Such data will help researchers in better calibrating and validating CFD models and in obtaining a better understanding of the flow structure for such complicated applications.
ABBREVIATIONS
Br: Width of rotor blades, refer to Fig. 2
Cd: Gate coefficient of discharge (for orifice stage flow)
CD: Coefficient of drag for rotor blades
D: Rotor diameter, refer to Fig. 2
dg: Sluice gate opening, refer to Fig. 2
g: acceleration of gravity
h: Backwater depth measured upstream of the gate and rotor from the bed, refer to Fig. 2
ho: Backwater depth upstream of the gate with no built-in rotor
Q: Water flow through the gate
W: Width of flume, refer to Fig. 2
x: x-axis coordinate measured from the centre located at the rotor shaft, refer to Fig. 3
y: y-axis coordinate measured from the centre located at the rotor shaft, refer to Fig. 3
θ: the acute polar angle of the dot tracked object, refer to Fig. 3
Θ: the polar angle of the dot tracked object measured from the positive x direction, refer to Fig. 3
ω: Instantaneous runaway angular speed of a rotor
wave: Time average runaway angular speed of a rotor
wo: Angular speed scale, refer to Eq. 7
ω': Instantaneous perturbation in runaway angular speed, refer to Eq. 4
Time average of root mean square (rms) values of instantaneous perturbation of runaway angular speed
Normalized perturbation intensity for the angular speed
ACKNOWLEDGEMENTS
The authors would like to thank Miss Sana and Mariam Elgamal for helping in editing and punctuating the text of this manuscript.
AUTHOR CONTRIBUTIONS
M Elgamal and A Helmy conceived and designed the experiments; M Elgamal, A Helmy and N Abdel-Mageed performed the experiments; A Ghanem, N Abdel-Mageed and M Elgamal analysed the data; A Helmy and M Elgamal contributed materials/analysis tools; M Elgamal, N Abdel-Mageed and A Ghanem wrote the paper.
CONFLICTS OF INTEREST
The authors declare no conflict of interest. The funding sponsors had no role in the design of the study; in the collection, analyses, or interpretation of data; in the writing of the manuscript, and in the decision to publish the results.
REFERENCES
BINNIE A (1952) The flow of water under a sluice-gate. Q. J. Mech. Appl. Math. 5 (4) 395-407. https://doi.org/10.1093/qjmam/5.4.395 [ Links ]
BROWN D (2010) Tracker introduction to video modeling (AAPT 2010). Portland, Oregon. URL: http://www.compadre.org/Repository/document/ServeFile.cfm?ID=10188&DocID=1749 (Accessed 15 May 2013). [ Links ]
CARRAVETTA A, FECAROTTA O, SINAGRA M and TUCCIARELLI T (2014) Cost-benefit analysis for hydropower production in water distribution networks by a pump as turbine. J. Water Resour. Plann. Manage. 140 (6) 1-8. http://dx.doi.org/10.1061/(ASCE)WR.1943-5452.0000384 [ Links ]
EADKHONG T, RAJSADORN R, JANNUAL P and DANWORAPHONG S (2012) Rotational dynamics with Tracker. Eur. J. Phys. 33 615-622. http://iopscience.iop.org/article/10.1088/0143-0807/33/3/615/pdf [ Links ]
GIUGNI M, FONTANA N and RANUCCI A (2014) Optimal location of PRVs and turbines in water distribution systems. J. Water Resour. Plann. Manage. 140 (9) 1-6. http://dx.doi.org/10.1061/(ASCE)WR.1943-5452. [ Links ]
GOLECHA K, ELDHO T and PRABHU S (2011) Influence of the deflector plate on the performance of modified Savonius water turbine. Appl. Energ. 88 (9) 3207-3217. http://dx.doi.org/10.1016/j.apenergy.2011.03.025 [ Links ]
HEIDARI M, ROUSSINOVA V, BALACHANDAR R and BARRON R (2016) Turbulence intensity scaling in uniform and non-uniform smooth open channel flow. In: Proceedings of the Eighth International Conference on Fluvial Hydraulics - River Flow 2016, 12-15 July 2016, St. Louis, USA. [ Links ]
HELMI A and EL-GAMAL M (2011) Experimental and numerical investigations of flow through free double baffled gates, Water SA 37 (2) 245-254. http://dx.doi.org/10.4314/wsa.v37i2.65871 [ Links ]
HYDROVOLTS (2012) Case study: Roza canal. URL: http://hydrovolts.com/wp-content/uploads/2011/05/Hydrovolts-Roza-Case-Study1.pdf (Accessed 3 December 2013). [ Links ]
KHAN M, BHUYAN G, IQBAL M and QUAICOE J (2009) Hydrokinetic energy conversion systems and assessment of horizontal and vertical axis turbines for river and tidal applications: a technology status review. Appl. Energ. 86 (10) 1823-1835. doi:10.1016/j.apenergy.2009.02.017 [ Links ]
LUBITZ W, LYONS M and SIMMONS S (2014) Performance model of Archimedes screw hydro turbines with variable fill level. J. Hydraul. Eng. 140 (10) 1-11. http://dx.doi.org/10.1061/(ASCE)HY.1943-7900. [ Links ]
NAKAJIMA M, IIO S and IKEDA T (2008) Performance of double step Savonius rotor for environmentally friendly hydraulic turbine. J. Fluid Sci. Technol. 3 (3) 410-419. http://doi.org/10.1299/jfst.3.410 [ Links ]
NAKAJIMA M, IIO S and IKEDA T (2008) Performance of Savonius rotor for environment friendly hydraulic turbine. J. Fluid Sci. Technol. 3 (3) 420-429. http://doi.org/10.1299/jfst.3.420 [ Links ]
PETRILA T (2002) Mathematical model for the free surface flow under a sluice gate. Appl. Math. Comput. 125 (1) 49-58. doi: 10.1016/S0096-3003(00)00109-0 [ Links ]
RACHMAN A, BALAKA R, DELLY J and GUNAWAN Y (2013) Simulation on the effect of the blade number on the rotational characteristic on a horizontal axis river current turbine. Int. J. Energ. Environ. Eng. 4 (1) 1-32. doi: 10.1186/2251-6832-4-32 [ Links ]
RAJARATNAM N and SUBRAMANYA K (1967) Flow equation for the sluice gate. J. Hydraul. Div. 93 (3) 167-186. [ Links ]
ROBERT T (2007) Video analysis - A multimedia tool for homework and class assignments. In: Proc. 12th International Conference on Multimedia in Physics Teaching and Learning, 13-15 September 2007, Wroclaw, Poland. http://www.mptl12.ifd.uni.wroc.pl/papers/63.pdf [ Links ]
SONG T and CHIEW Y (2001) Turbulence measurement in nonuniform open channel flow using acoustic doppler velocimeter (ADV). J. Eng. Mech. 127 (3) 219-232. http://dx.doi.org/10.1061/(ASCE)0733-9399(2001)127:3(219) [ Links ]
SWAMEE P (1992) Sluice‐gate discharge equations. J. Irrig. Drain. Eng. 118 (1) 56-60. http://dx.doi.org/10.1061/(ASCE)0733-9437(1992)118:1(56). [ Links ]
WHITE F (2015) Fluid Mechanics (8th edn). McGraw Hill, Boston. 864 pp. [ Links ]
YAAKOB O, AHMED Y and ISMAIL M (2012) Validation study for Savonius vertical axis marine current turbine using CFD simulation. The 6th Asia-Pacific Workshop on Marine Hydrodynamics-APHydro2012, 3-4 September 2012, Johor, Malaysia. http://eprints.utm.my/36092/ [ Links ]
ZINGMAN O (2007) Optimization of a Savonius rotor vertical-axis wind turbine for use in water pumping systems in rural Honduras, BSc thesis, Department of Mechanical Engineering, MIT, USA. http://hdl.handle.net/1721.1/40927 [ Links ]
Received 6 June 2016
Accepted in revised form 25 August 2017
* To whom all correspondence should be addressed. +966-5458-59725; e-mail: mohamedelgamal@yahoo.com

