


Serviços Personalizados
Artigo
 Inglês (pdf)
 Artigo em XML
 Referências do artigo
Indicadores

Links relacionados
-
 Citado por Google
 -
 Similares em Google
Compartilhar

 Permalink
Water SA
versão On-line ISSN 1816-7950
versão impressa ISSN 0378-4738
Water SA vol.43 no.3 Pretoria Jul. 2017
http://dx.doi.org/10.4314/wsa.v43i3.17
Comparison of UV and ELS detectors in HSPEC analysis of natural organic matter in dam water
KG MoodleyI, *; P SobantuI; G GerickeII; DK ChettyI, †; DH PienaarI
IDepartment of Chemistry, Durban University of Technology, PO Box 1334, Durban, 4000, South Africa
IIEskom RT & D, Lower Germiston Road, Rosherville, Gauteng, South Africa
ABSTRACT
This project arose out the need for a simple method to analyse natural organic matter (NOM) on a routine basis. Water samples were obtained from the Vaal Dam. Analysis was preceded by separating the NOM into the humic and non-humic fractions. The humic portion was separated further into two fractions by employing a non-ionic DAX-8 resin to separate humic acid from fulvic acid. High-performance size-exclusion chromatography (HPSEC), equipped with a UV detector and an evaporative light scattering detector (ELSD) was used to obtain information on the molecular weight distribution and concentration levels of the two acids. Mixed standards of polyethylene oxide/glycol were employed for calibration. The molecular weight distributions (MWDs) of the isolated fractions of humic and fulvic acids were determined with ELSD detection as weight-average (Mw), number-average (Mn) and polydispersity (ρ) of individual NOM fractions. The Mw/Mn ratio was found to be less than 1.5 in all fractions, indicating that they have a low and narrow size fraction. It is noted that the ELSD detector proved to be far more capable than the UV detector. A finding of interest is that 40% of the total organic carbon in the dam water samples could be attributed to humic substances. The developed method successfully separated the humic substances from water and further separated the humic substances into the component acids, namely, humic and fulvic acids. Molecular weight distribution of these compounds is a powerful indication of how much DOM was present in the dam water. Even though the UV method was useful in characterizing these substances, the ELS detector is recommended because it detects all the organic species present.
Keywords: Natural organic matter, dam water, determination, ELSD
INTRODUCTION
The South African national power utility, Eskom, has the onerous task of generating and supplying electrical power to 9 provinces in South Africa and some neighbouring states. To this end, it has built a number of power stations, of which the majority are coal fired. The fleet also consists of a few pump storage systems, a limited number of hydropower systems and one nuclear power plant. High purity water is required for steam production to ensure material integrity and to eliminate or reduce the chances of corrosion initiated by salts and acidic impurities (Gruszkiewicz et al., 2001). One source of acidic impurities is natural organic matter; specifically, the humic and fulvic acid portions. This project therefore focused on developing a relatively simple method for the routine identification of pre-selected organic species present in the raw water. Specifically, UV and ELSD detectors were compared for their capabilities in the analysis of the targeted species by HPSEC.
Natural organic matter and its identification and quantification
Natural organic matter (NOM) is a heterogeneous mixture of organic compounds that enter the water media from animal and plant remains (Nkambule et al., 2009). The organic content of natural water can also be increased through domestic and industrial waste entering the water body. In addition to being cited as an agent in the corrosion of turbines (Engelhard and Macdonald, 2004), it has been shown (Bursill, 2001) that NOM is a likely precursor material for disinfection by-products (DBPs). In the light of the above, the water used in power stations is subjected to an array of purification procedures. Several steps are involved in the treatment of water for the removal of suspended and dissolved contaminants before it is suitable for use in the power plant steam cycle. These include coagulation and flocculation, filtration and ion exchange processes. In some cases, membrane processes such as ultra-filtration and reverse osmosis can also be used as alternatives. Where water is required as potable water, that water stream needs to be disinfected through, mainly, chlorination. However, major problems result from the reaction of NOM, in various ways, in the treatment processes.
These reactions may produce disinfection by-products (DBPs) (Yigit et al., 2009), many of which are classed (Richardson et al., 2007) as carcinogens or mutagens (Langvik and Holbom, 1994). It has been reported (Kanokkantapong et al., 2006) that a component of DBP, namely, haloacetic acid, gave rise to toxicological effects in laboratory animals. Aside from the harm caused by reaction products, NOM is undesirable in water on account of its propensity to foul membranes, exude a bad odour and impart an unpleasant taste to water. Thus, the removal of NOM from water (Treavorh and Singer, 2008) would constitute a much-needed service for the protection of human health and for the cost-effective execution of industrial processes. The removal methods need to be informed by the total amount of dissolved NOM and the distribution profile of the various NOM species. While the former needs separation and analysis techniques, the latter involves characterization of NOM. Numerous methods have been documented (Jeong et al., 2017; Sarkaaa et al., 2015; Matilainen et al., 2011; Kambule et al., 2011) for separation and analysis of NOM in water. Some separations were done by using a single resin as exemplified by the reports of Ibrahim et al. (2008) and Makela et al. (2007). Other groups, such as Nkambule et al. (2009) and Esteeves et al. (2007), used two types of resins to carry out the separations. Various detectors have been employed in the analysis of the separated species. However, there are no reports or references which compare the capabilities of UV and ELS as detectors connected in a series configuration. The only reference found in literature on the use of an ELS detector which was relevant to this study refers to the use of ELS for detecting 'humic-like substance in aerosols' (Emmenger et al., 2007).
In addition to data from the fractionation experiments, information provided by studies on characterization (Matilainen et al., 2011) is useful in providing a profile of the species of NOM present in a specific water source or water body. To achieve this, total organic carbon (TOC), dissolved organic carbon (DOC) and Fourier transform infra-red spectra (FTIR) data were also obtained.
MATERIALS AND METHODS
Polymeric Superlite DAX-8 resin was obtained from Supelco. Sodium hydroxide pellets, 65% hydrochloric acid, methanol (HPLC grade), polyethylene glycol/polyethylene oxide calibration standards and ethanol (95%) were obtained from Fluka. Analytical reagent (AR) grade disodium hydrogen phosphate was supplied by Saarchem and methanol (LiChrosolv) was obtained from Merck, Darmstadt, Germany. Suwanee River humic acid ll (2S101H) was sourced from the International Humic Substances Society. Technical grade humic acid and technical grade fulvic acids were both purchased from Sigma Aldrich. Nylon membrane filters (0.45 μm and 0.2 μm), syringes (2 mL) and disposable micropipette tips were obtained from Waters.
The HPLC instrument system comprised of a Binary LC pump 250 (Perkin Elmer, Massachusetts, USA), a UV detector (LC 235 Diode array, Perkin Elmer Massachusetts USA) and a Binary LC pump 250 (Perkin Elmer Massachusetts USA), an evaporating light scattering detector (Sedex 75, Sedex France). The loop used for injecting standards and samples was the Rheodyne 7010 injector equipped with a 20 μL sample loop (California, USA). The column used was the Polysep-GFC-P linear column (Sigma Aldrich, 300 x 780 mm Canada, USA) and Polysep-GFC-P guard column, sigma Aldrich, 35 × 7.8 mm Canada, USA). Water (18 MΩ) was taken from a Purite Ultra-pure Water System. A glass column (30 cm length, 1 cm internal diameter) was used for preparing the resin column. The degassing and filtration apparatus used was purchased from Membrane Solutions (Ohio, USA). A Snijders hotplate cum magnetic stirrer was employed.
Sampling
Grab samples were taken from the Vaal Dam in 1 L Schott bottles, which were subsequently stored under refrigeration at 4°C for not more than 48 h before analysis. The Vaal Dam water samples were filtered through a 0.45 µm membrane filter, prior to analysis, to eliminate any particulate matter. Samples were stored in the dark to prevent interaction with light.
Preparing and applying the resin column
Resin wetting
This was done according to the supplier's (Sigma Aldrich) recommendation. The dry resin was transferred into a 500 mL beaker. Sufficient methanol was added to cover the resin bed to a depth of 2-5 cm. The resin was stirred gently for a minute to ensure complete mixing. It was then allowed to stand for 15 min. Most of the methanol was carefully decanted and replaced with de-ionized water. The mixture was stirred and allowed to stand for 5-10 min.
Column preparation and equilibration
A water supply hose was attached to the bottom of a chromatographic column. A slow upward flow of de-ionized water was introduced. The flow was increased until the entire resin bed was suspended and maintained until all the air bubbles were dislodged. Resin fines were allowed to wash out from the top of the column. The flow was stopped and the resin allowed to bed in the column. The water level was then adjusted to 2.5 cm above the resin bed. The cleaned resin was slurry packed into a 1 cm x 30 cm glass column to give an 8 cm sorbent bed. The resin was rinsed with ultra-pure water.
Sorption
Pre-filtered water samples (50 mL) were adjusted to pH 2 and passed through the resin column at a flow rate of 2 mL·min−1. The column effluent was collected and acidified to pH 2 and labelled as a non-humic substances (NHS) portion. The carbon dioxide (CO2) was removed from this effluent by purging with nitrogen for 10 min.
The adsorbed humic substances were eluted with 30 mL 0.1 M sodium hydroxide (NaOH) at a flow rate of 1 mL·min−1. This eluate was acidified to pH 2 and labelled as humic substances (HS). The CO2 present in this eluate was removed as described above. This eluate was re-concentrated on a smaller XAD-8 column and eluted with NaOH (0.1 M) and then acidified with dilute HCl.
Fractionation of NOM into humic acid and fulvic acid fractions
A portion of the humic substances eluate sample was acidified to pH 1 with 0.1 M hydrochloric acid and left in the dark for 24 h to precipitate any possible humic acid. The precipitated humic acid and the supernatant fulvic acid (FA) solution were separated by filtration through a 0.45 µm membrane filter. Any CO2 trapped in the supernatant liquid was removed through purging and the resulting solution was assumed to be FA and the solution was marked as such. Procedural blanks and standard reference materials (Suwanee River humic acid) were analysed with each batch of samples. Suwanee River humic acid was used as a control sample. The separated fractions were analysed by high performance size exclusion chromatography (HPSEC) using evaporative light scattering/ultraviolet (ELSD/UV) detectors connected in series.
Fractionation of the NOM compounds
Figure 1 shows the steps used in the fractionation experiment and the fractions

RESULTS AND DISCUSSION
Determination of molecular weights of the different NOM fractions
The following steps were utilized in quantifying and characterizing the components present in the isolated fractions:
•Determination of column efficiency (number of theoretical plates)
•Calibration of the column
•Construction of a calibration curve for molecular weight determinations
•Limits of detection (LOD) and quantification (LOQ).
•Characterizations to support the quantitative determinations
Column efficiency
The HPSEC (Polysep - GFC-P Linear) column was first tested for efficiency (represented by the number of theoretical plates), using a 100 mg·L−1 ethylene glycol standard. The column efficiency was calculated as follows:

where: N is the number of theoretical plates, tr is retention time and W is peak width.
Separation of standards on a chromatographic column
Mixed standards of polyethylene oxide/polyethylene glycol (PEO/PEG) were separated on a Polysep-GFC column. The concentration of each standard in the mixture was 1 500 mg·L−1. To cover a fairly wide range of molecular weights in the calibration standard, three sets of mixed standards at different concentrations were used. The chromatogram in Fig. 2 shows the separation obtained for one such mixed standard comprising 4 components.

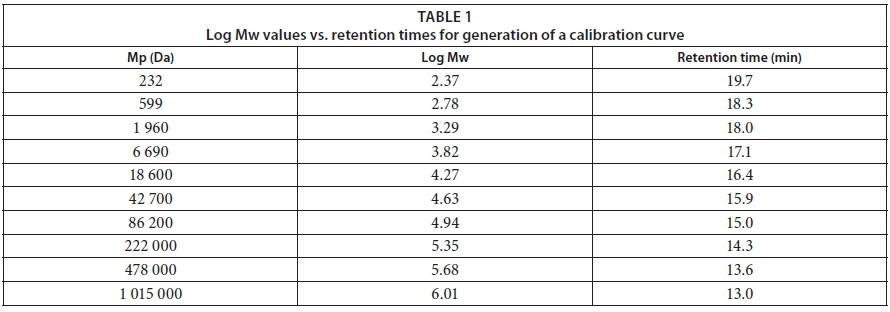
Construction of a calibration curve for molecular weight determinations
The retention times from the chromatograms, such as that shown in Fig. 2 and the molecular weights corresponding to retention times used to derive the data are shown in Table 1.
A plot log (MW) versus retention time yielded a straight line as shown in Fig. 3.
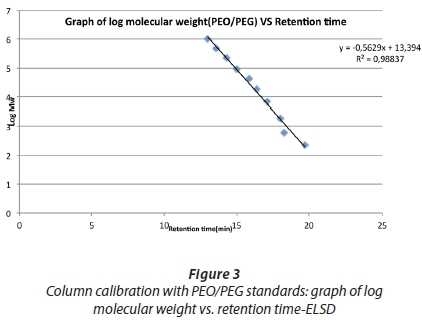
As can be seen from Fig. 3, excellent linearity was obtained with the PEO/PEG standards.
Limits of detection and quantification
The limit of detection is the point at which the analysis is just feasible while the limit of quantification is the concentration at which results can be reported with a high degree of confidence. These were calculated using the signal to noise method where a signal to noise ratio of 3 and 10 are acceptable for the LOD and for LOQ, respectively. The latter were determined for both humic acid and fulvic acid.
Determination of TOC and DOC
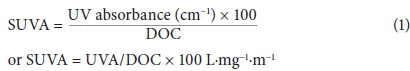
The determination of the concentrations of humic and fulvic acids, using size-exclusion chromatography as described above, can be supported by analysis for total organic carbon (TOC) and dissolved organic carbon (DOC). In addition, UV absorbance measurements were done to determine SUVA (specific ultraviolet absorption) values, as shown in Table 2.

Table 2 shows the results of the TOC and DOC measurements of the water samples taken from the Vaal Dam. The samples showed high absorbance, indicating a high concentration of organics in the water. The strong absorbance shown by these humic substances in the UV region is due to the presence of aromatic chromophores and/or other organic compounds (Chen et al, 2002). These results confirmed the presence of humic substances in the Vaal Dam. SUVA is calculated by dividing the UV absorbance of a sample (cm-1) at 254 by the DOC value (mg·L−1) and then multiplying by 100 (Nkambule, 2009). It is an indication of the aromaticity of the humic fraction. Any values above 4 are said to represent a high aromatic content (humic substances), while values below 2 have a low aromatic content (non-humic substances). Dissolved organic carbon (DOC) and total organic carbon (TOC) were 5.38 mg·L−1 and 6.23 mg·L−1, respectively.
Results obtained from the UV analysis together with the DOC and TOC results were then used to calculate SUVA according to Eq. 1. The UV 254 absorbance and SUVA 254 values of the two examined NOM fractions (Table 3) are all above 4 L·mg−1·m−1, confirming the high aromatic content of the complex and high molecular weight.
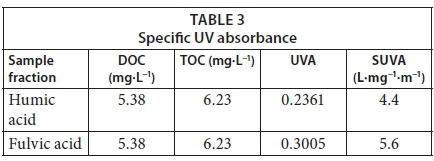
High SUVA values indicate the presence of humic substances, while low SUVA values indicate the presence of organic matter which is measurable by DOC and TOC but does not impact colour or absorb UV light. The SUVA values obtained here are in the range reported by other researchers (Yan et al., 2011).
ELS detector results
The size exclusion technique is based on molecules in solution being separated by their size, and in some cases molecular sizes. The principle of SEC is that particles of different sizes will elute through a stationary phase at different rates. This phenomenon was observed with the PEO/PEG standards and is shown in Figs 4 and 5. There is a limited range of molecular weights that can be separated by each column and therefore the size of the pores for the packing should be chosen according to the range of molecular weights of the analytes to be separated.
The exclusion limit defines the molecular weight at the upper end of the column. The exclusion limit of the polysep-gfc column is 10 000 000 Da. None of the peaks appeared near the exclusion limit or near the permeation limit. All the molecular weights were distributed throughout the curve. The graph shows that these standards fall on one calibration curve.
Analysis for humic acid
The UV detector was set at 2 wavelengths, 254 nm and 280 nm. This was done to accommodate relatively small molecular sizes and also to detect the MWD of low molecular weight NOM fractions due to their relatively higher absorptivity at a lower wavelength. This is consistent with the observation of Swietlik et al. (2005). SEC chromatograms of the humic acid fraction by the ELS detector, UV detector at 254 nm and 280 nm have been shown in Figs 6, 7 and 8, respectively. The molecular weight distributions of these fractions are presented in Table 4.


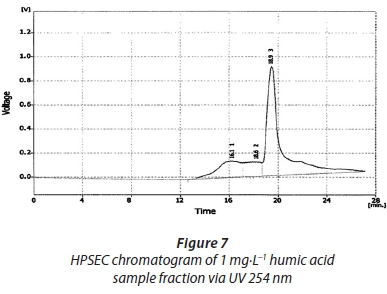

The range of distribution is between 7 000 Da and 13 000 Da. However, the present study's results were not easy to rationalize because the column covers a very wide range of molecular weights that are not necessarily at the lower range size of molecular weights as one would expect for humic acids. Comparing the SEC chromatograms of these is not a good idea due to the fact that the UV detector is known to only detect conjugated double bonds and chromophores, as stated above. This was done here because the operating conditions (mobile phase and flow rate) were not too different since these were connected in series. The same scenario that was observed with the Sigma Aldrich humic acid standards is observed here, i.e., the high absorption seen at lower wavelengths and greater peak heights noted with the ELS detector compared to the UV detector.
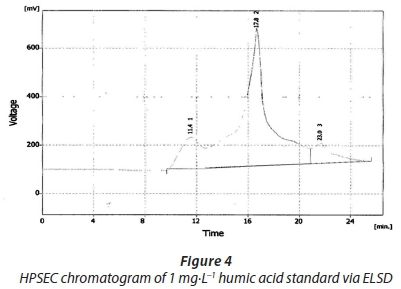
As shown by the chromatograms (Figs. 4-7), differences can be noted as follows:
•For the 1 mg·L−1 humic acid standard, the retention time is 17.8 min via ELSD, 18.5 min via UV 254 nm and 18.9 min via UV 280 nm.
•It is also noted that the peak height recorded using the ELSD is slightly higher than that of the UV detector. This is expected, given that the ELSD is nearly a universal detector and that it detects analytes which remain after the solvent has evaporated. The UV detector will only detect UV active species (conjugated double bonds and aromatic structures). Hence there are molecular weight fractions that will be undetected by the UV detector.
•Also, there is a difference in the heights of the two UV chromatograms, the 254 nm and the 280 nm. The 254 nm is showing a greater peak height, showing more absorption at a lower wavelength, compared to the UV 280 nm. This is consistent with Beer's law and the observation of Bertilsson et al. (2000). The molecular weights of these were determined from the calibration graph with PEO/PEG standards. The molecular weights were determined in the same way as for the UV detection, i.e., by calculations done from the calibration plot of log molecular weight vs retention time.
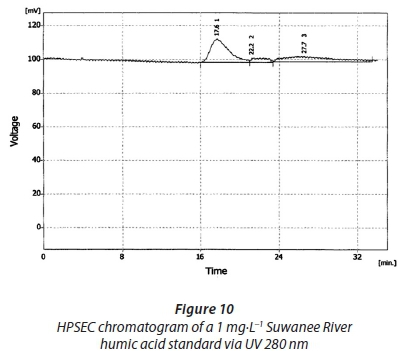
Chromatograms of the Suwanee River humic acid reference material characterized by HPSEC via the UV detector at 254 nm and UV 280 nm are displayed in Figs 9 and 10, respectively. All chromatograms share similar characteristics in terms of retention time, at between 16 and 18 min. The chromatograms obtained here were slightly similar to those obtained by Her et al. (2000). The molecular weight values obtained for these are consistent with most of the values reported before, even though humic substances are known to have an extremely variable range of molecular weights, from hundreds to millions of daltons (Carson, 2008). These calculated values are shown in Table 5. The peaks of these are also different in that, in some cases, more than one peak was detected, but this was in agreement with the report of Carson. The challenge with this reference material was obtaining a HPSEC chromatogram from the Humic Substances Society.


Fulvic acid analysis
The HPSEC chromatograms for 1 mg·L−1 fulvic acid for standards and fractions are shown in Figs 11-16.


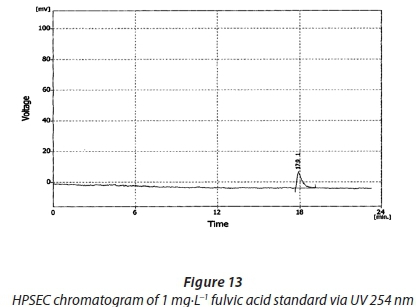
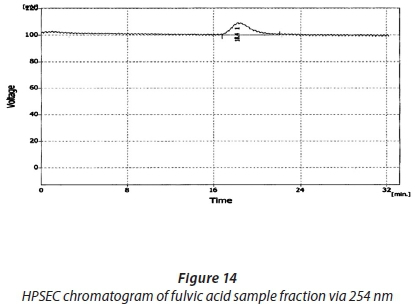


Comparing the SEC chromatograms of the 1 mg·L−1 fulvic acid standards with the UV 254 nm, UV 280 nm and the ELSD, the peak with the ELS detector eluted slightly later than those of the UV detector and has a noticeably greater height compared to the UV detector one. Another notable difference is the lower peak height in the UV 280 nm chromatogram compared to the 254 nm, showing less UV absorption at higher wavelengths, as was seen in the humic acid standards and sample fractions. The molecular weights of the Sigma Aldrich FA by ELSD, UV 254 nm and UV 280 nm are 199 Da, 2 041 Da and 2 041 Da, respectively. These are presented in Table 5. The distribution range that has been reported is from a few 1 000 to about 20 000. These results are similar to those obtained by Carson in that the molecular weights of fulvic acids are known to be slightly lower than those of humic acids, and this was observed here.
There was not much difference in the retention times obtained for these fractions by the ELS and the UV detectors. The same differences that were noted with the humic acid fractions were observed here. The consistency of the fulvic acid molecular weights being generally lower compared to the humic acids was also observed here. PEO standards generally have MW values above those of humic substances. The calibration graph can be used to estimate the molecular sizes of humic and fulvic acid. Standards in the molecular weight region of these humic substances could improve the calibration and hence give a better understanding of their size distribution. In this study, whilst most of the molecular weights were within the calibration range, there were some that were below the molecular weight range of the calibration standards. The results for the fulvic acid fractions presented in Table 5.
Significance of the use of the ELS detector in determining molecular weights of humic substances
One of the objectives of this study was to develop a size exclusion method that employs the ELS detector;one of the reasons being that the Eskom utility that this project was undertaken for has this type of a detector, another reason being that this type of a detector is more like a universal detector. Basically all compounds which are less volatile than the mobile phase can be detected. Detection is based on a universal property of all analytes and does not require the presence of any chromophoric group or electroactive group. Unlike the UV detector that will detect only UV active species, it will detect molecules with almost all functional groups.
Although the aromatic portion may appear to be dominant in the humic substances' structures, the non-aromatics may form a significant portion of regulated disinfection byproducts and contribute to poor water quality. Hence it is important to utilize a detector that will not only detect aromatic double bonds or chromophores. All results show that increased resolution was obtained when using the evaporative light scattering detector, as opposed to the UV detector. In all the sample fractions, the peak height obtained by the ELS detector was significantly higher than peaks obtained by the UV detector, denoting that a large number of functional groups was being detected.
CONCLUSIONS
Fractionation method
The isolation method based on a non-ionic polymeric sorbent (DAX-8) proved to be both suitable and reliable for dam water samples. The developed method successfully separated the humic substances from water and further separated the humic substances into the component acids, namely, hydrophobic, humic and fulvic acids. The easy isolation of the humic substances from the non-humic substances in water also shows the high retaining capacity of the DAX-8 resin used. The methods developed are simple, cost effective and accurate for use by industry and water utilities.
The fractionation scheme applied in this study would also allow for the quantification of the humic substances, but quantification was done by the UV method since some of the concentrations of the samples fell outside the calibration range of the PEO-PEG standards.
UV and ELS detection methods in HPSEC analysis of DOMs
By using the HPSEC column with water as an eluent, MWD values could be obtained. HPSEC is a good technique for MWD determination, especially when equipped with UV-Vis and ELSD detection. The molecular weight distribution of these compounds is a powerful indication of how much DOM was present in the dam water. HPSEC with UV and ELSD methods was able to identify the molecular weight distribution of NOM present in source water. Humic and fulvic acids are the natural high-molecular-weight hydrophobic acids which were separated into two fractions. In addition, NOM can cause problems of membrane fouling and aesthetically displeasing flavour. NOM has even been implicated in the corrosion of turbines and engineering systems.
Even though the UV method was useful in characterizing these substances, the ELS detector is recommended because it detects all the organic species present. The difference in the results between the UV and ELS detector means that there are materials which are undetected by the UV detector, as expected. We should rather include the ratio of humic to TOC/DOC, fulvic to DOC/TOC and humic/fulvic.
The overall conclusion is that the methods, used for the fractionation and the characterization of the dissolved organic matter (DOM) were suitable and effective for this study.
ACKNOWLEDGEMENTS
Eskom TESP Programme and Durban University of Technology for financial support and Ms Devrani Naicker for technical assistance.
REFERENCES
BERTILSSON S and TRANVIK LJ (2000) Photochemical transformation of dissolved organic matter in lakes. J. Limnol. Oceanogr. 45 (4) 753-762. https://doi.org/10.4319/lo.2000.45.4.0753 [ Links ]
BOYER TH and SINGER PC (2008) Stoichiometry of removal of natural organic matter by ion exchange. Environ. Sci. Technol. 4 608-613. https://doi.org/10.1021/es071940n [ Links ]
BURSILL D (2001) NOM - natural organic matter's effect on water treatment: drinking water treatment - understanding the processes and meeting the challenges. Water Sci. Technol. Water Supply. 1 (1) 1-7. [ Links ]
CARSON KE (2008) Characterization natural organic material in Alaskan surface waters. MSc dissertation, University of Alaska, Anchorage. [ Links ]
CHEN J, GU B, LeBOUF EJ, PAN H and DAI S (2002) Spectroscopic characterization of the structural and functional properties of natural organic matter fractions. Chemosphere 48 59-68. https://doi.org/10.1016/S0045-6535(02)00041-3 [ Links ]
EMMENEGER C, REINHARDT A, HUEGLIN C, ZENOBI R and KALBERER M (2007) Evaporative light scattering: a novel detective method for the quantitative analysis of humic-like substances in aerosols. Environ. Sci. Technol. 41 2473-2478. https://doi.org/10.1021/es061095t [ Links ]
ENGELHARDT G and MACDONALD DD (2004) Unification of the deterministic and statistical approaches for predicting localized corrosion damage. Corrosion Sci. 46 (11) 2755-2780. https://doi.org/10.1016/j.corsci.2004.03.014 [ Links ]
ESTEEVES VI, OTERO M, SANTOS EBH and DUARTE CA (2007) Stable carbon isotope ratios of tandem fractionated humic substances from different water bodies. Organic Geochem. 38 (6) 957-966. https://doi.org/10.1016/j.orggeochem.2007.02.006 [ Links ]
GRUSZKIEWICZ M, JOYCE DB, MARSHALL S, PALMER DA and SIMONSOM JM (2001) The partitioning of acetate, formate and phospahtes around water/steam cycles. Power Plant Chem. (3) 575-582. [ Links ]
HER N, AMY G, FOSS D, WEONCHO J, YOON Y and KOSENK P (2002) Optimization of method for detecting and characterizing NOM by HPLC-size exclusion chromatography with UV and on-line DOC detection. Environ. Sci. Technol. 36 1069-1076. https://doi.org/10.1021/es015505j [ Links ]
IBRAHIM MBM, MOURSY AS, BEDAIR AH and RADWAN EK (2008) Comparison of DAX-8 and DEAE for isolation of humic substances from surface water. J. Environ. Sci. 2 90-96. https://doi.org/10.3923/jest.2008.90.96 [ Links ]
KANOKKANTAPONG V, MARHABA, TF, PAVASANT P and PANYAPINYOPHOL B (2006) Characterization of haloacetic acid precursors in source water. J. Environ. Manag. 80 214-221. https://doi.org/10.1016/j.jenvman.2005.09.006 [ Links ]
LANGVIK VA and HOLBOM (1994) Formation of mutagenic organic by-products and AOX by chlorination of fractions of humic water. Water Res. 28 553. https://doi.org/10.1016/0043-1354(94)90006-X [ Links ]
MÄKELÄ J and MANNINEN P (2007) Humic and fulvic acids in groundwater. Earth Sci. Miscellaneous Papers 23 245-252. [ Links ]
MATILAINEN A, GJESSING ET, LAHTINEN T, BHATNAGAR A and SILLANPAA A (2011) An overview of the methods used in the characterisation of natural organic matter (NOM) in relation to drinking water treatment. Chemosphere 83 (11) 1431-1442. https://doi.org/10.1016/j.chemosphere.2011.01.018 [ Links ]
NKAMBULE TI (2009) An analytical approach to the characterization and removal of natural organic matter from water using ozone and cyclodextrin polyurethanes. MSc thesis, University of Johannesburg, South Africa. [ Links ]
NKAMBULE TI, KRAUSE EWM, MAMBA B and HAARHOFF J (2009) Characterization of natural organic matter (NOM) and its removal using cyclodextrin polyurethanes. Water SA 35 (2) 200-203. https://doi.org/10.1016/j.pce.2011.07.006 [ Links ]
NKAMBULE TI, KRAUSE EWM, HAARHOFF J and MAMBA BB (2011) Treatability and characterization of natural organic matter (NOM) in South African waters using newly developed methods. Phys. Chem. Earth 36 1159-1166. [ Links ]
RICHARDSON SD, PLEWA, MJ, WAGNER ED, SCHOENY R and DEMARINI DM (2007) Occurrence, genototicity and carcinogenicity of regulated and emerging disinfection by-products in drinking water, a review and roadmap for research. Mutation Res. 636 178-242. https://doi.org/10.1016/j.mrrev.2007.09.001 [ Links ]
SARKKA H, VEPSALAINEN M and SILLANPAA M (2015) Natural organic matter (NOM) removal by electrochemical methods. J. Electroanal. Chem. 755 100-108. https://doi.org/10.1016/j.jelechem.2015.07.029 [ Links ]
ŚWIETLIK J and SIKORSKA E (2005) Characterization of Natural Organic Matter Fractions by High Pressure Size-Exclusion Chromatography, Specific UV Absorbance and Total Luminescence Spectroscopy. Pol. J. Environ. Stud. 15 (1) 145-153. [ Links ]
YAN M, KORSHIN G and WANG D (2011) Characterize natural organic matter in typical China's water using HPLC-SEC with continuous wavelength UV absorbance detector. Speciality Conference on Natural Organic Matter, Costa Mesa, CA, 27-29 July 2011. [ Links ]
YIGIT Z, INAN H, SEYDIOGLU G and UYAK V (2009) Enhanced coagulation of disinfection by-products precursors in Porsuk water resource. Int. J. Environ. Chem. Ecol. Geol. Geophys. Eng. 3 (6) 175-179. [ Links ]
Received 14 June 2016
Accepted in revised form 10 July 2017
* To whom all correspondence should be addressed: e -mail: moodlykg@dut.ac.za
† Deceased 8 April 2016

