


Services on Demand
Article
 English (pdf)
 Article in xml format
 Article references
Indicators

Related links
-
 Cited by Google
 -
 Similars in Google
Share

 Permalink
Water SA
On-line version ISSN 1816-7950
Print version ISSN 0378-4738
Water SA vol.43 n.3 Pretoria Jul. 2017
http://dx.doi.org/10.4314/wsa.v43i3.10
Impacts of DEM resolution and area threshold value uncertainty on the drainage network derived using SWAT
Miao WuI; Peng ShiI,*; Ang Chen II, III, *, †; Chen ShenIII; Pengyuan WangII
ICollege of Hydrology and Water Resources, Hohai University, 210098, Nanjing, China
IIInstitute of Hydropower and Environment Research, China Three Gorges Corporation, 100012, Beijing, China
IIISchool of Civil Engineering, Tsinghua University, 100084, Beijing, China
ABSTRACT
Many hydrological algorithms have been developed to automatically extract drainage networks from DEM, and the D8 algorithm is widely used worldwide to delineate drainage networks and catchments. The simulation accuracy of the SWAT model depends on characteristics of the watershed, and previous studies of DEM resolution and its impacts on drainage network extraction have not generally considered the effects of resolution and threshold value on uncertainty. In order to assess the influence of different DEM resolutions and drainage threshold values on drainage network extraction using the SWAT model, 10 basic watershed regions in China were chosen as case studies to analyse the relationship between extracted watershed parameters and the threshold value. SRTM DEM data at 3 different resolutions were used in this study, and regression analysis for DEM resolution, threshold value and extraction effects was done. The results show that DEM resolution influences the selected flow accumulation threshold value; the suitable flow accumulation threshold value increases as the DEM resolution increases, and shows greater variability for basins with lower drainage densities. The link between drainage area threshold value and stream network extraction results was also examined, and showed a variation trend of power function y = axb between the sub-basin counts and threshold value, i.e., the maximum reach length increases while the threshold value increases, and the minimum reach length shows no relation with the threshold value. The stream network extraction resulting from a 250 m DEM resolution and a 50 000 ha threshold value was similar to the real stream network. The drainage network density and the threshold value also shows a trend of power function y = axb; the value of b is usually 0.5.
Keywords: SWAT, digital elevation model (DEM), watershed delineation, threshold value
INTRODUCTION
Drainage networks are important characteristics of watershed systems and are a fundamental part of building a hydrological model. With the development of computers, drainage networks are now generally and directly extracted from the digital elevation model (DEM) (Shen et al., 2013). Due to the fact that DEM includes abundant information regarding the topography and geomorphology, it is widely used in hydrological and geomorphological fields, with the advancement of digital watershed modelling and relevant technologies (Bahadur, 2009; Li et al., 2013). In hydrology, DEM is mainly used for hydrological characteristic extraction and hydrological process modelling. The uncertainties of DEM and the extraction algorithm are the main factors which influence the hydrological characteristic extraction results. The scale effect of DEM is an important factor that influences the hydrological process simulation results. The uncertainties of DEM stem mainly from the uncertainty of the data and the uncertainty of the modelling method. Global DEM data which are currently available, such as GTOPO30, SRTM DEM, ASTER GDEM and World DEM, are the basis of the wide application of DEM (Ang et al., 2016; Ang et al., 2017). The constraint of the uncertainty of DEM data and the results of this on its application are gradually being eliminated by studies on the application suitability of DEM data from different sources in different regions (Athmania and Achour, 2014; Suwandana et al., 2012). When topographic patterns are extracted from DEM, due to the influence of different designed extraction algorithms on the extraction results, the D8 algorithm becomes a practical algorithm. The D8 algorithm has been widely applied and is used in most of the available software, based on which different improvements have been made (Li and Yang, 2004; Liu et al., 2006). This includes scale effects of horizontal resolution and vertical resolution; with the scale effect of horizontal resolution being the focus of this study, including the relation between the horizontal resolution of DEM and topographic attributes, catchment runoff and sediment yield in watersheds. No theory has been developed regarding the scale effect of vertical resolution. Although some scholars have addressed the issue of morphology accuracy based on the topography, the over-pursuit of computational accuracy may render the topography results meaningless. Therefore, further study is needed in watersheds at different altitudes for comparative analysis.
The SWAT model is a semi-distributed hydrological model which is widely applied at present. Its main input data include DEM, land use, soil and meteorology data, among which DEM data are the basis of modelling. The digital drainage network of a watershed is extracted through depression processing and computation of flow direction and flow accumulation from DEM. With the continuous development of the SWAT model, a mature processing method has been developed (Chaubey et al., 2005; Geza and McCray, 2008). When hydrological process modelling is conducted in the SWAT model, DEM resolution also influences the extraction and simulation results of the watershed parameters, and DEM resolution has a different influence on parameters such as the watershed area, total reach length, maximum reach length and drainage density at different watershed scales (Chaubey et al., 2005). The DEM data include abundant landform information as well as the hydrological parameters of the SWAT hydrological model. These parameters are the basis of hydrological modelling. Watershed boundary, drainage networks, sub-basin boundary, sub-basin export and main export of the watershed are generated according to the input DEM data. The DEM data resolution influences not only slope and reach length, but modelling time. Chaplot et al. (2005) have studied the influence of DEM resolution in the range of 20-500 m on runoff and sediment. The results showed that DEM data with 50 m resolution are suitable for simulation of the study area (Chaplot, 2005). Numerous scholars have analysed the influence of DEM data with different resolutions (in the range of 20 to 2 000 m) and the watershed subdivision method on simulation results of the SWAT model. They found that the influence of watershed subdivision method on the simulation results is also related to the resolution: the sub-basin count generated from DEM with a resolution of more than 300 m decreases as the resolution decreases, and the maximum relative deviation of the simulation results involving different counts of sub-basins is no more than 5%. The change in DEM resolution and watershed subdivision method have a less significant influence on the simulation results, and the relative deviation of simulation results generated from DEM with 100 m spatial resolution is less than 1%. The SWAT model has been extensively applied in numerous countries, and especially the United States. There have been many studies regarding the selection of an appropriate resolution for different watershed studies. Previous studies have shown that a DEM resolution between 100 and 300 m is generally suitable for studies of large watersheds; for smaller study areas, e.g., less than 100 km2, a DEM with high resolution is generally used to obtain a better simulation result (Szcześniak and Piniewski, 2015). At present, the application of SWAT in China is not yet mature; there are few study results available for the selection of appropriate DEM resolution and determination of appropriate drainage area threshold value and no universal methods have been developed.
The automatic extraction of a drainage network by setting an appropriate drainage area threshold value based on DEM data is a universal extraction method for drainage networks that is used at present. The drainage network extracted can be compared with the real drainage network to verify its accuracy (Lin et al., 2006). The drainage area threshold value is the minimum drainage area necessary to maintain the permanent existence of rivers, and is used to determine statistical characteristics such as drainage density and morphology. In addition, it has a direct influence on the distribution and concentration of slope and drainage networks, and is more sensitive to the peak flow of the basin and flood duration. Studies show that during the extraction of drainage networks, different drainage networks will be obtained when different drainage area threshold values are selected. The extracted drainage networks are sparse when the drainage area threshold value is large, and vice versa. For this reason, the drainage area threshold value determines how well the simulated drainage network fits the real drainage network. The drainage area threshold value not only influences the extraction of drainage networks, but also indirectly influences the simulation resulting from the SWAT model. Setting appropriate threshold values is an important step for extraction of drainage networks from DEM, and mainly influences the topological relation and geometric characteristic of drainage networks. With the increase in depth and detail of watershed studies, extraction and determination of drainage networks at different levels of detail is required. However, it is difficult to extract real drainage networks for many low-level rivers or high-level tributaries. Therefore, this study focuses on watershed hydrological modelling to select suitable methods to extract drainage networks of low-level rivers. As a semi-distributed hydrological model based on physical mechanisms, SWAT has the advantages of high computational efficiency, high visualization and convenient management of data, and plays an important role in extracting drainage networks of low-level rivers. The drainage network extraction results depend on DEM resolution. Better simulation results are obtained by setting different threshold values when the drainage networks are extracted in the SWAT model at different DEM resolutions. However, few studies have been published on drainage area threshold values and the SWAT model, mainly because this model has its own drainage network extraction procedures, which provides the range and recommended value for drainage area threshold value and renders the extraction of drainage networks in the modelling process more convenient (Hou et al., 2011). However, there has been no quantitative research on the effect of changing the drainage area threshold value on the drainage network extraction results. The variables' correlation has not been further studied, and there are few studies on the relation between the maximum and minimum reach length.
In order to study the applicability of different DEM data in different watersheds and regions of China and to determine the appropriate drainage area threshold value when extracting the drainage network in different regions, we choose 10 primary regions as case studies according to the distribution of watershed regions in China. The SWAT model and spatial analysis function of a geographic information system were used to comparatively study the difference in watershed extraction from DEM data at different scales, such as 250 m, 500 m and 1 km, and under different drainage area threshold values, and to study the change rule for the extraction results for watershed characteristics under different drainage area threshold values. This was done to enable determination of the optimal drainage area threshold value when extracting the drainage network in different regions, to provide a reference basis for the application of the SWAT model in China, selection of DEM data in different regions and the setting of drainage area threshold value for hydrological process modelling.
MATERIALS AND METHODS
Study area
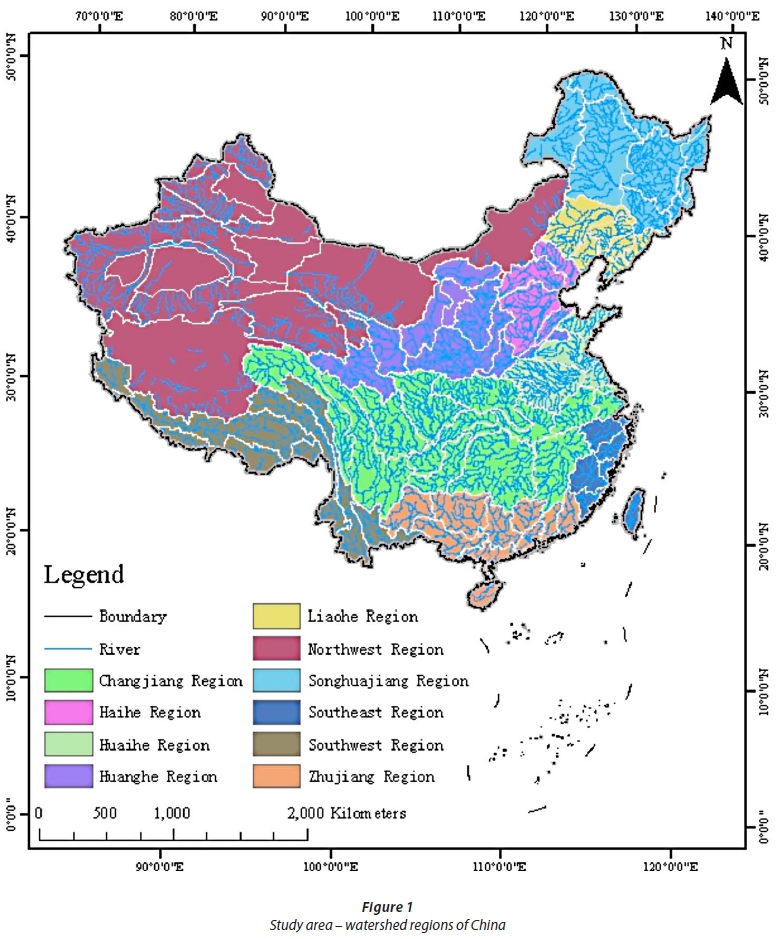
The study area included 10 watershed regions of China, with a total area of 9.6 million km2. 10 primary regions were selected from these 10 watershed regions to extract the watershed characteristics in the SWAT model. Level 1-5 river data are selected from the national fundamental geographic information system as the real stream data (Figure 1).
The primary regions used are shown in Table 1. The area of the Northwest Region is 3.3571 million km2 and is the largest with the most secondary regions, at 14; while the area of the Southeast Region is 238 700 km2, making it the smallest; in the Haihe Region, the secondary regions are the fewest, at 4.

Data processing
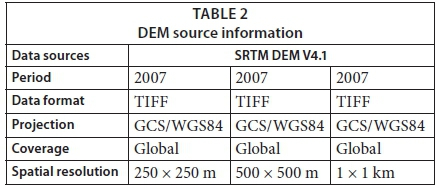
ArcGIS Desktop, provided by the Environmental Systems Research Institute (ESRI), was used for the basic data processing. The data were obtained from SRTM DEM V4.1 (Shuttle Radar Topography Mission). These data were first released in 2003, and the latest version is V4.1, after many revisions (Reuter et al., 2007). In this study, we chose DEM data at three resolutions, i.e., 250 × 250 m, 500 × 500 m and 1 × 1 km. The parameters of the different DEM data are as shown in Table 2, and the partition information of the study area is as shown in Table 3.
Stream network extraction
As yet, there is no simple and reasonable method to determine the drainage area threshold value. The disadvantages of extraction from DEM for the SWAT model influence the determination of the drainage area threshold value. Since no quantitative relationship between the drainage area threshold value and drainage network extraction results has been derived, some uncertainties are brought to the hydrological modelling in the SWAT model. This paper aims to build a regression relation between the drainage area threshold value and extraction results of the watershed characteristics. The coefficient of determination (R2) is selected to assess the fit of the regression equation; a higher R2 would indicate that the observed value is closer to the fitted value.

The drainage network was extracted from DEM in the SWAT model and the parameters of sub-basin counts, maximum and minimum reach length and total length, which are generated under different threshold values were computed in ArcGIS based on the SWAT model. A drainage area threshold value was assumed, and all grids with drainage area greater than this threshold value became the unit of the drainage network. The drainage network of the watershed is formed after such grid unit is connected. The D8 algorithm is a widely applied algorithm. In the D8 algorithm, the flow direction of the grid is determined by comparing this grid with the slope of the nearest 8 grids. The linear direction from the centre of the selected grid to the centre of the grid unit with the largest slope among the nearest 8 grids is defined as the flow direction of the processed grid. The flow direction of a grid is expressed with a feature code (Ariza-Villaverde et al., 2013; Dombradi et al., 2007). The effective flow directions are northeast, east, southeast, south, southwest, west, northwest and north, which are expressed respectively with 8 effective feature codes, of 128, 1, 2, 4, 8, 16, 32 and 64 (Fig. 2).

The drainage density refers to the ratio of the total reach length of the main stream and tributaries to the watershed area. Since the drainage density method is not sensitive to changes in the watershed area, and the data required by the drainage density method can be obtained quickly from the SWAT model, the drainage density method was used to determine the appropriate drainage area threshold value:

where: D refers to the drainage density in km-1, Li refers to the length of a section of river in km, and A refers to the watershed area in km2. A trial-and-error method is used to determine the actual drainage area threshold value of the watersheds based on the drainage density of the real drainage network, so as to obtain the digital drainage network.
According to the computation results, we analysed the difference between the extraction results from different DEM and at different threshold values, the difference between the extraction results and actual results, and the relation between the extraction results of watershed counts, the maximum reach length, the minimum reach length, drainage density and DEM resolution as well as extraction threshold value. First, three DEM data were cut according to the 10 primary regions and the SWAT model built with the cut data as the input data. According to the actual situation and area of the different regions, the extracted threshold value was set to 1 000-10 000 ha and a point was taken every 1 000 ha. A point is taken every 10 000 ha when the threshold value is between 10 000 and 100 000 ha, and a point is taken every 100 000 ha when the threshold value is between 100 000 and 1 000 000 ha. For DEM with different resolutions and data in different regions, an independent project was built to extract them. The total number of sample points extracted for each region was 28.
RESULTS
Relation between threshold value and sub-basin counts
It can be seen from the extraction results (Figure 3) that the sub-basin counts extracted reduce rapidly and are basically linear distributions when the threshold value stays between 0 and 5 000 ha; when the threshold value is greater than 200 000 ha, the sub-basin counts extracted basically tend to level off and are linear distributions. Threshold values between 5 000 ha and 200 000 ha are the optimal threshold values that can be extracted with the SWAT model, can be used to obtain a better extraction result, and basically are power exponent distributions. According to the results of the global fitting of curves, a power function distribution is shown.

DEM data with different resolutions have little influence on the extraction results, and the main range of influence is from 5 000 ha to 200 000 ha; when the DEM resolution stays within the range of 250 m - 1 km, the higher the resolution is, the larger the sub-basin counts extracted from the same threshold value will be. When the threshold value is less than 5 000 ha, the change of DEM resolution may have a great influence on the sub-basin counts extracted; when the threshold value is greater than 200 000 ha, the change in DEM resolution basically has no influence on the extraction result. During sparse drainage network extraction, DEM data with high resolution can be adopted to extract with a small threshold value; during dense drainage network extraction, DEM data with low resolution can be adopted to extract with a large threshold value.
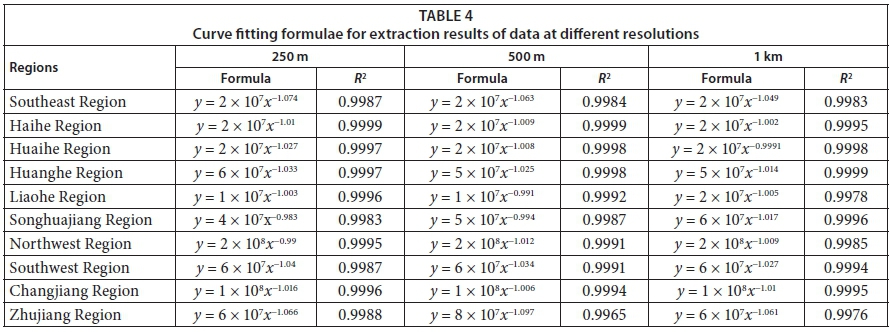
The smaller the threshold value is, the higher the demand on computer processing and the longer the process will take. Therefore, it is necessary to develop a method that can be used for the computation of a more reasonable threshold value. It can be seen from the curve fitting results (Table 4) that the relation between the sub-basin counts and threshold value is a power exponential distribution, and the fitted curve for the different threshold value extraction results obeys the following form:

In addition, the value of a is generally 2 × 10⁷ and the R2 values for 30 fitted curves are all above 0.99. Even 0.9999 can be achieved on the best fitted curve.
It can be seen from the variation of the value of b in the fitted curves for different regions that when the DEM data resolution is 250 m ~ 1 km, the value of b increases with the decrease of resolution and the variation is not obvious when the variation range is −0.9 ~ −1.1 (Fig. 4). Therefore, it can be deduced that when extracting drainage networks in SWAT based on the DEM data, the sub-basin counts and the DEM resolution obey the power function exponential distribution of y = axb. In general, parameter a is 2 × 10⁷ and the range of variation of parameter b is −0.9~ −1.1. When b = −1, the following formula applies:


Relation between the threshold value and maximum reach length
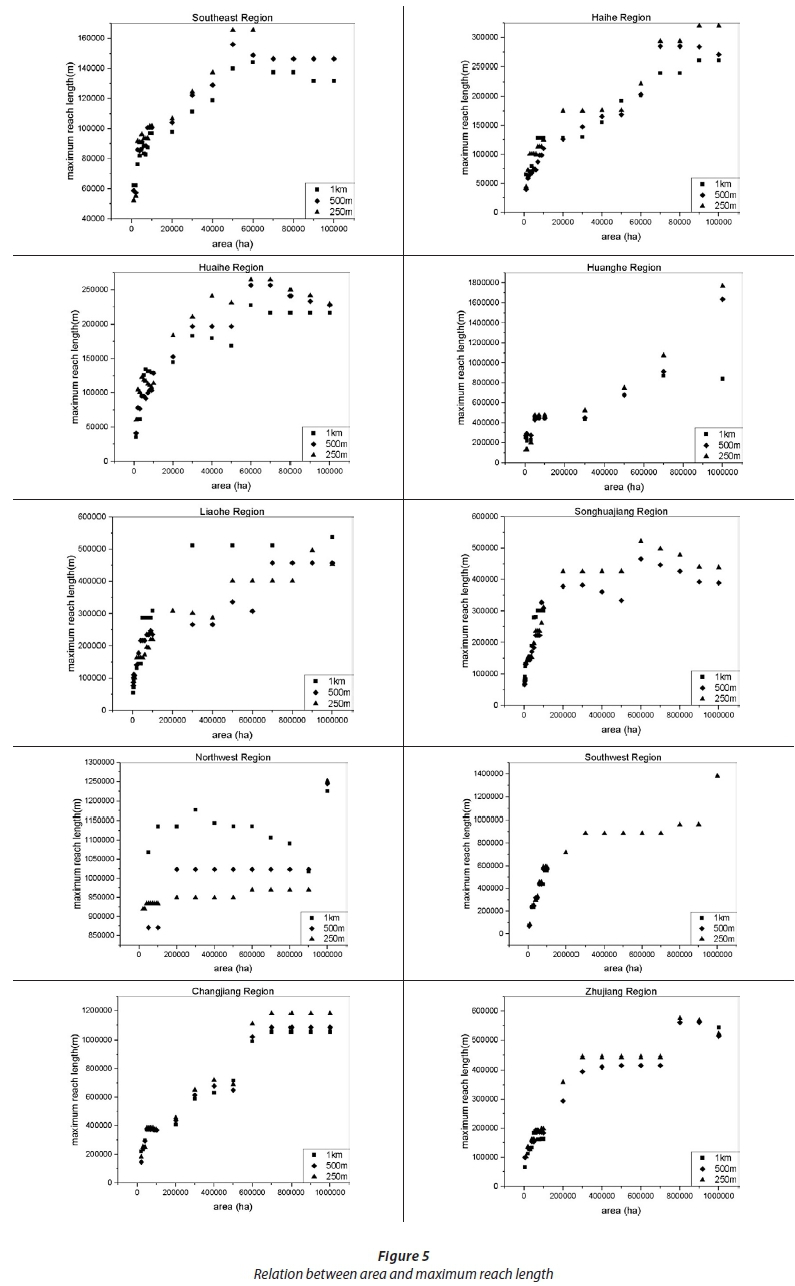
It can be known from the relation between maximum reach length and threshold value that in the range of 0 - 200 000 ha the maximum reach length increases as the threshold value increases. In the range of 200 000 − 700 000 ha, the maximum reach lengths of the Huaihe Region, Liaohe Region, Songhuajiang Region, Northwest Region, Southwest Region and Zhujiang Region remain stable, while the maximum reach lengths of the Southeast Region, Haihe Region, Huanghe Region and Changjiang Region increase as the threshold values increase; for threshold values larger than 700 000 ha, the maximum reach lengths of the 10 regions tend to level off (Fig. 5).
The difference in elevation is also related to the threshold value. The larger the difference in elevation is, the smaller the threshold value will be. When the DEM data resolution stays within the range of 250 m - 1 km, the maximum reach length is less influenced by the DEM data resolution and the extraction results under different resolutions display great differences (Fig. 6). The main difference appears after 200 000 ha. According to the relation between sub-basin counts and threshold value mentioned above, the optimal threshold value range is 5 000~200 000 ha. Therefore, in this section, the maximum reach length variation within this range is discussed. When the DEM resolution varies between 250 m and 1 km, the extraction result of the maximum reach length shows little change and increases slightly with the DEM data resolution. In the Huanghe Region, after the DEM resolution changes from 1 km to 500 m, the extraction result of the maximum reach length increases from 800+ km to 1 600+ km, while when it changes from 500 m to 250 m no obvious change is observed. In the Southwest Region, when the DEM resolution changes from 1 km to 500 m, the extraction result of the maximum reach length no change is noticeable to about 600 km, while when it changes to 250 m there is an obvious increase (to 1 400 km). Therefore, it can be assumed that when the watershed has steep terrain and there is an obvious difference in elevation, the gravitational erosion is more marked and the drainage area needed to form a channel with a certain flow is smaller, and the threshold value is smaller as the flow velocity increases.

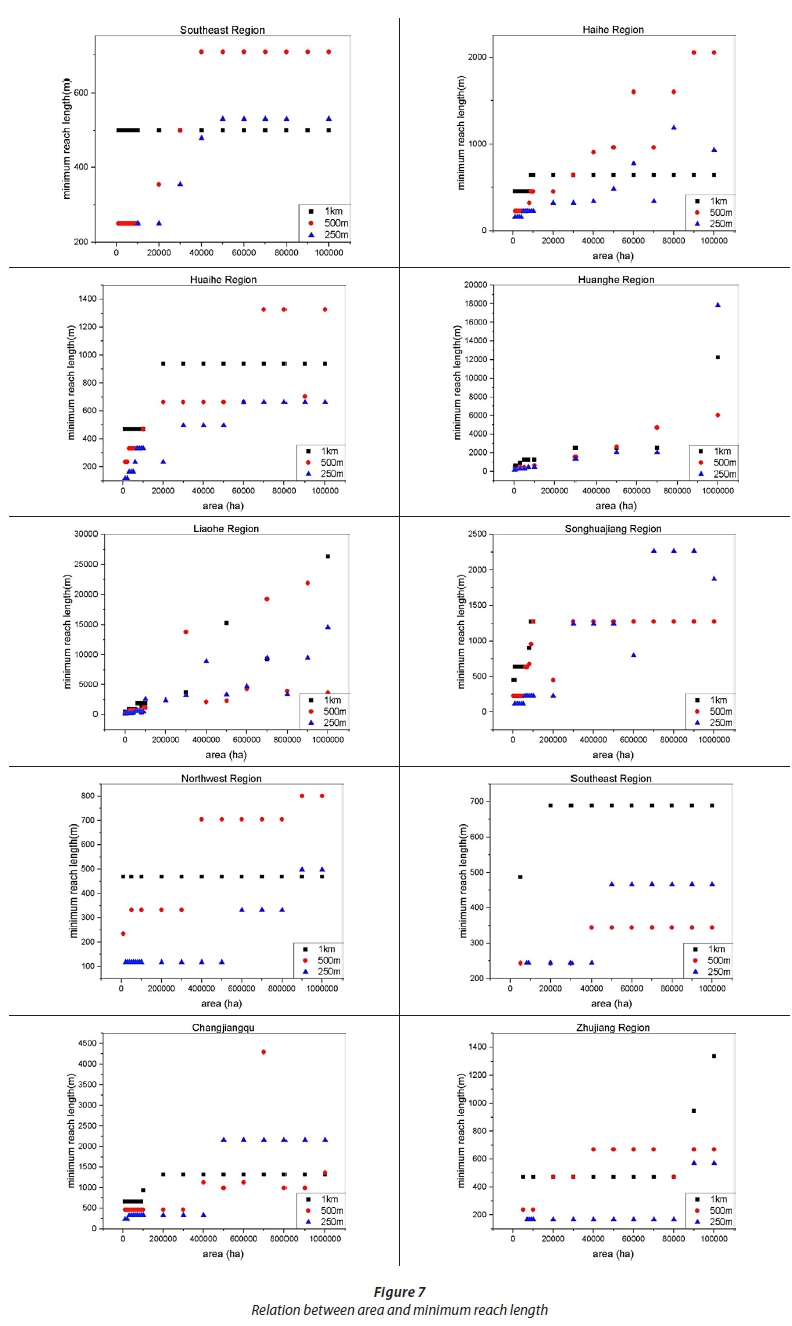
Relation between the threshold value and minimum reach length
It can be known from the relation between the extraction result of the minimum reach length and the threshold value that in the range of 0-200 000 ha, the extraction result of the minimum reach length remains stable and the change in minimum reach length is not obvious. For threshold values larger than 200 000 ha, the variation of the minimum reach length falls into one of two situations: (i) in the Southeast Region, Huaihe Region, Songhuajiang Region, Northwest Region, Southwest Region, Changjiang Region and Zhujiang Region, the minimum reach length does not change with threshold value; (ii) in the Haihe Region, Huanghe Region and Liaohe Region, the minimum reach length increases as threshold value increases. When the DEM data resolution is 250 m − 1 km, the variation of the minimum reach length is influenced by the DEM data resolution, and the variation trends of the minimum reach length extracted on the basis of the DEM data with 500 m and 1 km resolutions show strong agreement (Fig. 7).
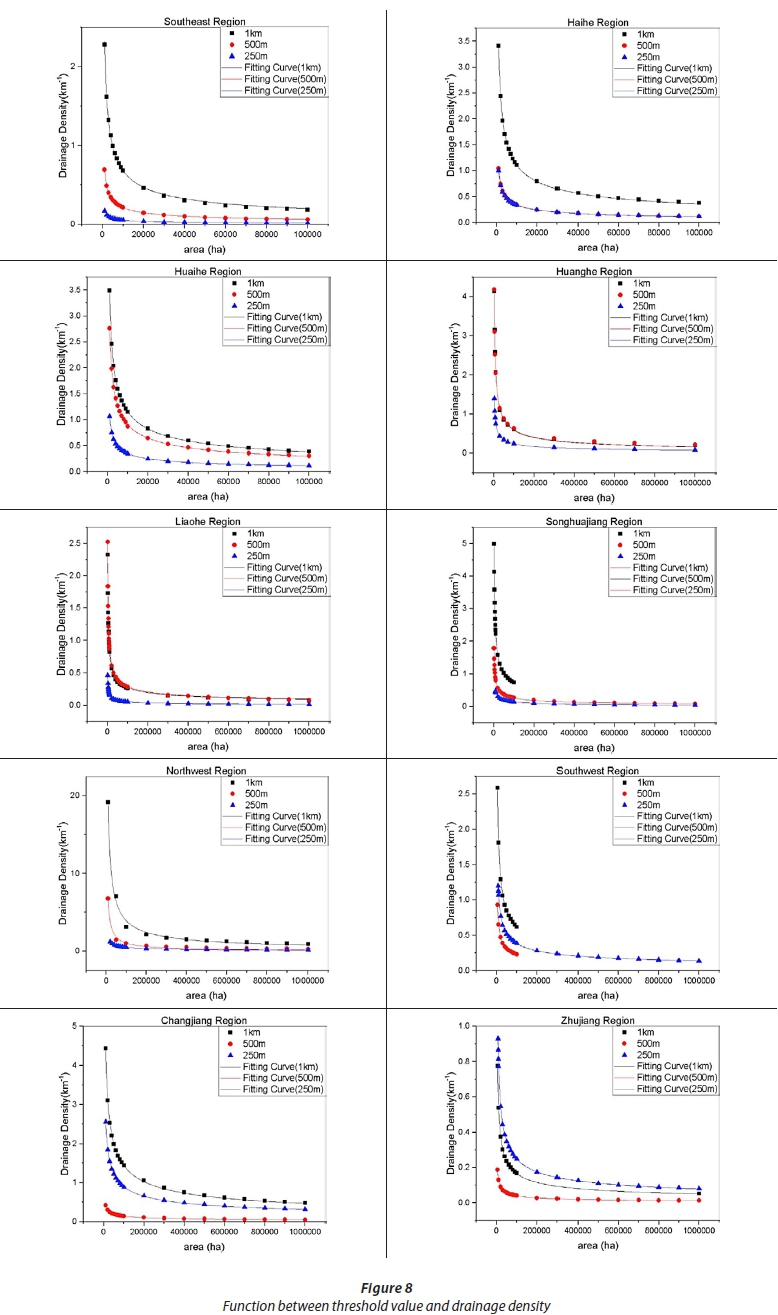
Relation between threshold value and drainage density
If one plots the relation curve of the drainage area threshold value and drainage density, based on the extraction results of drainage networks for curve fitting, it will be noticed that the drainage density decreases dramatically with the increase in drainage area within the range of 0-20 000 ha, and tends to level off after that. The fitted curve conforms to the following power function distribution.

At the same time, since the drainage density is under the influence of DEM resolution, the higher the resolution is, the larger the drainage density will be under the same threshold value, and the influence of resolution becomes weaker and weaker with the increase in the threshold value. Under the influence of DEM resolution, the extraction results for drainage density in several regions, such as Haihe Region, Huanghe Region and Liaohe Region, show some similar properties. The curves of the Haihe Region and Liaohe Region at 250 m and 500 m resolution overlap, and those of the Huanghe Region at 500 m and 1 km resolution and of the Songhuajiang Region and Northwest Region at 250 m and 500 m resolution also overlap (Fig. 8).
We can conclude that all of the R2 of the fitted curves are above 0.99, representing a good fit (Table 5). The value of a increases with the increase in region area and DEM resolution; the value of b varies between −0.4 and −0.8, and generally maintained at around −0.5.
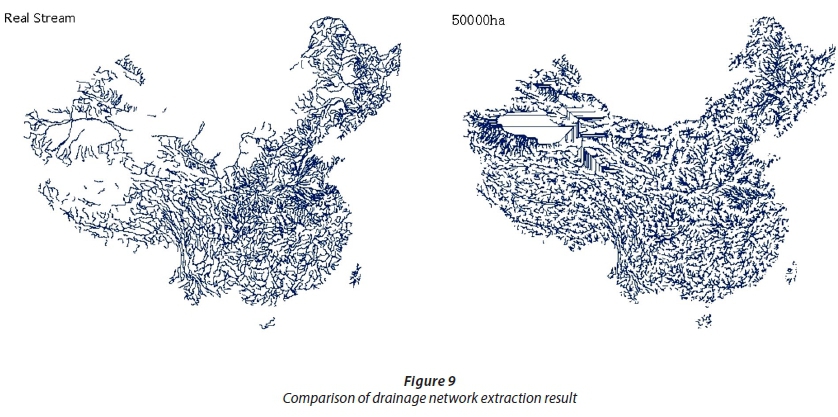
Relation between extraction stream and real stream
Different DEM data resolutions may result in different accuracies of drainage network flow direction; the general law is: with a decrease in DEM resolution, the delineation of the drainage network becomes clearer, and the main stream and tributary streams gradually become distinct (Fig. 9). Asmentioned above, the optimal threshold value range extracted is 5 000-200 000 ha; the smaller the threshold value is, the more accurate the extraction results will be. To analyse the difference between the extraction stream and the real stream, it is necessary to compare the differences between the extraction stream and real stream when the DEM data with 250 m resolution are used for extraction at different threshold values. The results show that the drainage network extracted under 100 000 ha is better than the real drainage network in terms of degree of fitting.
It can be seen from the SWAT extraction results that the sub-basin counts change regularly with the threshold value. Drainage networks in southeast areas such as the Changjiang Region and Zhujiang Region have strong extraction results. The extraction results of drainage networks in the Northwest Region are distorted and do not correspond with the situation of the real stream, which shows that the SWAT model has its own deficiencies in terms of drainage network extraction. It is shown in the study by Ariza-Villaverde et al. (2013) that the extraction results of the D8 algorithm are relatively sparse; therefore it is necessary to determine the proper threshold value to extract and obtain accurate drainage networks. Some scholars have made comparisons among the different extraction results of different threshold values, but the watersheds selected were small watersheds which are not representative enough, and the DEM data used were data with high accuracy of 5 m and 10 m, and these are not appropriate for use in studies related to China, where the areas investigated are relatively large and involve various landforms, including mountain, gorge, plain and hill. According to Luo Yunxiang et al. (2011), who studied the plain drainage network areas, the river ways in plain-drainage network areas are always bifurcated or shown as networks, which renders them unable to be identified by the SWAT model, and causes discrepancies in the extractions of the river courses and watersheds. The improvement of data accuracy was not able to enhance the extraction results of the plain-drainage network areas. Therefore, low-resolution data was used in the current study. In this way, the drainage network extraction in plain areas obtained a relatively realistic drainage network, but the extraction in the Northwest Region failed to obtain a satisfactory result.
DISCUSSION
The processing mode for DEM is roughly similar in different hydrological models. DEM resolution influences the extraction of topographic information and fitting results in models other than the SWAT model (Ariza-Villaverde et al., 2013; Dombradi et al., 2007). Callaghan and Mark (1984) adopted the minimum drainage area and Martz and Garbrecht (1998) held that the drainage area threshold value can comprehensively reflect the complicated interactive relation of influencing factors for the development of drainage networks. However, when there are many geomorphic types in the study area, different drainage area threshold values must be set according to the spatial variation rule of the geomorphic parameters (Pelletier, 2013; Rahman and Lu, 2015). The study conducted by Sun Liqun et al. (2008) shows that appropriate-precision DEM data should be selected when building a hydrological model; 300 m DEM data are the key to ensuring that the simulation efficiency and simulation result improve as the DEM resolution increases. Zhang et al. (2014) found that when the DEM resolution is greater than 500 m, it also has an influence on the water quality model in the SWAT model (Zhang et al., 2014), but when the DEM resolution reaches a certain value, the accuracy of simulation with models is increased insignificantly regardless of how the data accuracy is improved. Therefore, when a region with a large area of watershed is selected for simulation, appropriate DEM data are selected and a reasonable threshold value is determined (Gitau and Chaubey, 2010; Van de Sande et al., 2012). Cotter et al. (2005) found that when they built a hydrological model in Arkansas, DEM resolution was the key influencing factor of simulation, the simulation results were very sensitive to size of the DEM pixels, and the extraction results of the drainage network had a great influence on the simulation results, especially in regions with small areas of watershed (Gassman et al., 2007). The study conducted by Li et al. (2004) shows that the sensitivity of watershed confluence to the threshold value indicates that selecting an appropriate threshold value is essential to improving the descriptive power of the digital drainage network and confluence network about the characteristics of watershed confluence, and they derived a relation between the drainage area threshold value and watershed slope of y = alnx + b. A variation trend between the drainage area threshold value and watershed slope is indeed shown, but there is no obvious turning point as both of them increase. When the maximum R2 is 0.75, the fitting results are not good (Li et al, 2006). However, in this study, the R2 of the fitting curves of sub-basin counts and drainage area threshold value are above 0.99, and the fitting results are reliable.
The watershed parameters of the extracted drainage network from different scales of DEM are obviously different. The accuracy of the extracted drainage network from small-scale DEM is higher than that from large-scale DEM. Reach length, slope, average elevation and average slope vary greatly (Chaplot, 2014; Zhang and Chu, 2015). The findings for small watersheds show that the change in DEM resolution has little influence on the watershed area and the maximum reach length, but has a great influence on the total reach length, drainage density and average slope. The influence rule for the extraction of watershed characteristics is that the extracted watershed characteristics are rougher as the DEM resolution decreases (Chaplot, 2014; Zhang and Chu, 2015). The relation between the maximum and minimum reach length and drainage area threshold value is not obvious, and no curved line relation is built in this study. The researchers set the extraction threshold values of the sub-basins to 10, 12, 15, 30, 50, 100 and 200 km2 in the study on Xingzihe watershed, and the results show that when the extracted threshold value of the sub-basins is between 12 and 100 km2, different watershed subdivisions have little influence on sediment yield. If this range is exceeded, the sediment yield is underestimated by the models. Thus it can be seen that an appropriate threshold value has a great influence on the watershed simulation, and a DEM with a resolution of less than 15 m does not reflect the hydrological and topographic information of small watersheds very accurately (Qiu et al., 2012). However, since the resolution of the DEM data used in this study are relatively high, the real hydrological and topographic information can be reflected, and considering the purpose of this study is to analyse the impacts of DEM resolution and extraction threshold on drainage network, the impacts should be considered in large watersheds.
The study results in large watersheds are different from those in small watersheds. The preparation of closed depressions and flat regions in DEM, flow determination and DEM resolution directly influence the extraction quality and efficiency of watershed characteristics (Gao and Zhang, 2009; Gökgöz and Baker, 2015). The drainage area threshold value is not only related to topography, but also to climate, vegetation, soil and geological properties, which determine that the drainage area threshold value is distributed unevenly in watersheds, and may vary with the underlying surface (Datta and Schack-Kirchner, 2010). Most drainage networks in the loess area of China are dendritic or fan-shaped. The study of a loess area shows that the optimal threshold value for extracting drainage networks is 1 000 km2 in order to obtain a reasonable drainage network structure. In this study, Huanghe Region has a good extraction result, while the extraction results in Northwest Region are poor. More consideration shall be given to the influence of topographic factors in future research. Although AEDNM, developed by Ye et al. (2005) can resolve the problems caused in the extraction of drainage networks due to depressions and flat land in DEM, it is still not used to extract relatively realistic drainage networks in the Northwest Region (Ye et al., 2005). Ariza et al. (2013) have also pointed out that when the appropriate drainage area threshold value is determined for drainage network extraction, the geomorphologic features of the study area should be considered, because these features influence the drainage area threshold value. Sun et al. (2013) built a regression equation for the quantitative description of the influence of mean annual rainfall, average slope, stream diameter and leaf area indexes on drainage area threshold value, through a study of 50 Chinese watersheds. In the regression equation, the average slope makes the greatest contribution to the threshold value, which proves the regressive relation between drainage network and drainage area threshold value (Sun et al., 2013). A regression equation y = axb is derived in this study by analysing the relation between drainage density and drainage area threshold value. R2 is also above 0.99, and the fitting results are reliable.
CONCLUSION
The analysis of the relation among the sub-basin counts, maximum and minimum reach lengths, drainage density and drainage area threshold value provides a reference basis for the determination of drainage area threshold value required by the SWAT model, eliminates the randomness that results when DEM is used for extraction of drainage networks, and reduces the simulation workload with the SWAT model. The sub-basin counts decrease exponentially with drainage area threshold value. Gravitational erosion is more marked as the elevation difference increases, and as the flow velocity increases the drainage area required to form a river course with a certain flow is smaller and the threshold value is lower. High-resolution DEM data can provide higher accuracy and reduce errors, but an appropriate threshold value by which to select the area of study also influences the reading of DEM data. The appropriate threshold value determined in this paper is between 5 000 and 200 000 ha and is applicable to the primary regions in 10 watersheds of China. The extracted sub-basin counts decrease exponentially as the threshold value increases and the variation trend is y = axb. The maximum reach length increases continuously as while the threshold value increases, and the minimum reach length shows no relation with the threshold value, the DEM resolution (250 m-1 km) has less influence on the result of the drainage network extraction.
The drainage network is extracted with a slope concentration model based on DEM, and the flow direction is determined with the D8 algorithm. The extracted drainage network is different from the real drainage network due to the DEM data resolution. Determining the appropriate threshold value according to the drainage network data of Level 5 rivers in China can help to quickly extract the digital drainage network of rivers. The direct extraction method for extracting the drainage network from DEM significantly reduces the amount of human labour required, and the extracted drainage network is almost the same as the real drainage network, so as to completely meet the requirements for hydrological modelling. It is important to research and develop a distributed hydrological model. However, the extraction results for the Northwest Region in this study are poor and distorted. At this point, this difference is only expressed from the macro-level onward, it is not detailed for each grid unit, and even the position error is difficult to determine. When the drainage networks are extracted, the accuracy of the drainage network extraction depends on the different drainage area threshold values determined, but the extraction results are judged mainly by the human eye. For this reason, the influence of different geomorphologic types on drainage network extraction requires further study, due to the influence of geomorphologic type.
ACKNOWLEDGEMENTS
This study was funded by General Financial Grant from the China Postdoctoral Science Foundation (2016M592404), the National Natural Science Foundation of China (No. 51479062/41371048), and the Fundamental Research Funds for the Central Universities (2015B14314).
REFERENCES
ANG C, XIN S, DONGSHENG W, WENGEN L, HUAIFENG G and JIE T (2016) Landscape and avifauna changes as an indicator of Yellow River Delta Wetland restoration. Ecol. Eng. 86 162-173. https://dx.doi.org/10.1016/j.ecoleng.2015.11.017 [ Links ]
ANG C, MIAO W, KAIQI C, ZHIYU S, CHEN S, PENGYUAN W (2017) Main Issues in environmental protection research and practice of water conservancy and hydropower projects in China. Water Sci. Eng. 4 (9) 312-323. https://doi.org/10.1016/j.wse.2017.01.008 [ Links ]
ARIZA-VILLAVERDE AB, JIMÉNEZ-HORNERO FJ and GUTIÉRREZ DE RAVÉ E (2013) Multifractal analysis applied to the study of the accuracy of DEM-based stream derivation. Geomorphology 197 85-95. https://doi.org/10.1016/j.geomorph.2013.04.040 [ Links ]
ATHMANIA D and ACHOUR H (2014) External validation of the ASTER GDEM2, GMTED2010 and CGIAR-CSI- SRTM v4.1 free access digital elevation models (DEMs) in Tunisia and Algeria. Remote Sens. 6 (5) 4600-4620. https://doi.org/10.3390/rs6054600 [ Links ]
BAHADUR KCK (2009) Improving landsat and IRS image classification: evaluation of unsupervised and supervised classification through band ratios and DEM in a mountainous landscape in Nepal. Remote Sens. 1 (4) 1257-1272. https://doi.org/10.3390/rs1041257 [ Links ]
CHAPLOT V (2005) Impact of DEM mesh size and soil map scale on SWAT runoff, sediment, and NO3-N loads predictions. J. Hydrol. 312 (1-4) 207-222. https://doi.org/10.1016/j.jhydrol.2005.02.017 [ Links ]
CHAPLOT V (2014) Impact of spatial input data resolution on hydrological and erosion modeling: Recommendations from a global assessment. Phys. Chem. Earth A/B/C 67-69 23-35. https://doi.org/10.1016/j.pce.2013.09.020 [ Links ]
CHAUBEY I, COTTER AS, COSTELLO TA and SOERENS TS (2005) Effect of DEM data resolution on SWAT output uncertainty. Hydrol. Process. 19 (3) 621-628. https://doi.org/10.1002/hyp.5607 [ Links ]
DATTA PS and SCHACK-KIRCHNER H (2010) Erosion relevant topographical parameters derived from different DEMs-a comparative study from the Indian Lesser Himalayas. Remote Sens. 2 (8) 1941-1961. https://doi.org/10.3390/rs2081941 [ Links ]
DOMBRADI E, TIMAR G, BADA G, CLOETINGH S and HORVATH F (2007) Fractal dimension estimations of drainage network in the Carpathian-Pannonian system. Glob. Planet. Change 58 (1-4) 197-213. https://doi.org/10.1016/j.gloplacha.2007.02.011 [ Links ]
GAO Y and ZHANG W (2009) LULC classification and topographic correction of landsat-7 ETM+ imagery in the Yangjia River watershed: the Influence of DEM resolution. Sensors 9 (3) 1980-1995. https://doi.org/10.3390/s90301980 [ Links ]
GASSMAN PW, REYES MR, GREEN CH and ARNOLD JG (2007) Soil and Water Assessment Tool: historical development, applications, and future research directions. Trans. ASABE 50 (4) 1211-1250. https://doi.org/10.13031/2013.23637 [ Links ]
GEZA M and MCCRAY JE (2008) Effects of soil data resolution on SWAT model stream flow and water quality predictions. J. Environ. Manage. 88 (3) 393-406. https://doi.org/10.1016/j.jenvman.2007.03.016 [ Links ]
GITAU MW and CHAUBEY I (2010) Regionalization of SWAT model parameters for use in ungauged watersheds. Water 2 (4) 849-871. https://doi.org/10.3390/w2040849 [ Links ]
GÖKGÖZ T and BAKER M (2015) Large scale landform mapping using Lidar DEM. ISPRS Int. J. Geo-Inf. 4 (3) 1336-1345. https://doi.org/10.3390/ijgi4031336 [ Links ]
HOU K, SUN J, YANG W, SUN T, WANG Y and MA S (2011) Automatic extraction of drainage networks from DEMs base on heuristic search. J. Software 6 (8). https://doi.org/10.4304/jsw.6.8.1611-1618 [ Links ]
LI C and YANG D (2004) Deriving drainage networks and catchment boundaries from Grid Digital Elevation Model. J. China Inst. Water Resour. Hydropower Res. 3 50-56. [ Links ]
LI L, ZHENCHUN H and JIAHU W (2006) Study on contributing area threshold used in extracting digital channel networks [EB/OL].Beijing: Sciencepaper Online 6 (12). http://www.paper.edu.cn/releasepaper/content/200606-212 [ Links ]
LI R, TANG Z, LI X and WINTER J (2013) Drainage structure datasets and effects on LiDAR-Derived surface flow modeling. ISPRS Int. J. Geo-Inf. 2 (4) 1136-1152. https://doi.org/10.3390/ijgi2041136 [ Links ]
LIN W, CHOU W, LIN C, HUANG P and TSAI J (2006) Automated suitable drainage network extraction from digital elevation models in Taiwan's upstream watersheds. Hydrol. Process. 20 (2) 289-306. https://doi.org/10.1002/hyp.5911 [ Links ]
LIU X, LU H, BIAN L and REN Z (2006) Comparison of algorithms for extracting drainage network from grid-based digital elevation model. J. Hydraul. Eng. 9 1134-1141. [ Links ]
PELLETIER JD (2013) A robust, two-parameter method for the extraction of drainage networks from high-resolution digital elevation models (DEMs): Evaluation using synthetic and real-world DEMs. Water Resour. Res. 49 (1) 75-89. https://doi.org/10.1029/2012WR012452 [ Links ]
QIU L, ZHENG F and YIN R (2012) Effects of DEM resolution and watershed subdivision on hydrological simulation in the Xingzihe watershed. Acta Ecol. 12 3754-3763. [ Links ]
RAHMAN M and LU M (2015) Model spin-up behavior for wet and dry basins: a case study using the xinanjiang model. Water 7 (8) 4256-4273. https://doi.org/10.3390/w7084256 [ Links ]
REUTER HI, NELSON A and JARVIS A (2007) An evaluation of void-filling interpolation methods for SRTM data. Int. J. Geogr. Inf. Sci. 21 (9) 983-1008. https://doi.org/10.1080/13658810601169899 [ Links ]
SHEN ZY, CHEN L, LIAO Q, LIU RM and HUANG Q (2013) A comprehensive study of the effect of GIS data on hydrology and non-point source pollution modeling. Agric. Water Manage. 118 93-102. https://doi.org/10.1016/j.agwat.2012.12.005 [ Links ]
SUN A, YU Z, YANG C and GU H (2013) Impact factors of contribution area threshold in extracting drainage network for rivers in China. J. Hydraul. Eng. 8 901-908. [ Links ]
SUWANDANA E, KAWAMURA K, SAKUNO Y, KUSTIYANTO E and RAHARJO B (2012) Evaluation of ASTER GDEM2 in comparison with GDEM1, SRTM DEM and topographic-map-derived DEM using inundation area analysis and RTK-dGPS data. Remote Sens. 4 (12) 2419-2431. https://doi.org/10.3390/rs4082419 [ Links ]
SZCZEŚNIAK M and PINIEWSKI M (2015) Improvement of hydrological simulations by applying daily precipitation interpolation schemes in meso-scale catchments. Water 7 (2) 747-779. https://doi.org/10.3390/w7020747 [ Links ]
van de SANDE B, LANSEN J and HOYNG C (2012) Sensitivity of coastal flood risk assessments to digital elevation models. Water 4 (4) 568-579. https://doi.org/10.3390/w4030568 [ Links ]
VESAKOSKI J, ALHO P, HYYPPÄ J, HOLOPAINEN M, FLENER C and HYYPPÄ H (2014) Nationwide digital terrain models for topographic depression modelling in detection of flood detention areas. Water 6 (2) 271-300. https://doi.org/10.3390/w6020271 [ Links ]
YE A, XIA J, WANG G and WANG, X (2005) Drainage network extraction and subcatchment delineation based on digital elevation model. J. Hydraul. Eng. 5 531-537. [ Links ]
YU Y, DISSE M, YU R, YU G, SUN L, HUTTNER P and RUMBAUR C (2015) Large-scale hydrological modeling and decision-making for agricultural water consumption and allocation in the main stem Tarim River, China. Water 7 (6) 2821-2839. https://doi.org/10.3390/w7062821 [ Links ]
ZHANG J and CHU X (2015) Impact of DEM resolution on puddle characterization: comparison of different surfaces and methods. Water 7 (5) 2293-2313. [ Links ]
ZHANG P, LIU R, BAO Y, WANG J, YU W and SHEN Z (2014) Uncertainty of SWAT model at different DEM resolutions in a large mountainous watershed. Water Res. 53 132-144. https://doi.org/10.3390/w7052293 [ Links ]
ZHANG Z, LU W, CHU H, CHENG W and ZHAO Y (2014) Uncertainty analysis of hydrological model parameters based on the bootstrap method: A case study of the SWAT model applied to the Dongliao River Watershed, Jilin Province, Northeastern China. Sci. China Technol. Sci. 57 (1) 219-229. [ Links ]
Received 9 October 2015
Accepted in revised form 20 June 2017
† These authors contributed equally to this work
* To whom all correspondence should be addressed: +8625 83786973; fax: +8625 83786621. e-mail: ship@hhu.edu.cn

