


Serviços Personalizados
Artigo
 Inglês (pdf)
 Artigo em XML
 Referências do artigo
Indicadores

Links relacionados
-
 Citado por Google
 -
 Similares em Google
Compartilhar

 Permalink
Water SA
versão On-line ISSN 1816-7950
versão impressa ISSN 0378-4738
Water SA vol.43 no.3 Pretoria Jul. 2017
http://dx.doi.org/10.4314/wsa.v43i3.06
Spatial analysis of fluoride concentrations in drinking water and population at risk in Namibia
H WankeI; JS UelandII; MHT HipondokaIII, *
IGeology Department, University of Namibia, Private Bag 13301, Windhoek, Namibia
IIDepartment of Geography, Bemidji State University, 1500 Birchmont Drive NE, Bemidji, MN 56601, USA
IIIDepartment of Geography, History and Environmental Studies, University of Namibia, Private Bag 13301, Windhoek, Namibia
ABSTRACT
Namibia, the driest country in sub-Saharan Africa, is largely reliant on groundwater for its potable water demand and groundwater is a major source of naturally-occurring fluoride. This study assessed the spatial distribution of fluoride in potable water and appraised the population at risk for high fluoride intake. Analysis of fluoride levels used existing databases that include 28 000 borehole locations across the country, while the population data were based on the 2011 Census. Spatial analysis and spatial statistics methods employed included Moran's I, local indicators of spatial association (LISA), basic Euclidian distance, analysis of variance (ANOVA) and spatial overlay in a GIS environment. Fluoride concentrations above the recommended limit of 1.5 mg/L occur in a fifth of the boreholes and as much as 8% of the population across the country is at risk. Although the number of people in Namibia who are exposed to high fluoride is relatively small at a global scale, it is significant at a national level. Preventative measures against high fluoride intake are thus necessary in the country.
Keywords: fluoride, potable water, groundwater, spatial analysis, Namibia
INTRODUCTION
The benefit of fluoride as a therapeutic element for human health in stimulating normal mineralization of bones, formation of dental enamel and maintenance of fertility (Dey and Giri, 2016) is realized when its intake does not exceed optimal levels. Low fluoride intake is associated with the development of dental caries (e.g. Treasure and Dever, 1992; Jesu and Dheenadayalan, 2013). In contrast, extended exposure to high doses is known for deleterious consequences, including dental and skeletal fluorosis (e.g. Kundu et al., 2001), impaired development of intelligence in children (Lu et al., 2000) and decreased birth rate (Ghosh et al., 2002; Izquierdo-Vega et al., 2008). Drinking water is the major source of naturally occurring fluoride intake. Its concentration in natural groundwater typically ranges between 0.1 and 10 mg/L (WHO, 2008). The World Health Organization (WHO, 2008) recommends potable water to have fluoride concentrations below 1.5 mg/L and regions with values above that threshold are considered as high-fluoride areas. WHO (2008) estimated that more than 200 million people worldwide are consuming drinking water with a fluoride concentration higher than the guideline value of 1.5 mg/L. India is reported to have 70 million people exposed to elevated levels of fluoride (Edmunds and Smedley, 2005), while China has 45 million (Wuyi et al., 2002), followed by Mexico with 5 million (Diaz-Barrigo et al., 1997). Areas with high fluoride content on the African continent are generally associated with the East African Rift System, notably, Ethiopia, Kenya, Uganda, Tanzania, Zambia, Eritrea, Djibouti, Rwanda, Burundi and Malawi. Other African countries with known elevated fluoride content in groundwater are Senegal, Ghana, Ivory Coast, Sudan and the Bushveld area of South Africa (Edmunds and Smedley, 2005). In Namibia, a sparsely populated and dry country, much of the population is reliant on groundwater for potable water. Fluoride in Namibia's drinking water is considered by Namibia Water Corporation (NAMWATER), the distributor of the bulk of the nation's water supply, as one of the three constituents of concern; the other two being total dissolved solids (TDS) and nitrate. While several studies (e.g. Amutenya, 2012; Petrus, 2012; Wanke et al., 2013; Sracek et al., 2015) have attempted to address the possible causes for fluoride accumulation in Namibia, no endeavour has been made to link elevated fluoride content in potable water to the population's geographic distribution.
The results of these previous studies have not been consistent in terms of characterizing the fluoride content of Namibia's groundwater. For example, Edmunds and Smedley (2005) examined fluoride exposure at sub-regional levels and concluded that Namibia›s groundwater has a fluoride content largely below 1.5 mg/L; but conducting this study at such a broad scale could potentially conceal spatial discrepancies that may exist at a local scale. Based on geological and climatological data, Brunt et al. (2004) concluded that, except for western Namibia, the country has a very low or no probability of fluoride content above 1.5 mg/L; however, no empirical data for fluoride concentration in groundwater were considered in that study. In contrast, Amini et al. (2008) employed a statistical approach on the distribution of geogenic fluoride in groundwater and found that 70% of Namibia has a probability of more than 0.6 for groundwater to have a fluoride concentration larger than 1.5 mg/L. Confirmation with measured data for Namibia was also missing in this approach. More recently, an analysis of data obtained from the Groundwater Information (GROWAS) database of the Ministry of Agriculture, Water and Forestry (MAWF) and a hydrocensus for the Cuvelai-Etosha Basin showed that groundwater from various areas across the country contains fluoride concentrations above the minimum acceptable limit (Wanke et al., 2013). However, the distribution of fluoride concentrations in Namibia's groundwater was not assessed in relation to the spatial distribution of human population.
Improved understanding of the regions affected by elevated fluoride, and the number of people involved, is a necessary step in mitigating its impact at a national level. Therefore, our study aimed to help close this gap and determine the areas and people at risk of fluorosis in Namibia. This was done by means of geo-statistically re-evaluating the spatial distribution of fluoride concentrations in Namibia's groundwater and comparing these results against the 2011 census data.
Fluoride and health
Although WHO (2008) recommends a standard limit of 1.5 mg/L for fluoride in drinking water, each nation has discretion to set its own standards and conditions. China and India, for example, set their national guideline for fluoride in potable water to 1 mg/L, while the USA uses 2 mg/L as its drinking water standard. In many arid regions, drinking water is such a scarce commodity that some governments were compelled to set the standard at higher levels in order to meet potable water demand. Tanzania is one such example, where the national standard for fluoride concentration is set to 4 mg/L (Edmunds and Smedley, 2005).
The fluoride guideline for drinking water in Namibia has 4 class limits (GRN, 1956). Excellent water quality is assigned to Class A, and the concentration of fluoride for this category is less than 1.5 mg/L. Class B, considered good quality, contains between 1.5 and 2 mg/L of fluoride. Class C, with a range between 2 and 3 mg/L, has low risk; and above 3 mg/L of fluoride is considered Class D, which bears a high health risk rating. A maximum level of 6 mg/L of fluoride is set as the upper limit for livestock watering.
There are no minimum limits imposed for drinking water with respect to fluoride content. Nonetheless, WHO (2008) recommends the minimum value of 0.5 mg/L to counteract the development of health risks such as dental caries due to fluoride deficiency.
About 96% of fluoride in the body is found in the bones and teeth (e.g. Arlappa et al., 2013). Fluoride deficiency can also be prevalent in cold countries, such as the USA and the UK, where health problems related to inadequate fluoride intake are consequently common (e.g., Jesu and Dheenadayalan, 2013). Chronic ingestion of water with fluoride concentrations above 1.5 mg/L results in dental fluorosis, characterized initially by opaque white patches, staining, mottling and pitting of teeth (Kundu et al., 2001). Skeletal fluorosis may occur when fluoride concentrations in drinking water exceed 4 mg/L, which leads to various health problems, including an increase in bone density, calcification of ligaments, rheumatic or arthritic pain in joints and muscles along with stiffness and rigidity of the joints, and bending of the vertebral column (Teotia and Teotia, 1988). The disease may be present in an individual at subclinical, chronic or acute levels of manifestation (Teotia and Teotia, 1988). In addition, it has been claimed that the dissolution of aluminium from aluminium utensils increases appreciably in the presence of fluoride in water. Aluminium is a neurotoxin and may cause damage to brain cells. Statistical studies also suggested that exposure of children to high levels of fluoride may carry the risk of impaired development of intelligence (Lu et al., 2000) and that increased fluoride intake from drinking water can result in decreased birth rate (Ghosh et al., 2002; Izquierdo-Vega et al., 2008).
Study area
Located in the southwestern part of Africa (Fig. 1), Namibia is subdivided in 14 political regions. It is a sparsely populated country (2.5 people/km2), with its 826 000 km2 surface area occupied by a population of 2.1 million people (GRN, 2012). The country is predominantly savanna covered and experiences an arid to semi-arid climate. The driest, south-western part of the country receives precipitation of less than 50 mm/a on average, and this increases to about 600 mm/a in the wettest, north-eastern part. Mean annual potential evaporation rate ranges from 2 400 mm/a in the northeast to 3 800 mm/a in the southeast (Mendelsohn et al., 2002).
Namibian geology encompasses a wide range of rocks, which vary from Archaean to Cenozoic age. About half of the country's surface is covered by young surficial sediments of the Kalahari and Namib deserts; whereas the other half is dominated by bedrock exposures of metamorphic, igneous and sedimentary rocks (Christelis and Struckmeier, 2001). The palaeo-proterozoic metamorphic inliers consisting of highly deformed gneisses, amphiboles, meta-sediments and the associated intrusive rocks are found on the central and northern part of Namibia, such as the Kunene and Grootfontein igneous complex in the north, the Orange River group and the Vioolsdrift Suit in the south, as well as the Khoabendus group and the Rehoboth sequences (Miller, 2008a).
The Namaqualand metamorphic complex, which is composed mainly of granitic gneisses, metasedimental rocks, magmatic intrusion and the volcano-sedimentary Sinclair sequences of central Namibia, represent the Mesoproterozoic rocks (1800 - 1000 Ma). A larger part of the north-western and central part of the country is underlain by a coastal and intra-continental arm of the Neo-proterozoic Damara Orogenic belt (800 - 500 Ma), with a platform of carbonates in the north and a variety of meta-sediments further south. Much of south-central Namibia is covered by shallow marine sediments of the Nama group, which are understood to have been derived from the uplifted Damara and Garieb belt during the later stage of orogenic evolution. The sedimentary and volcanic rocks of the Permian to Jurassic Karoo sequences are found in the Aranos, Huab and Waterberg basin in the south-eastern and north-western part of the country and are extensively intruded by dolerite sills and dyke swarms. These sills and dyke swarms are predominantly associated with basaltic volcanism and alkaline sub-volcanic intrusions marking the breakdown of Gondwanaland and formation of the South Atlantic Ocean during the Cretaceous (Miller, 2008b). The Cenozoic rocks are represented by the widespread Kalahari sequences.
DATA
Drinking water in Namibia comes from one of two possible sources: groundwater (boreholes) or surface water (rivers and reservoirs). Urban areas with treatment facilities are more likely to use surface water, which is often channelled from distant sources, such as rivers or reservoirs, through canals and/or pipelines. Except for the core of the densely-populated north-central regions, rural areas, villages, farms and informal settlements are more likely to draw drinking water directly from boreholes. To locate and analyse fluoride levels from boreholes, data were examined from the GROWAS database. As of this writing, the GROWAS database contains fluoride values from 27 736 out of 51 064 borehole locations in Namibia drilled over the past 100 years. The German Federal Institute for Geosciences and Natural Resources (Die Bundesanstalt für Geowissenschaften und Rohstoffe; BGR) Hydrocensus data has an additional 232 measurements of fluoride content, mainly from the north-central regions. The database contains a number of physical, chemical and location attributes related to borehole capacity and water quality.
Pipeline locations have also been mapped and identified by the Namibia's Ministry of Agriculture, Water and Forestry (Mendelsohn et al., 2002). It is assumed that these locations have treated water and thus fluoride levels are within the acceptable range for human consumption.
Population information has been collected from the Census of Namibia through the National Statistics Agency (NSA). Population data for 2011 have been recorded at the Enumeration Areas (EA) level (see Figure 1). According to NSA (2014) EAs are:
The smallest geographical area demarcated for purposes of interview is the enumeration area (EA). Ideally, an EA should contain more or less 100 households. The EA may comprise part of a locality, a whole locality or a group of localities. However, owing to other factors, mainly population density and geographic terrain, EAs have been conveniently demarcated to facilitate effective canvassing by an interviewer.
The data derived from EAs can also be aggregated to assess the key planning level geographies in Namibia, which include constituencies and regions. We combined and employed these three distinct datasets to determine both the areas where a high likelihood of groundwater fluoride exceeding the acceptable limits exists and the communities that are most likely at risk of consuming water with high levels of fluoride.
METHODS
To address the key questions of this study, namely identifying high-concentration fluoride areas and the number of individuals at potential risk of consuming drinking water with fluoride concentrations above the recommended levels in the country, we employed a number of GIS-based spatial analysis and spatial statistics methods summarized below.
Moran's I/LISA
To identify regional effects of high concentrations or clusters of fluoride in drinking water, we employed two measures of spatial autocorrelation. Spatial autocorrelation measures the similarity of a specific variable to that of its immediate neighbours. This can help discern clusters of boreholes that have levels of fluoride that are either high or low from a statistical significance standpoint. We utilized two measures of spatial autocorrelation in this study. Moran's I provides a measure between −1 and 1, indicating the strength of a spatial clustering amongst all points. Moran I coefficients can be interpreted in a similar fashion to Pearson's correlation coefficients. To this end, it compares local associations of any given borehole and its immediate neighbours to the overall mean of the dataset. This is considered a global statistic in that it tests for the general spatial dependency of all data points in the study (Liptzin and Silver, 2015).
To examine the local spatial effects of autocorrelation, Local Indicators of Spatial Association (LISA, 1985; Anselin, 1995) compares only a point to its neighbours and allows for cluster mapping of areas that are statistically high or low relative to all points. This allows for visualization of areas that have very high or very low levels of fluoride in the groundwater.
Threshold kriging
Taking the previous approach a step further, we can statistically interpolate the probability that any area exceeds a critical level of fluoride in the groundwater by employing threshold kriging. Threshold kriging utilizes the concept of spatial auto-correlation to estimate the probability that any location exceeds 1.5 mg/L in fluoride concentration in the groundwater. The estimate, for any location that does not have a borehole, is derived from the measured fluoride values of nearest locations in the database. The derived geostatistical model is used to interpolate a groundwater fluoride level for any other location in the study area. The model's ability to predict these values is heavily influenced by the number of and distance to the borehole measurements that are being used to make each estimate. This technique has been shown to be a viable means of estimating probable arsenic contamination of groundwater (Liu et al. 2004) and can provide insight into issues of fluoridisation in the groundwater in the study area.
Distance analysis
To assess populations at risk we examined fluoride levels by the distance of each EA to the nearest water source, which includes both boreholes, pipelines and/or river sources, using ArcGIS software. The Namibian Government (GRN, 2004) has set 2.5 km as a maximum distance for any household to retrieve potable water. Likewise, the 1.5 mg/L fluoride concentration recommended by WHO (2008) was used as a threshold. Using basic Euclidian distance measures, we identified the population from the 2011 census data that is not within a 2.5 km distance of a drinking water source having fluoride levels above 1.5 mg/L. In this analysis, safe drinking water sources include all pipeline/river sources and boreholes with fluoride levels less than 1.5 mg/L.
The estimated population was based on EAs. Because EAs are polygons and not discrete points, the measured Euclidian distance often fell partially within an EA polygon when measuring from a single point (borehole) or linear feature (pipeline). To address this issue, we provided both minimum and maximum population estimates. Minimum estimates were derived from all EAs that fell completely within 2.5 km from a borehole with fluoride levels of 1.5 mg/L or greater and had a pipeline or perennial river within their proximity. Maximum estimates include all EAs that have any part of the EA within 2.5 km distance.
ANOVA
As most planning initiatives in Namibia occur at the level of the region, we tested for regions that have, on average, statistically significant high levels of fluoride in groundwater. We used Analysis of Variance (ANOVA) for that purpose. ANOVA shows difference between groups (e.g., regions) and a given set of indicators (average fluoride level).
RESULTS AND DISCUSSION
Spatial distribution of fluoride concentration in groundwater
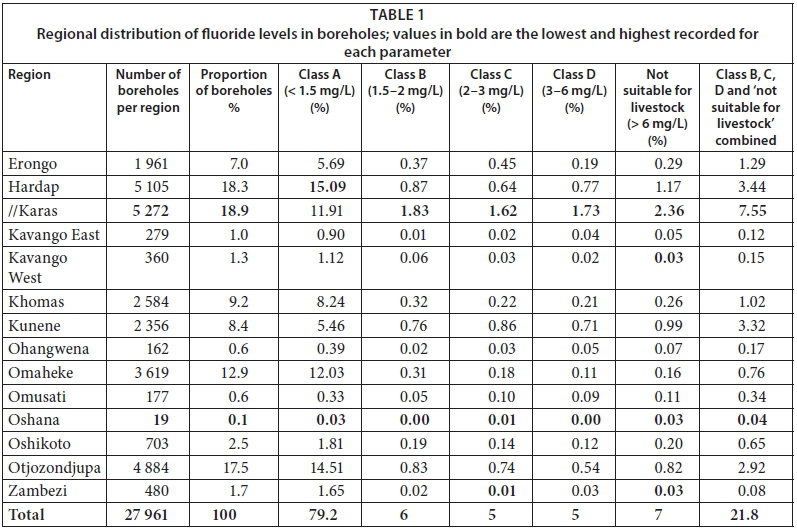
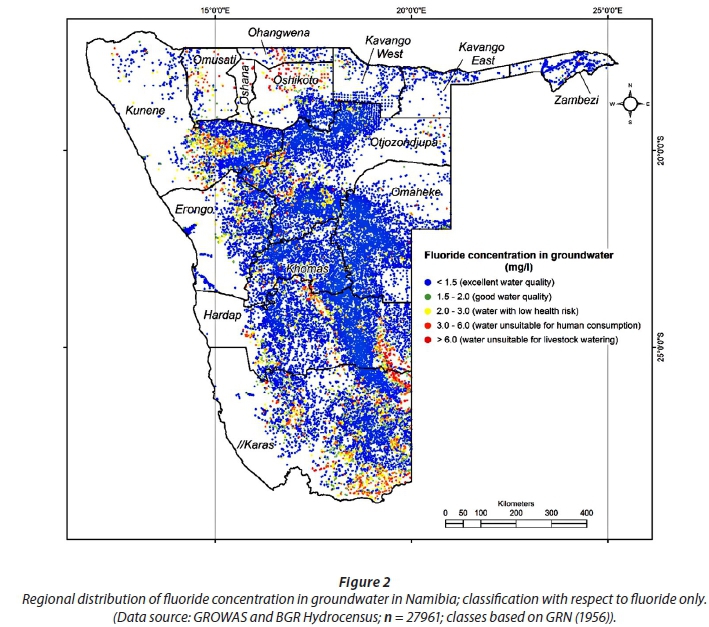
Two-thirds (67%) of the boreholes with a measured fluoride concentration are found in four regions: //Karas (19%), Hardap (18%), Otjozondjupa (18%), and Omaheke (13%) (Table 1). Just under 80% of the boreholes have a fluoride concentration below the recommended threshold (1.5 mg/L). Of the 11% (n = 6 104) of boreholes with fluoride concentrations that exceed 3 mg/L, just over 80% are found in the //Karas (4.1%; n = 1 145), Hardap (1.9%; n = 541), Kunene (1.7%; n = 474), and Otjozondjupa (1.4%; n = 379) regions. However, the Erongo, Oshikoto, Omusati and Ohangwena regions also have areas of high fluoride concentrations (Fig. 2). The highest recorded fluoride concentrations are from Oshikoto (103 mg/L) and Otjozondjupa (100 mg/L), while the minimum value was 0.1 mg/L. There are clusters of significantly low fluoride boreholes in the Khomas, Otjozondjupa, Omaheke, Kavango West and Zambezi regions.
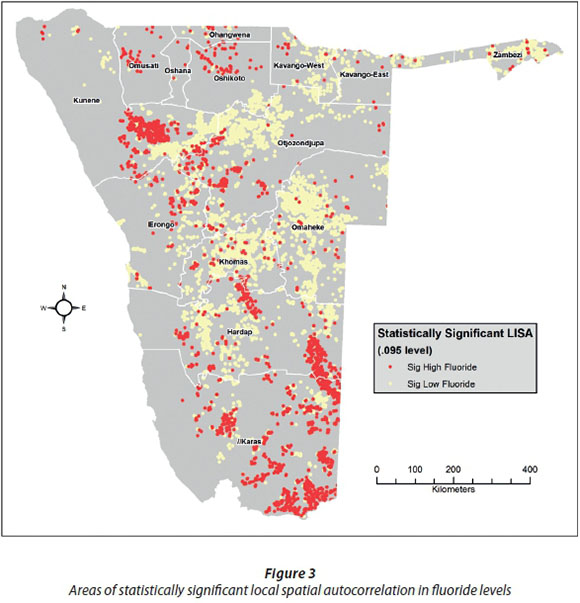
The borehole data revealed a strong, positive (Moran's I test I = 0.46, p = 0.001) spatial autocorrelation. This means that we tend to find the clustering of boreholes relative to their fluoride concentration, i.e., boreholes with high fluoride concentrations cluster near other high-concentration areas and boreholes with lower fluoride levels cluster near other low-fluoride boreholes. This is not that remarkable in itself, but in examining the spatial pattern of the results using the LISA test a number of cluster areas were identified where spatial autocorrelation is statistically significant in the spatial distribution of boreholes with high levels of fluoride (Fig. 3). This is important when examining how this health risk may impact the surrounding populations.
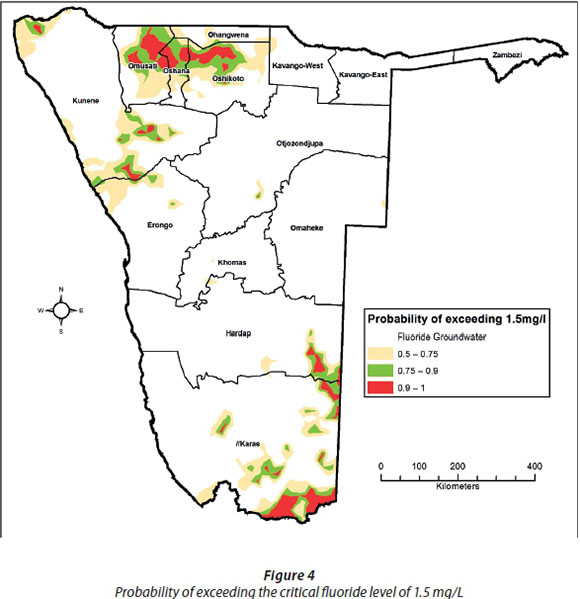
To put this in a greater context we examined this information to identify areas where there was a likely probability of exceeding the critical threshold of 1.5 mg/L fluoride concentration in groundwater. Using indicator kriging, approximately 40% (332 573 km2) of Namibia's surface area has a 0.5 or greater probability of high fluoride in the groundwater. North-central Namibia, which is also the most densely populated area of the country, falls in that category (Fig. 4).
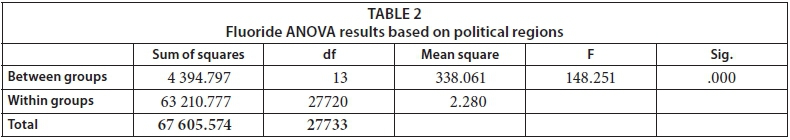
The ANOVA results (Table 2) show that there is a significant difference in groundwater fluoridisation between regions (F = 148.251, p = 0.000), based on borehole data. Additionally, employing a Tukey HSD post-hoc test to examine where the differences are most apparent, shows that Oshana and Omusati have significantly higher fluoride levels than the other regions of Namibia (Table 3). This result is significant at the p = 0.05 level. One issue to be considered in these results is that there are fewer boreholes in Oshana and Omusati because much of the population in these regions has access to piped water. Although //Karas is not significantly different to several other regions, it does have an average fluoride level exceeding 1.5 mg/L based on 5 272 boreholes.
Boreholes with significant fluoride content occur in areas dominated by one of three different types of geologic materials: (i) unconsolidated and semi-consolidated sand and gravel with calcrete (//Karas, Hardap, Omusati, Ohangwena and Oshikoto); (ii) granite and gneiss (Kunene); and (iii) certain (Karoo and younger) volcanic rocks (Hardap) (Christelis and Struckmeier, 2001). Most of the boreholes in Ohangwena, Oshikoto, Hardap and //Karas are located in the largest and most productive aquifers (Oshivelo and Stampriet) in the country (Mendelsohn et al., 2002), and those with elevated fluoride content are located around the central parts of these basins. The high values observed at these boreholes can thus be associated with longer residence time in the aquifer and extended reaction times with aquifer material (see Su et al. 2015). In addition, much of the //Karas and Hardap regions are characterized by low precipitation (less than 250 mm/a), high potential evaporation (as high as 3 800 mm/a) and boreholes depths in excess of 150 m. This is consistent with Handa (1975) and Vasak (1992), who linked high fluoride concentration in groundwater to deep aquifer systems, low hydraulic gradients, low groundwater recharge and a slow groundwater flow rate.
Other boreholes with elevated fluoride content are also associated with geologic sources. Most of the fluoride-contaminated zones worldwide occur in granite terrains (Chae et al., 2006) or in sedimentary aquifers that contain fluoride-bearing minerals usually derived from granites. In sedimentary aquifers, the larger contact interfaces of the previously physically weathered parent rocks allow for enhanced fluorine release during subsequent chemical weathering, especially in arid and semi-arid environments (Edmunds, 1994; Edmunds and Smedley, 2005). In addition, elevated fluoride concentrations are found in alkaline rock (1 200-8 500 ppm), deep sea clay (1 300 ppm), low-calcium granite (850 ppm), shale (740 ppm), deep sea carbonate (540 ppm), high-calcium granite (520 ppm), and sandstone (270 ppm) (NEERI, 1985). These geological settings and rock types are typical in areas of high fluoride concentration in Namibia, especially in the Kunene and Hardap regions.
Population at risk for high fluoride concentration in groundwater
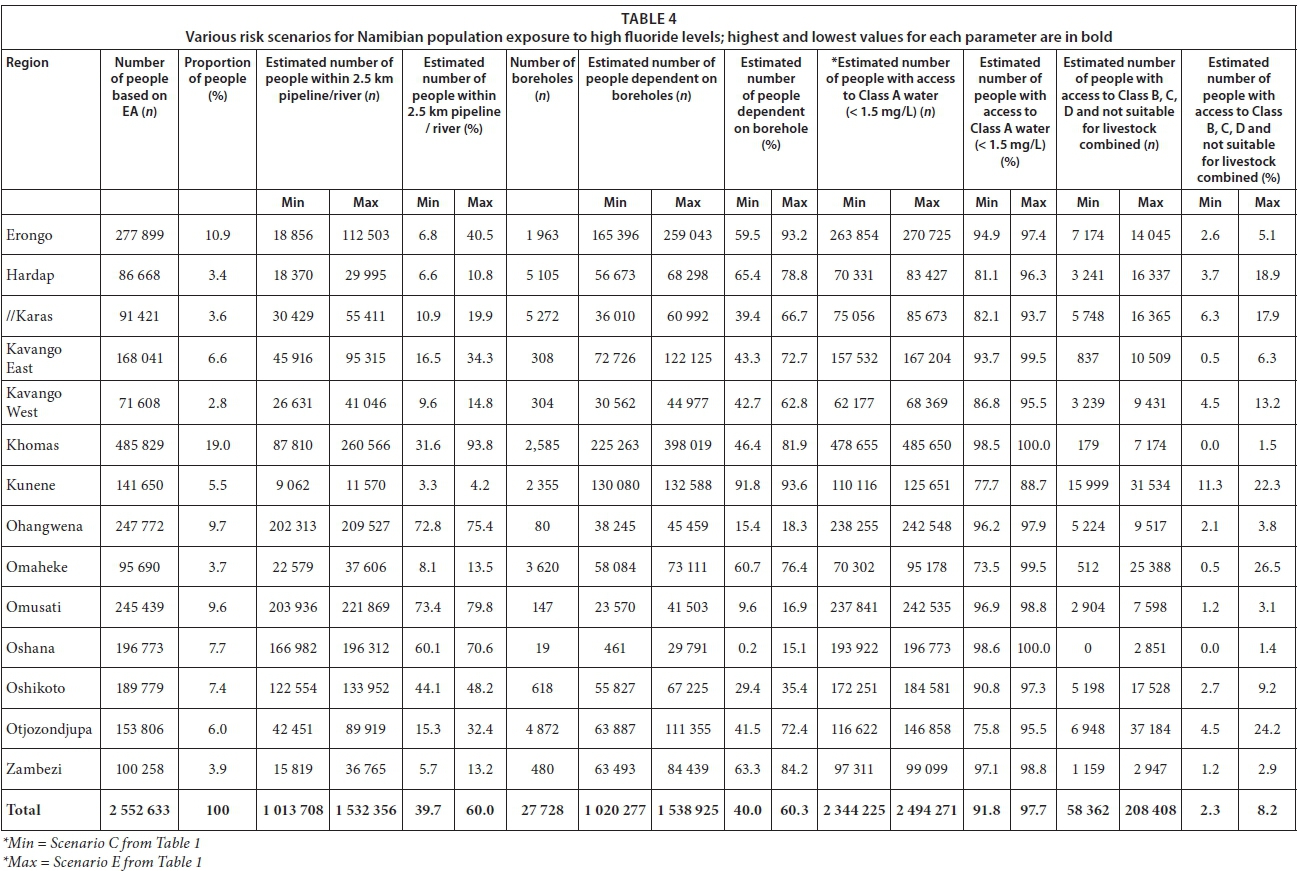
The distance analysis that included population data from the census and fluoride data from both boreholes and pipeline/river water sources shows that, at a minimum, 2.3% of the Namibian population (58 000 people; Table 4) is exposed to drinking water with fluoride levels exceeding the recommended limit of 1.5 mg/L. This number is most likely higher, with a potential maximum of 8.2% of the population (208 000 people) who are at risk of using drinking water drawn from 22% (n = 6 104) of the boreholes (Table 1, right-hand column).
The spatial pattern of areas with a higher risk of exposure to high fluoride concentration in drinking water shows that these are predominantly found in the Kunene, //Karas, Hardap, Omusati, and Erongo regions (Fig. 5). In terms of the minimum number of people at risk, however, the Otjozondjupa, Ohangwena and Oshikoto regions surpassed Omusati by a factor of nearly 2 or more (Table 4). This is partly because much of the affected area in Omusati is more sparsely populated or falls within the Etosha National Park.

Kunene is by far the most affected region, with a minimum of 11% and a maximum of 22% of its population at risk. In contrast, Oshana and Khomas are the regions least at risk for the consumption of high concentrations of fluoride (less than 1.5% of their populations), partly due to greater access to treated water. Results further show that there are significant differences in fluoride levels when aggregated at the regional level. Tukey's HSD test shows Oshana, Oshikoto, Omusati, and Ohangwena as regions well above the mean. Communities in the eastern half of Ohangwena have been reported to show symptoms of light to medium fluorosis (Wanke et al., 2013).
CONCLUSIONS
A combination of spatial statistics and GIS analyses reveal that a fifth of the boreholes in at least a third of Namibia's 14 political regions have a fluoride content above the WHO recommendation of 1.5 mg/L. These boreholes occur in areas dominated by unconsolidated and semi-consolidated sand and gravel with calcrete in places; sedimentary aquifers with fluoride-bearing minerals derived from granite parent rocks; or in the lower parts of regional groundwater flow systems away from the basin margins, towards the central parts of the basin. Collectively, this attributed the origin of elevated fluoride content in drinking water to geogenic sources, coupled with climatic and hydrogeological factors.
The estimated number of people at risk in Namibia of having high fluoride concentrations in their drinking water (between 50 000 and 208 000 persons) is relatively small when compared with a global figure of more than 200 million. However, Namibia has a slightly higher percentage of its population (up to 8%) at risk than other countries where this is an issue. For example, India, with the highest number of people (about 70 million) affected, has about 6% of its population at risk for high fluoride content in drinking water. This study reveals that fluoride content in Namibia's drinking water is a significant problem that needs addressing. The need is particularly pressing in arid or semi-arid parts of the country, such as the Kunene, //Karas and Hardap regions, as well as in the more densely populated Ohangwena region where symptoms of light to medium fluorosis have already been documented.
UNICEF and WHO (2015) revealed that 9% of the Namibian population has no access to an improved water source. This figure is comparable to the 8% of the population exposed to water with high fluoride concentration derived in this study. However, the notion of 'improved water source' refers to management issues, such as borehole installations which protect water sources from microbial contamination. More specifically, it does not include aspects related to water quality such as the fluoride content resulting from geogenic sources. Although the areas affected by both access to improved water source and water quality may spatially overlap, it is likely that the total number of people affected is much higher than 9% of the population when both factors are taken into consideration.
This study used fluoride levels in potable water as an example for estimating the number of people at risk in Namibia. We are not aware of a similar study in the sub-continent, particularly in neighbouring countries, where cross-border water management is essential, partly due to shared aquifers and transboundary perennial rivers. It is necessary to assess all water quality parameters, including nitrate and total dissolved solids, in relation to the population affected at both the national and sub-regional scales.
ACKNOWLEDGEMENTS
We thank the Namibian Ministry of Agriculture, Water and Forestry and the Bundesanstalt für Geowissenschaften und Rohstoffe, Germany, for providing us with data from the GROWAS database and the Hydrocensus for the Cuvelai Etosha Basin, respectively. The Namibia Statistics Agency kindly provided the 2011 Census data, which is greatly appreciated. Valuable comments were received from two anonymous reviewers and the editor, and we thank them with gratitude.
REFERENCES
AMINI M, MUELLER K, ABBASPOURK, ROSENBERG T, AFYUNI M, MØLLER KN, SARR M and JOHNSON CA (2008) Statistical modeling of global geogenic fluoride contamination in groundwaters. Environ. Sci. Technol. 42 (10) 3662-3668. https://doi.org/10.1021/es071958y [ Links ]
AMUTENYA DPK (2012) Fluoride distribution in Namibia's groundwater and identification of possible sources. Honours thesis, University of Namibia. [ Links ]
ANSELIN L (1995) Local indicators of spatial association-LISA. Geogr. Anal. 27 (2) 93-115. https://doi.org/10.1111/j.1538-4632.1995.tb00338.x [ Links ]
ARLAPPA N, AATIF QURESHI I and SRINIVAS R (2013) Fluorosis in India: an overview. Int. J. Res. Dev. Health 1 (2) 97-102. [ Links ]
BRUNT R, VASAK L and GRIFFIOEN J (2004) Fluoride in groundwater: Probability of occurrence of excessive concentration on global scale. International Groundwater Resources Assessment Centre Report nr. SP 2004-2. URL: https://www.un-igrac.org/download/file/fid/263 (Accessed 12 April 2015). [ Links ]
CHAE GT, YUN ST, KWON MJ, KIM YS and MAYER, B (2006) Batch dissolution of granite and biotite in water: Implication for fluorine geochemistry in groundwater. Geochem. J. 40 95-102. https://doi.org/10.2343/geochemj.40.95 [ Links ]
CHRISTELIS G and STRUCKMEIER W (2001) Groundwater in Namibia. Ministry of Agriculture, Water and Rural Development, Windhoek. 128 pp. [ Links ]
DEY S and GIRI B (2016) Fluoride fact on human health and health problems: A review. Med. Clin. Rev. 2 (1:11) 1-6. https://doi.org/10.21767/2471-299x.1000011 [ Links ]
DIAZ-BARRIGO F, NAVARRO-QUEZADA A, GRIJALVA MI, GRIMALDO M, LOYOLA-RODRIGUEZ JP and ORTIZ MD (1997) Endemic fluorosis in Mexico. Fluoride 30 (4) 233-239. [ Links ]
EDMUNDS WM (1994) Characterization of groundwaters in semi-arid and arid zones using minor elements. In: Nash N and Mccall GJH (eds.) Groundwater Quality. Chapman and Hall, New York. [ Links ]
EDMUNDS WM and SMEDLEY PL (2005) Fluoride in natural waters. In: Selenisu O (ed.) Essentials of Medical Geology: Impacts of the Natural Environment on Public Health. Academic Press, Amsterdam and London. [ Links ]
GHOSH D, DAS SARKAR S, MAITI R, JANA D and DAS UB (2002) Testicular toxicity in sodium fluoride treated rats: association with oxidative stress. Reprod. Toxicol. 16 385-390. https://doi.org/10.1016/s0890-6238(02)00038-2 [ Links ]
GRN (Government of the Republic of Namibia) (1956) Water Act no 54. Republic of Namibia, Windhoek. 83 pp. [ Links ]
GRN (Government of the Republic of Namibia) (2004) 10 Years: Directorate of Rural Water Supply 1993-2003. Ministry of Agriculture, Water and Rural Development, Windhoek. 91 pp. [ Links ]
GRN (Government of the Republic of Namibia) (2012) Fourth National Development Plan (NDP3). National Planning Commission, Windhoek. 132 pp. [ Links ]
HANDA BK (1975) Geochemistry and genesis of fluoride-containing groundwaters in India. Groundwater 13 (3) 275-281. https://doi.org/10.1111/j.1745-6584.1975.tb03086.x [ Links ]
IZQUIERDO-VEGA JA, SÁNCHEZ-GUTIÉRREZ M and DEL RAZO LM (2008) Decreased in vitro fertility in male rats exposed to fluoride-induced oxidative stress damage and mitochondrial transmembrane potential loss. Toxicol. Appl. Pharmacol. 230 352-357. https://doi.org/10.1016/j.taap.2008.03.008 [ Links ]
JESU A and DHEENADAYALAN M (2013) A study of ground water quality and its impact fluoride with the relevance of dental fluorosis at Vedasandur, Dindigul District. World J. Pharm. Sci. 2 (6) 6437-6447. [ Links ]
KUNDU N, PANIGRAHI MK, TRIPATHY S, MUNSHI S, POWELL MA and HART BR (2001) Geochemical appraisal of fluoride contamination of groundwater in the Nayagarh District of Orrissa. Indian Environ. Geol. 41 451-460. https://doi.org/10.1007/s002540100414 [ Links ]
LIPTZIN D and SILVER WL (2015) Spatial patterns in oxygen and redox sensitive biogeochemistry in tropical forest soils. Ecosphere 6 (11) 211-214. https://doi.org/10.1890/ES14-00309.1 [ Links ]
LIU C, JANG C and LIAO C (2004) Evaluation of arsenic contamination potential using indicator kriging in the Yun-Lin aquifer (Taiwan). Sci. Total Environ. 321 (1) 173-188. https://doi.org/10.1016/j.scitotenv.2003.09.002 [ Links ]
LU Y, SUN ZR, WU LN, WANG X, LU W and LIU SS (2000) Effect of high-fluoride water on intelligence in children. Fluoride 33 (2) 74-78. [ Links ]
MENDELSOHN J, JARVIS A, ROBERTS C and ROBERTSON T (2002) Atlas of Namibia: A Portrait of the Land and its People. David Philip Publishers, Cape Town. 200 pp. [ Links ]
MILLER RMCG (2008a) The Geology of Namibia: Archaean to Mesoproterozoic. Ministry of Mines and Energy, Geological Survey of Namibia, Windhoek. 328 pp. [ Links ]
MILLER RMcG (2008b) The Geology of Namibia: Neoproterozoic to Lower Palaeozoic. Ministry of Mines and Energy, Geological Survey of Namibia, Windhoek. 524 pp. [ Links ]
NSA (Namibia Statistics Agency) (2014) Namibia Population and Housing Census 2011. Government of the Republic of Namibia. 60 pp. [ Links ]
NEERI (National Environmental Engineering Research Institute) (1985) Fluoride, its incidence in natural water and de-fluoridation method. National Environmental Engineering Research Institute, India. 86 pp. [ Links ]
PETRUS IN (2012) Factors affecting fluoride concentration in the groundwater in the Cuvelai Etosha Basin and testing of available lab scale defluoridation techniques. Honours thesis, University of Namibia. [ Links ]
SRACEK O, WANKE H, NDAKUNDA NN, MIHALJEVIČ M and BUZEK F (2015) Geochemistry and fluoride levels of geothermal springs in Namibia. J. Geochem. Explor. 148 96-104. https://doi.org/10.1016/j.gexplo.2014.08.012 [ Links ]
SU C, WANG Y, XIE X and ZHU Y (2015) An isotope hydrochemical approach to understand fluoride release into groundwaters of the Datong Basin, Northern China. Environ. Sci. Process Impacts 17 (4) 791-801. https://doi.org/10.1039/C4EM00584H [ Links ]
TEOTIA SPS and TEOTIA M (1988) Endemic skeletal fluorosis: Clinical and radiological variants. Fluoride 21 39-44. [ Links ]
TREASURE ET and DEVER JG (1992) The prevalence of caries in 5-year old children living in fluoridated and non-fluoridated communities in New Zealand. New Zeal. Dent. J. 88 9-13. [ Links ]
UNICEF (2015) Progress on Sanitation and Drinking Water - 2015 update and MDG assessment. URL: http://apps.who.int/iris/bitstream/10665/177752/1/9789241509145_eng.pdf (Accessed 26 June 2015). [ Links ]
VASAK L (1992) Primary sources of fluoride. In: Frencken JE (1992) Endemic Fluorosis in Developing Countries, Causes, Effects and Possible Solutions. Publication number 91.082, NIPG-TNO, Leiden. [ Links ]
WANKE H, MULIKE P, PETRUS I, AMUTENYA D, VAN WYK A, QUNIGER M and LOHE C (2013) Towards a management strategy for fluoride threatened groundwater: A case study from Namibia. GeoGen2013, February 2013, Addis Ababa. [ Links ]
WHO (World Health Organization) (2008) Guidelines for Drinking Water Quality. World Health Organization, Geneva. 668 pp. [ Links ]
WUYI W, RIBANG L, JIANIAN T, KUNLI L, LISHENG Y, HAIRONG L and YONGHUA L (2002) Adsorption and leaching of fluoride in soils of china. Fluoride 35 (2) 122-129. [ Links ]
Received 23 September 2016
Accepted in revised form 12 June 2017
* To whom all correspondence should be addressed. +264 61 206 3655; fax: +264 61 206 3806 e-mail: mhipondoka@unam.na / mhipondoka@yahoo.com

