


Serviços Personalizados
Artigo
 Inglês (pdf)
 Artigo em XML
 Referências do artigo
Indicadores

Links relacionados
-
 Citado por Google
 -
 Similares em Google
Compartilhar

 Permalink
Water SA
versão On-line ISSN 1816-7950
versão impressa ISSN 0378-4738
Water SA vol.43 no.3 Pretoria Jul. 2017
http://dx.doi.org/10.4314/wsa.v43i3.01
Design and implementation of a citizen technician-based suspended sediment monitoring network: Lessons from the Tsitsa River catchment, South Africa
LJ Bannatyne*; KM Rowntree; BW van der Waal; N Nyamela
Geography Department, Rhodes University, PO Box 94, Grahamstown 6140, South Africa
ABSTRACT
Locally resident citizen technicians using basic equipment and Open Data Kit-enabled smartphones have collected flood-focused suspended sediment (SS) samples from 11 sites on the Tsitsa River and its tributaries, in the Eastern Cape Province of South Africa. In the highly degraded and gullied Tsitsa River catchment, existing modelled SS data were unverified and at odds with the results of studies based on dam sedimentation rates. Suspended sediment concentration (SSC), flux and yield data were required at subcatchment scale to support the prioritisation of community-based land rehabilitation initiatives in rural communal areas and to determine the relative contributions of subcatchments to SS yield at the site of the proposed Ntabelanga Dam. Approaches relying on researcher presence and/or installed instrumentation were precluded by cost, study area size, and the risk of equipment theft, vandalism and damage during high flows. Analysis of the quantitative data collected by the citizen technicians allows high-resolution SSC, flux, and yield data to be produced at subcatchment scale, which will be benchmarked by an acoustic SSC probe at a downstream Department of Water and Sanitation gauging weir. Qualitative descriptive and photographic data allows distant researchers to gain a real-time, catchment-wide overview of river and SS levels. This paper outlines the method, benefits and challenges of a direct-sampling approach that has the potential to address spatial and temporal challenges commonly experienced during SS sampling campaigns.
Keywords: Tsitsa River, citizen science, flood sampling, suspended sediment, citizen technician, Open Data Kit, catchment restoration management
INTRODUCTION
In South Africa and globally, agencies involved with catchment management and monitoring require suspended sediment (SS) data to support their decision-making, planning, and interventions. SS fluxes and yields provide insight into the sources, magnitude, and dynamics of catchment soil erosion and loss, but gathering the required long-term, short-timestep hydrological and SS data is a widely-acknowledged challenge that often constrains subsequent data availability and quality. Wren et al. (2000) note that such data may be extremely costly and difficult to acquire, with a reduced expectation of accuracy if flood flows (which move the bulk of the sediment) are not captured.
Budget, human resources, and data requirements exert major influences on the choice of measuring technique (Wren et al., 2000). Both technician- and instrument-based SS monitoring campaigns, including the measurement of turbidity as a surrogate for SS, are often limited either spatially or temporally due to cost. Spatial constraints (e.g. few monitoring sites) may leave sediment sources ill-defined, hampering subsequent decision-making and prioritisation of management interventions. Temporal constraints (e.g. infrequent researcher presence) may result in calendar-based or ad hoc sampling that fails to capture the important but unpredictable high flows, leading to under-estimation of fluxes and yields (Wolman and Miller, 1960; Knighton, 1984; Gordon et al., 2004). These constraints strongly influenced our approach to SS sampling in the Tsitsa River in the Eastern Cape Province of South Africa.
The Tsitsa River is part of the Mzimvubu catchment which lies largely in the communal areas of the former Transkei homeland. It is typified by rolling grassland plateau separated by steep escarpments, with areas of both commercial and indigenous/alien invader forests, crop production, and stock farming on both private and communal land. Land use practices such as continuous grazing and frequent burning exacerbate soil loss and result in high SS loads (Madikizela et al., 2001; Gordon et al., 2013; Van der Waal, 2015). Highly erodible duplex soils are widespread in the catchment, frequently leading to dense, deep, gully networks (Le Roux et al., 2015).
Community-based land restoration initiatives that will help sustain local livelihoods are being coordinated in the catchment by the Department of Environmental Affairs (DEA) National Resource Management (NRM) programme under the auspices of the Ntabelanga and Laleni Environmental Infrastructure Programme (NLEIP). The Department of Water and Sanitation (DWS) is planning the multi-purpose Ntabelanga and Laleni Dam project on the Tsitsa River (Le Roux et al., 2015). Figure 1 shows the location of the main watercourses, gullied areas, and effective catchments of the Ntabelanga and Laleni Dams in relation to the Mzimvubu River and South Africa as a whole.
In common with much of South Africa there is very little SS data for the Tsitsa River. Short-term, calendar-based studies have attempted to correlate catchment conditions to sediment input to channels (Gordon et al., 2013) and to establish baseline water quality conditions including levels of SS (Madikizela and Dye, 2003). Catchment sediment yields have been modelled (Le Roux et al., 2015), but there is uncertainty attached to the results, which differ considerably from those of a study that incorporated dam sedimentation rates (Msadala, 2010). Our sampling campaign was therefore designed in response to recommendations for the monitoring of discharge and SS (Le Roux et al., 2015) to determine the relative SS contributions of the subcatchments to the yield of the Tsitsa River at the site of the Ntabelanga Dam, and to assist NLEIP with the prioritisation of community-based land restoration interventions.
The Tsitsa River catchment is large (~4 000 km2) and distant (550 km) from the research base at Rhodes University, Grahamstown. Many parts of the catchment are rugged and difficult to access. Elevations range from 2 730 m in the north-eastern headwaters of the catchment in the Drakensberg Mountains, to ~600 m towards the confluence with the Mzimvubu. Mean annual rainfall ranges from 1 327 mm in the mountains to 672 mm in the lower plains (Le Roux et al., 2015): rivers are typified by unpredictable and flashy hydrological responses, a wide range of discharges, and significant woody debris loads, leading to a high likelihood of the loss of installed equipment during floods. The sparse network of poorly-maintained dirt roads exacerbates the challenges presented by dispersed study sites and, as in South Africa as a whole, there is a high risk of equipment theft and vandalism.
These conditions, in addition to the high cost of purchasing and maintaining (typically imported) equipment, precluded any catchment-wide instrumented approach to SS monitoring. Ensuring sufficient continuous researcher presence to sample the unpredictable high flows throughout the catchment was impractical. Engaging local residents to take samples, as implemented in the neighbouring Thina catchment (Rowntree et al., 2017) seemed a practical solution to the problem, and would also satisfy the DEA's requirements for government-funded job creation under the NLEIP programme. However, the challenge of ensuring when and how samples were taken at multiple remote sites in a distant catchment was significant, and was coupled with concerns regarding the management of and support to samplers. The realisation that a flexible combination of communication, data reporting and compliance-checking was possible by using software-enabled smartphones led to the decision to develop a citizen-based approach to direct SS sampling. This approach optimised the spatial and temporal design of the sampling campaign by allowing not only more sites to be monitored, but also at sub-daily time-step, with more frequent sampling through flood flows.
Citizen science as a partnership between 'professional' and 'amateur' scientists (Silvertown, 2009) is increasingly advocated as a means to involve local people in data collection. It allows a larger number of participants than the research team alone could provide, and the collection of more data over a wider range than would otherwise be possible (Bonney et al., 2009). The term 'citizen scientist' is typically applied to members of the public who are engaged to collect data or make observations contributing to a scientific study (Bonney et al., 2009), in the process acquiring their own scientific knowledge and capacity for environmental stewardship. Citizen science projects have become easier to implement due to advances in and improved public access to communications and information technology. This technology allows, for example, the capture and transfer of images and other information via mobile phone networks, Internet web-pages, and social media (Silvertown, 2009; Newman et al., 2012). Quality assurance of data collected by citizen scientists is of utmost importance, particularly when the information gathered is to be used in support of environmental management actions and policy decision making (Sheppard and Terveen, 2011). To this end, precise and uncomplicated data collection protocols are essential (Bonney et al., 2009), and clear criteria and best practice must be used to define, measure, implement, and maintain the quality of the data collected (Sheppard and Terveen, 2011). An obligation for supportive supervision and tight data quality control is placed on the researcher, which requires substantial time and commitment throughout the project (Kongo et al., 2010).
Our project aim was to gather channel discharge and suspended sediment concentration (SSC) data in order to provide information to local land rehabilitation and water storage infrastructure projects. In order to achieve this, we identified, engaged and trained individuals to undertake meaningful, regular work according to safety and compliance protocols; to collect samples, record scientific data and use technology; and to responsibly manage their tasks and finances in a rural area where such opportunities are scarce. Whilst the foundational importance of their monitoring work to the scientific endeavour was explained and emphasised to the citizen technicians, the size of the Tsitsa River catchment means that the SS monitoring sites are typically distant from each other and from the land rehabilitation sites; connecting the impact of community-based land rehabilitation interventions to monitored changes in SS levels is unlikely to be demonstrable within the project period. Therefore, we opted for the term 'citizen technician' rather than 'citizen scientist' to emphasise the distinction between our approach of employing local residents to undertake technical work towards a scientific goal, and that of collaborative citizen science projects which aim to build the capacity of communities to identify, solve, and continue to sustainably manage problems through community learning (Silvertown, 2009; Kongo et al., 2010).
This paper describes the design, implementation, benefits and challenges of the citizen technician-based SS sampling campaign that was undertaken in the Tsitsa River catchment, beginning in February 2015. The sampling activities described here took place between December 2015 and July 2016. Sampling is expected to continue throughout the lifespan of the NLEIP project, focusing on monitoring key sources identified during this project phase.
MONITORING PROGRAMME DESIGN
Spatial framework
The sampling programme was designed to define and monitor subcatchment SS sources in the manner described by Collins and Walling (2004). The aim was to determine the relative contribution of the tributary subcatchments to the overall SS load of the Tsitsa River catchment at the site of the proposed Ntabelanga Dam. Eleven sites were established at which channel discharge and SSC were monitored in order to determine SS flux and yield at each site. Six autographic rain gauges were installed throughout the catchment to provide rainfall data.
Effective catchments were defined by placing monitoring sites either above a confluence, or up- and downstream of areas dominated by a specific land type with associated erosion risks (Le Roux et al., 2015). Monitoring sites also needed to be located near to a settlement to enable citizen technicians to access their site.
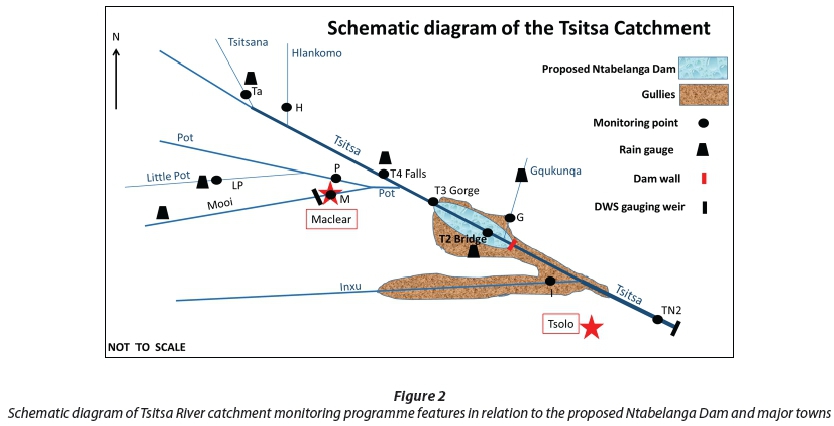
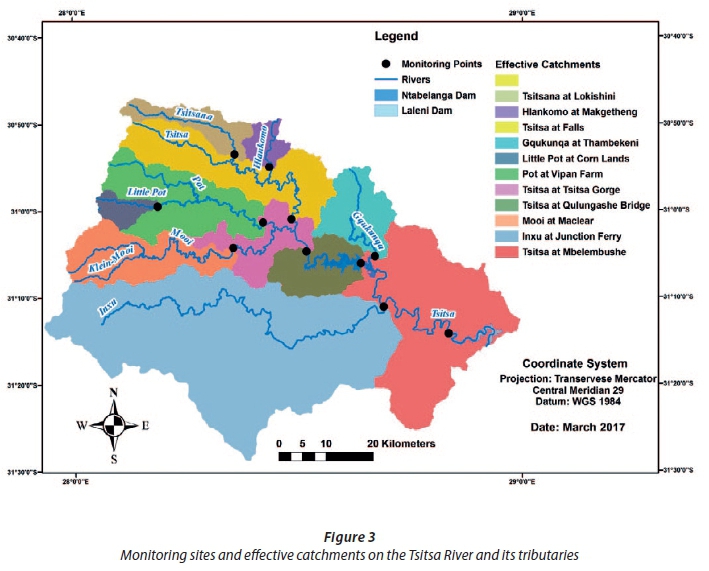
Figure 2 is a schematic diagram depicting the features of the SS monitoring network in relation to the monitored channels and major towns, whilst Figure 3 shows the location of the monitoring sites and their effective catchments. These included the Little Pot catchment at Cornlands (near pristine montane grassland), the Mooi catchment near Maclear (plantation forestry), the Hlankomo and Gqukunqa catchments at Makgetheng and Thambekeni, respectively (communal areas), the Pot catchment at Vipan (commercial farmland) and the Tsitsa River between the gorge and the Qulungashe Bridge (highly gullied and degraded areas).
The DWS gauging sites on the Mooi River at Maclear (T3H009) and on the Tsitsa River downstream of the study area at Xonkonxa (T3H006) were included within the monitoring programme design, whilst Solinst pressure transducers were installed at the remaining nine sites to generate continuous records of water stage (or level) for use in determining discharge. These latter sites were surveyed by the research team at intervals throughout the project to allow the development of stage-discharge rating curves (Gordon et al., 2004).
At reach scale, the monitoring sites were located within easy walking distance of dwellings, and typically featured a safe bank access point, bedrock for the attachment of a pressure transducer, and a stable profile to allow the research team to undertake periodic flow ratings, as well as width- and depth-integrated SS sampling.
An acoustic backscatter SSC probe (LISST ABS) was installed at the DWS gauging station at Xonkonxa to allow the data generated by the citizen technician at that site to be compared against those generated by the probe.
Temporal framework
Seasonality
Figure 4 illustrates that the rainy season (as measured at Maclear) in an average year runs from October to March.

Baseline sampling was continuous throughout the dry-season period of December 2015 - July 2016. Flood sampling occurred in response to high flows that occurred mainly during January and February, and sporadically in March and April, due to the relatively dry El Niño conditions, and an isolated dry-season event of snowfall and heavy rain that triggered flood sampling in late July.
Baseline sampling
Citizen technicians took routine samples that would provide insight into base flow conditions each morning before 11:00 and each afternoon after 14:00, ideally at ~12-hourly intervals. The required presence of the citizen technician at the river twice daily meant that they were more likely to observe the trigger for the commencement of flood sampling, i.e., a rise in water level.
Flood sampling
The design of the temporal monitoring framework was primarily influenced by the well-established fact that SS yield is dominated by flood events (Gordon et al., 2004; Elwell, 1978; Horowitz, 2013). Sampling programme design therefore emphasised hydrology-based sampling (i.e. through flood events) against a background of calendar-based sampling (i.e. at scheduled intervals).
The aim of flood sampling was to define SS flux and peaks by frequent sampling through both limbs of the flood hydrograph. Citizen technicians were given a clear trigger (i.e. water rise) and specific sampling duration of 20 samples to be taken at catchment-specific intervals. Flood sampling could continue in sets of 20 samples throughout daylight hours and even resume the following day if water levels remained high and/or rising.
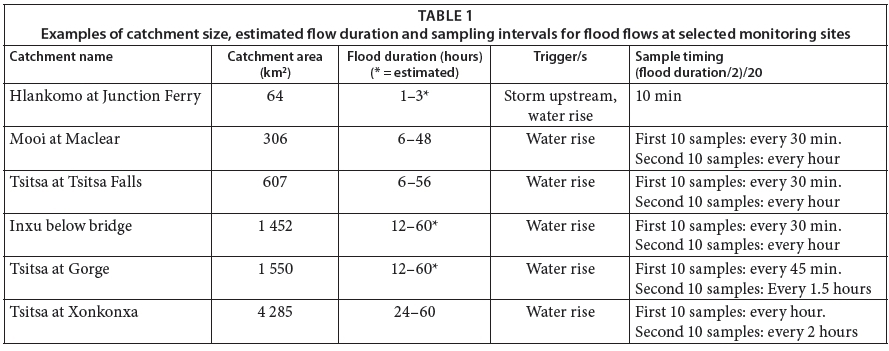
Flood duration predictions were estimated using available DWS discharge data for the Mooi at Maclear (catchment 306 km2) and the most downstream monitoring site on the Tsitsa at Xonkonxa (effective catchment 4 285 km2). Estimates for the remaining, ungauged catchments were made using the effective catchment size above the monitoring site as a surrogate for discharge (Gordon et al., 2004). Specific sampling intervals were then derived for each monitoring site that would allow 20 consecutive samples to effectively represent the hydrograph (including the recession limb) of those 'workhorse' floods that in a typical year would move most of the SS (Wolman and Miller, 1960). Table 1 summarises the effective catchment size, estimated flood durations and resulting sample intervals at selected monitoring sites.
Citizen technicians
Identification and recruitment
Potential citizen technicians were identified and recruited in early December 2015. In some instances, people living close to the monitoring sites in the communal areas or working on commercial farms in the privately-owned areas were directly approached by researchers. In other instances, chiefs, headmen or farmers were approached for assistance with identifying potential citizen scientists. Through conversation and by asking people to fill in a form with their contact details and other information, their availability, ability to communicate effectively, their level of literacy and numeracy, and their ability to tell time, use a smartphone and plan for sampling a flood event were gauged. Local access to a cellular phone network and to secure phone charging facilities were also established.
Where possible, a principal and a 'stand-in' citizen technician were engaged to ensure that sampling would continue through inevitable absences. A memorandum of agreement was signed with each principal citizen technician to ensure that each party was fully aware of their role and obligations.
Training
The safety of the citizen technicians whilst undertaking sampling was at all times the foremost concern. Citizen technicians were forbidden to sample at night or to enter the water under any circumstances. Safety training included awareness of bank and river conditions, the need for and correct use of a lifejacket, prohibition on both the use of alcohol and the presence of children during sampling activities, and the safe handling of equipment.
Citizen technicians were then trained to collect SS samples and geo-referenced photographic, numerical and descriptive data using the supplied equipment and customised Open Data Kit (ODK) forms loaded onto smartphones. Citizen technicians were not involved with width and depth integrated sampling or with flow gauging.
Sampling equipment
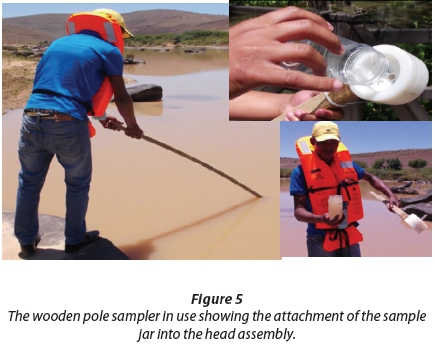
The citizen technicians were provided with a lifejacket and combination of basic water sampling equipment (2-m wooden sampling poles and 450 mL plastic jars; 2-L plastic milk bottles with lead fishing weights; GroundTruth clarity tubes, stationery, rubber boots and rain-suits) and state-of-the-art technology (GPS-enabled smartphones in a waterproof, transparent, touch-sensitive waterproof pouch; Android operating-system, airtime and data bundles; ODK software).
The 2-m pole-and-jar isokinetic samplers allow water to enter the sampling vessel without disturbing the flow of the stream or influencing the SSC in the resulting sample due to either pumping or turbulence (Edwards and Glysson, 1999; Horowitz, 2013). A protruding 5 mm aperture inlet pipe in the head of the pole leads to a 450 mL sample jar, with an outlet breather tube to allow air to escape from the sample jar (Gordon et al., 2004). Arguably the sample vessels were, at 450 mL, smaller than ideal (Gordon et al., 2004). However, it was known from a previous short-term study (Madikizela and Dye, 2003) that very high SSCs could be expected during target flood events, thus offsetting the practical and logistical implications of larger samples aimed at lower concentrations. Figure 5 depicts the pole-and-jar sampler in use, with a close-up of the head assembly featuring a fixed jar lid (with intake pipe and breather tube outlet), into which the plastic sample jar is secured.
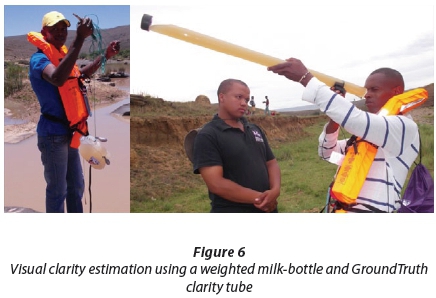
The weighted plastic milk bottles were used to collect a 2-L water sample which was then poured into the clarity tube (manufactured by South African company GroundTruth). Citizen technicians estimated visual clarity by noting the point at which a Secchi disk drawn down the clarity tube by means of a magnet became visible. Figure 6 shows the weighted milk bottle and GroundTruth clarity tube in use. The visual clarity measurements provided a rough check on laboratory analysis, and gave the citizen technicians a direct indication of how SS was changing through time.
Open Data Kit and KoBo Toolbox
ODK was selected as the platform for the collection and transmission of data from sites around the Tsitsa River catchment to the research base in Grahamstown. ODK is a smartphone and computer-based suite of tools and applications (Anokwa et al., 2009) that was developed with the aim of enabling users in developing countries to collect, transmit, store and use data easily and cheaply. ODK Collect effectively replaces paper forms with a smartphone for field data collection, allowing data to be sent through the mobile network to ODK Aggregate, an online database hosted by Google which allows data to be exported to other platforms for mapping and analysis. KoBo Toolbox (Harvard Humanitarian Initiative, 2016) provides a similar platform and was used for creating the data collection forms. The smartphones were enabled for data collection using the workflow depicted in Fig. 7.

Sampling protocol
The citizen technicians were guided through a fixed sampling protocol by the ODK form loaded onto their smartphones. Using touch-screen technology, all the required responses were multiple choice-style button selections: with the exception of the clarity tube readings and sample number, no typing was required. Each section of the form (beginning with a safety check and ending with saving and sending the form) needed a response and was thus recorded on the database. In this way, the form not only captured data and information but also ensured safety awareness and compliance with sampling protocols. As a back-up, the citizen technicians also recorded sample dates and times in a notebook.
Starting at a safe, pre-identified position above highest water mark at their sampling site, citizen technicians first indicated that they were wearing a lifejacket, not using alcohol, had no children present, and that bank conditions were safe. They then made a basic weather report. A river report regarding the level and apparent 'muddiness' of the water, and including a date- and time-stamped photo of the river plus a GPS reading followed. The river photograph always captured the same view that included 'tell-tales' identified during training to indicate river level, e.g. prominent rocks, bars, or vegetation. The photograph and GPS reading together evidenced that the citizen technician was compliant in terms of their location and timing of sampling.
A series of prompts then guided the citizen technicians to take visual clarity readings, label a jar, take a water sample, and dose it with an algaecide pill (17 mg sodium dichloroisocyanurate) before closing the jar. The SS sample was taken by lowering and raising the jar on the sampling pole through as much of the water column as the citizen technician could safely reach, in order to obtain a depth-integrated point sample. The importance of sampling the entire water column (not just the surface) without touching the river bottom was emphasised.
Finally, a time- and date-stamped photo was taken of the jar with the label clearly visible, to capture the temporal details of the sample. The time at which each ODK Collect form was opened and closed was also recorded. Completed forms were then saved by ODK Collect to the smartphone memory and, ideally, immediately transmitted to the receiving ODK Aggregate database using the cellular network. Connectivity issues occasionally delayed or even prevented the transmission of ODK forms; however, they were routinely downloaded from phone memory to a field computer during administrative visits, effectively backing up the recorded data. The sample jars were then stored indoors until collection. Information received from the Tsitsa River catchment by the ODK Aggregate database was immediately available to researchers in Grahamstown.
Management and administration
Collection of the SS samples and downloading the saved forms from the smartphones was undertaken at 3- to 5-week intervals by a research administrator during routine visits to the citizen technicians' homes to provide support, resupply sampling equipment, and resolve any quality-control or performance issues as revealed by checking the ODK Aggregate database changes since the last visit.
The citizen technicians were paid at a rate of R20 per baseline and R30 per flood sample. Remuneration did not require on-site presence: The number of samples taken by each citizen technician during the pay period was ascertained remotely using the ODK Aggregate database and confirmed by text message to their smartphones. Money was paid electronically directly into bank accounts or else by post-office transfer.
Data products and early results
By the end of the first wet season (December 2015 - July 2016), ~4 000 SS samples and associated information had been received from the 11 citizen technicians.
Quantitative data
Quantitative data generated from each site comprised visual clarity data, SSC derived by evaporation, electrical conductivity (EC), and measured turbidity derived from laboratory analysis of the water samples. This was supplemented by continuous depth data from Solinst pressure transducers installed at nine sites, discharge data from the two DWS gauging stations, and 5-min rainfall data from the six rain gauges installed throughout the catchment. A range of flow measurements and width- and depth-integrated SSC data collected by researchers (to calibrate the single-point depth-integrated samples collected by citizen technicians) were also available for each site.
A laboratory process flow (Fig. 8) was developed to implement, track, and manage sample analysis. In line with the approach to field sampling, and with a view to the wider application of the method, basic analytical techniques were selected. Predominantly fine particle sizes, lengthy filtration times, and the potential for inaccuracy whilst transferring and filtering samples, as well as for cross contamination whilst drying filter papers, led to the selection of an evaporation method for determining SSC. For visibly high sediment samples (~> 200 ntu), the determination of SSC by settling, supernatant removal and oven evaporation was carried out in the original sample jars. Turbidity was used as a surrogate in visibly low sediment samples (~< 200 ntu). A relationship between turbidity-tested and evaporated results was established for each site. Extensive EC analysis revealed that the percentage of dissolved solids to SS was negligible at all sites.

Whilst SSC data were available within 6 to 12 weeks of sampling (allowing for collection and settling), SS flux and yield data for most stations were typically delayed until the water-depth data required to determine channel discharge from pressure transducers could be downloaded during dry-season low-flow periods. An exception is the Tsitsa near the N2 (at Xonkonxa), where mean hourly discharge data were available from the DWS gauging station. An example of results from an early flood is depicted in Fig. 9, which shows SSC and SS flux. Figure 9 shows that the citizen technician-based method effectively captured SSC through the high flows. As observed in other systems (Evans and Davies, 1998), SSC and SS flux appear to peak ahead of discharge at the highest flow.

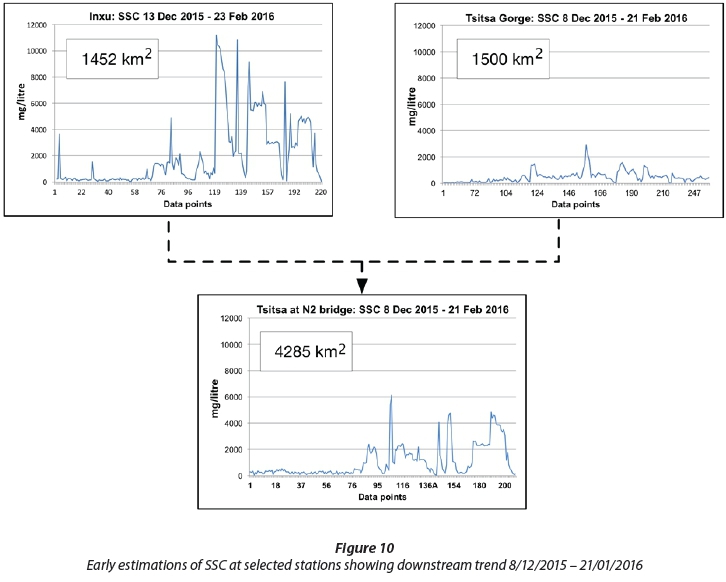
The graphs in Fig. 10 showing SSC data for selected stations reveal that the relatively low SSC levels at the outlet of the Tsitsa Gorge (T3) are greatly augmented by sediment supplied to the Tsitsa from the Inxu catchment. The similarity in catchment sizes means that flow is unlikely to be responsible for this contrast. SSC measured at the outlet of the study area at the N2 Bridge (Xonkonxa) both echoes the SSC peaks from the Inxu and displays the effects of dilution from the Tsitsa.
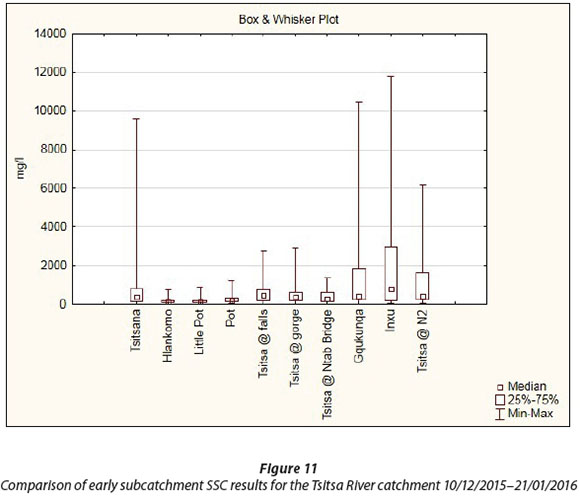
A comparison of available SSC results in Fig. 11 allows an early, though cautious, indication of the relative contribution of subcatchments if, again, catchment size is taken into account: although SSCs are similar, the contribution of the 1 452 km2 Inxu is relatively far greater than that of the 204 km2 Gqukunqa.
Qualitative information
Qualitative information is available to the researcher in real time, immediately after it has been sent from a smartphone in the Tsitsa River catchment to the ODK Aggregate database in Grahamstown. Qualitative information from each site comprised time- and date-stamped photographic records of the river and of each sample taken at the point and time of sampling, and a weather report. These products, together with the visual clarity data, gave an accessible real-time indication of river stage and turbidity. Figures 12 a and b are composite images of this information depicting points in a flood sequence with a time slider along the top margin and a representation of the clarity tube to the right. The sample taken at that time is inset.
A series of such composites for single or multiple sites allows a rudimentary visual interpretation through a flood flow. This may indicate the progression of discharge and sediment through the catchment, the occurrence of one or more hydrological peaks, SS peaks preceding or following the hydrological peak, or water and SS levels remaining high or returning to base level. If collected water samples were lost or their analysis delayed, this record would still relay valuable channel discharge and SS flux information to the catchment manager or researcher.
BENEFITS AND CHALLENGES OF THE CITIZEN TECHNICIAN-BASED APPROACH
Benefits to the sampling campaign
The potential benefits offered by a citizen technician-based approach strongly influenced its selection over other SS sampling methods such as the use of trained technicians, or the widespread installation of equipment for turbidity/SSC monitoring or water sampling. During the first 6 months of sampling considerable financial, spatial and temporal benefits accrued to the project to the extent that the method has been adopted for a related study by Nyamela of the sediment dynamics of the Inxu catchment.
Financial benefits
It was of significant financial benefit to the project that citizen technicians were local residents. The remuneration they received was on par with local part-time earnings (~R800 per month with no flood flows, plus R600 per flood sampled with no upper limit) yet far below that of a qualified technician or researcher. Accommodation, transport, and incidental costs usually associated with a sampling campaign were avoided since citizen technicians lived locally and walked to their nearby sampling positions, resulting in significant savings.
Spatial sampling benefits
Due to these savings, more people could be engaged in terms of the employment opportunity requirements of this government-funded project. This translated to more sites being included in the programme to optimise the spatial resolution of the sampling campaign, allowing subcatchment-scale sediment provenance to be determined.
Temporal sampling benefits
The citizen technicians were not only well positioned to sample through flood flows but also, due to their local knowledge, likely to be aware of when such floods might occur. This together with their twice-daily presence at the river increased the likelihood of them observing the rise in water level that would trigger rapid high-flow sampling. Citizen technicians typically remained at their sites throughout the entire duration of the flood flow, enhancing the temporal efficiency of the sampling programme. The ability to fully capture the sediment dynamics driven by flood flows represents a major advantage over campaigns where the sampling of flood flows is uncertain.
Benefits to citizen technicians
An in-depth analysis of the socio-economic benefits of the SS sampling campaign to the citizen technicians and their families/communities is beyond the scope of this project. Further, as noted, opportunities to involve the citizen technicians with environmental learning and decision-making based on the scientific outcomes of the study were limited. However, participants in the programme gained valuable experience in the use of technology, record-keeping, problem solving, personal time and financial management, and of working accurately and in compliance with safety and sampling protocols. All of these skills and attributes built their personal capacity to take advantage of other employment opportunities.
Job-creation and poverty alleviation are stated aims of the NLEIP programme. As noted, the citizen technicians were remunerated for their work in accordance with the number of samples taken. The scale of payment was structured to provide a satisfactory rate for the part-time work of baseline sampling, and to reward the protracted effort required (often in adverse weather conditions) of flood sampling. Most citizen technicians were un- or under-employed, with some supplementing their sampling income from other sources, sometimes aided by the money earned through sampling.
Evidence of the financial benefits to the citizen technicians in an area where employment opportunities are scarce was readily observed by researchers when undertaking administrative and support visits. Anecdotally, two of the younger citizen technicians (20- to 30-year-olds) had initially stated their intention to leave for urban centres in search of employment, but decided to remain in the area due to their income from sampling. Another person extended her small catering business by purchasing a refrigerator and extra electricity. Another extended her house and reported that she was now able to maintain her child with relatives in Cape Town to attend High School. Another young person was able to undertake a computer literacy course due to his earnings from sampling, enabling him to later enrol for a diploma course in Cape Town.
Challenges
Management challenges
The time and researcher input required to set up and manage the citizen technician team was not fully anticipated at project inception. In preparation for identification, selection, training and administration of citizen technicians, a body of documentation comprising questionnaires, memoranda of agreement, safety and sampling training material was produced by the researcher. This was foundational to the thorough and successful inception of sampling activities and required careful development in consultation with subject matter experts.
Between 80 and 100 hours per month were required to administer the citizen technicians and to undertake resupply and sample pick-up trips. During the wet season, approx. 800 samples were collected per trip, each typically lasting 7 to 10 days and involving over 2 000 km of travelling by a 4×4 utility vehicle. The initial 2-week payment cycle was extended to monthly intervals after the first 6 months, somewhat reducing the administrative load. This degree of management activity on the part of the researcher eventually led to the allocation of 80 hours per month of a field-administrator's time to the research framework. It is likely that this may result in the creation of a post based in the Tsitsa River catchment, further meeting the goals of local job-creation and capacity-building in the area.
Gaps in data coverage
It was recognised that a proportion of flood flows in the area would occur at night as a result of late afternoon rainfall. With citizen technician safety the key concern, these floods were not sampled, inevitably leading to gaps in the SSC data for the area. The same is true for floods which were concurrent with dangerous weather conditions such as lightning and high winds.
Less easily foreseen were times when events directly affecting the citizen technician themselves led to them being unavailable for varying periods of sampling, although in many but not all cases of absence the 'stand-in' citizen technician took over the sampling tasks. Anecdotally, shorter absences included days spent away from home for shopping and banking, visiting nearby relatives, or attending local authority meetings. Longer absences from sampling were the result of, e.g., the death of a family member leading to absence during the period of mourning; the traditional initiation period in winter; and sangoma (traditional healer) training.
The traditional initiation period for young men during June and July affected sampling more than was expected. This highlights the need for awareness and understanding of social and cultural norms in the project area during monitoring programme design and management. Whilst none of the citizen technicians were themselves initiates, one woman was required to provide food three times daily for young men undergoing initiation nearby, leaving her with too little time to take samples. Another woman was unable to take samples as an initiation school (a temporary camp-like structure) was established near her site, rendering it taboo for females to be present. A third citizen technician missed a period of baseline sampling whilst mentoring his initiate nephew.
Non-availability of power for charging smartphones challenged sampling at times. This occurred sporadically during protracted high-frequency flood-sampling, but was widespread when a rare dry-season flood occurred in July 2016, triggered by heavy snowfalls followed by heavy rain. This event would have provided valuable insight into catchment-wide sediment dynamics under such conditions. Unfortunately, a widespread power blackout occurred, halting sampling and disrupting communication as the smartphone batteries all ran flat. This event prompted the provision of a power bank to each citizen technician which could deliver two full charges to the smartphone during electrical blackouts.
It was hoped that the installation of the acoustic backscatter SSC probe at the most downstream monitoring site would provide benchmarking of the manual sampling and help to bridge some of the data gaps, at least in terms of catchment SS yield. Unfortunately, the probe was destroyed during a lightning storm, and lack of continuity following the departure of one citizen technician and the training of their replacement meant that there was no 'overlapping' data during the brief time that the probe was functional.
Low-confidence data
Low-confidence data were obtained from one citizen technician who was persistently non-compliant both in the timing of sampling and in the manner of sample taking (dipping open-jar samples by hand rather than using the pole to isokinetically sample the water column). Quality control checks (using the ODK Aggregate database) on sampling times and photographs, plus discrepancies in her notebook revealed that she was 'batch sampling', i.e., taking all the samples at once and then processing them using subsequent forms, and 'speed sampling', i.e., taking flood samples serially, but over far too short a time period. The time-and-date-stamped photographs were the key to confirming the problem that researchers had been led to suspect by the series of homogenously sediment- and debris-rich flood samples. This non-compliance persisted over some months despite repeated interventions, eventually leading to the replacement of that individual.
Other challenges
The principal researcher's first language was English, whilst the citizen technicians were mostly first-language IsiXhosa speakers. Although a first-language IsiXhosa speaking colleague assisted with the identification, recruitment and training of the citizen technicians, some minor misunderstandings arose. This highlights the challenges associated with sporadic researcher presence coupled with the intensive transfer of new concepts and tasks to inexperienced recipients over a short time frame across a language barrier. However, such misunderstandings and related minor non-compliance typically decreased as each administrative/resupply visit allowed further explanation and better understanding.
Anecdotally, it was discovered that one citizen technician was correctly undertaking three visual clarity readings but recording the figure '39' regardless of the readings actually obtained. It emerged that they were recording the figure demonstrated during the training session, thinking that their results were wrong. This was resolved by explaining that results were indeed likely to differ, and thus that there could be no wrong answer.
Another person took 20 flood samples, thus receiving a higher rate of pay, from what was demonstrably a low, clear river (evidenced by the photographs taken during the river report). They readily agreed that the river was indeed not flooding at the time, but pointed out that while they were being trained to sample floods, the river had been at a similarly low level and an instruction had been given to 'imagine that the river is flooding: then take 20 samples at 15-minute intervals.' The situation was resolved by offering imaginary payment in return for sampling imaginary floods.
Only one site ultimately had to be abandoned due to difficult socio-economic circumstances leading to repeated cellphone loss, persistent absence, subsequent gaps in data coverage, and inability to resolve these issues via local leadership as well as through individual interventions.
DISCUSSION AND CONCLUSIONS
The data-gathering outcomes of a citizen technician-based SS sampling campaign rest largely on the performance and commitment of the individuals engaged to undertake the work. Their regular presence at their site, ability to recognise the onset and continuation of flood sampling periods, and their compliance with sampling protocols are necessary but potentially highly variable factors that influence the quantity and quality of the resulting data.
Spatial and temporal sampling programme design and set-up requires recognised, scientifically valid procedures. Sites can be selected that fulfil well-established criteria likely to preclude recognised problems associated with monitoring, thus providing relatively stable platforms for consistent collection of accurate data. Thereafter, instruments such as probes, pump samplers, and transducers require only installation and a power supply in order to continuously monitor or sample turbidity, SSC, or water depth 24 h a day and through all flood and weather conditions. Conversely, people are unique, complex, and dynamic. Selecting potential citizen technicians and building their capacity to provide consistent accurate data must be done with insight and care. Continuing support must be individually tailored, and sustained throughout the sampling campaign. The researcher opting for a citizen technician-based approach effectively becomes the manager of a small data-production company. Further, whilst engaging people with the potential to provide a quality product is foundational to the success of the sampling campaign, the necessity to engage people living close to the sampling site effectively narrows the choice of potential candidates. In some instances, individuals must be engaged who have been nominated by local leaders in the absence of any criteria other than physical ability to access the site.
It may appear, therefore, that the use of instrumentation would more efficiently meet the goals of a SS monitoring campaign whilst avoiding the intensive management and administrative input required of researchers by a citizen technician-based approach.
However, the cost of one such (typically imported) item of equipment equates approximately to the annual cost of 11 citizen technicians, severely limiting the spatial resolution of the survey and with no associated benefit to the local economy. To this would need to be added the high cost of robust protective instrument housings, maintenance, and technical support, and the possibility of malfunction, flood damage, vandalism and theft. The destruction by lightning of the turbidity probe installed at the research catchment outlet illustrates the vulnerability of such equipment. Consistently high summer water levels have prevented the defunct probe from being replaced, resulting in the loss of much valuable data. In common with the depth-integrated samples taken by citizen technicians, instrument-generated data also require calibration via width-and-depth integrated sampling by researchers through a range of flow and turbidity conditions (Wren et al., 2000) in order to be considered representative of the channel as a whole. Further, SS data collected by any means lies at best within a 20% error margin (Horowitz, 2013), and typically outside that margin.
The sustainability of collaborative citizen science projects rests heavily on early and continued buy-in and ownership by the communities in which the projects are seated (Kongo et al., 2010). The sustainability of this citizen technician-based SSC sampling campaign rests on three main pillars: the commitment by the funder to continue to support the project; the commitment of the citizen technicians to continue to contribute their time and effort in return; and continued researcher interest in collating and using this valuable (and globally unique) dataset.
In conclusion, the citizen technician-based method implemented in the Tsitsa River catchment is a locally appropriate approach with the potential to provide much-needed catchment-scale, long-term SS data outputs comparable with and in some aspects superior to those resulting from established SS measurement techniques. It has the further important benefit of assisting with a government job-creation programme that results in direct community benefits, whilst offering a cost-effective, data-intensive, and flexible alternative to the use of installed equipment.
ACKNOWLEDGEMENTS
The authors gratefully acknowledge:
•The Department of Environmental Affairs for bursaries and project funding
•The citizen technicians of the Tsitsa River catchment
•The Geography Department of Rhodes University
•The Environmental Sciences Department of Rhodes University
•All those who have assisted with academic, technical, practical and personal support throughout the project
•The two anonymous referees for their insightful and constructive review of the manuscript
REFERENCES
ANOKWA Y, HARTUNG C, BRUNETTE W, BORRIELLO G and LERER A (2009) Open source data collection in the developing world. Computer 42 (10) 97-99. https://doi.org/10.1109/mc.2009.328 [ Links ]
BONNEY R, COOPER CB, DICKINSON J, KELLING S, PHILLIPS T, ROSENBERG KV and SHIRK J (2009) Citizen science: a developing tool for expanding science knowledge and scientific literacy. Bioscience 59 (11) 977-984. https://doi.org/10.1525/bio.2009.59.11.9 [ Links ]
COLLINS A and WALLING D (2004) Documenting catchment suspended sediment sources: problems, approaches and prospects. Prog. Phys. Geogr. 28 (2) 159-196. https://doi.org/10.1191/0309133304pp409ra [ Links ]
ELWELL H (1978) Modelling soil losses in southern Africa. J. Agric. Eng. Res. 23 (2) 117-127. https://doi.org/10.1016/0021-8634(78)90043-4 [ Links ]
EVANS C and DAVIES TD (1998) Causes of concentration/discharge hysteresis and its potential as a tool for analysis of episode hydrochemistry. Water Resour. Res. 34 (1) 129-137. https://doi.org/10.1029/97WR01881 [ Links ]
GORDON AK, NIEDBALLA J and PALMER G (2013) Sediment as a physical water quality stressor on macro-invertebrates: a contribution to the development of a water quality guideline for suspended solids. WRC Report No. 2040/1/13 Water Research Commission, Pretoria. [ Links ]
GORDON ND, MCMAHON TA, FINLAYSON BL, GIPPEL CJ and NATHAN RJ (2004) Stream Hydrology: An Introduction for Ecologists. John Wiley & Sons, Chichester. [ Links ]
HARVARD HUMANITARIAN INITIATIVE (2016) KoBo Toolbox. URL: http://www.kobotoolbox.org (Accessed 3 August 2016). [ Links ]
HOROWITZ AJ (2013) A review of selected inorganic surface water quality-monitoring practices: are we really measuring what we think, and if so, are we doing it right? Environ. Sci. Technol. 47 (6) 2471-2486. https://doi.org/10.1021/es304058q [ Links ]
KNIGHTON D (1984) Fluvial Forms and Processes. Edward Arnold. Inc., New York. [ Links ]
KONGO V, KOSGEI J, JEWITT G and LORENTZ S (2010) Establishment of a catchment monitoring network through a participatory approach in a rural community in South Africa. Hydrol. Earth Syst. Sci. 14 (12) 2507-2525. https://doi.org/10.5194/hess-14-2507-2010 [ Links ]
LE ROUX JJ, BARKER CH, WEEPENER HL, VAN DEN BERG EC and PRETORIUS SN (2015) Sediment yield modelling in the Mzimvubu catchment. WRC Report No. 2243/1/15. Water Research Commission, Pretoria. [ Links ]
MADIKIZELA BR, DYE AH and O'KEEFFE JH (2001) Water quality and faunal studies in the Umzimvubu Catchment, Eastern Cape, with particular emphasis on species as indicators of environmental change. WRC Report No. 716/1/01. Water Research Commission, Pretoria. [ Links ]
MADIKIZELA B and DYE A (2003) Community composition and distribution of macroinvertebrates in the Umzimvubu River, South Africa: a pre-impoundment study. Afr. J. Aquat. Sci. 28 (2) 137-149. https://doi.org/10.2989/16085910309503778 [ Links ]
MOORE NJ (2016) Rainfall erosivity in the Tsitsa Catchment, Eastern Cape, South Africa. BSc (Hons) thesis, Rhodes University. [ Links ]
MSADALA V (2010) Sediment yield prediction for South Africa: 2010 Edition. WRC Report No. 1765/1/10. Water Research Commission, Pretoria. [ Links ]
NEWMAN G, WIGGINS A, CRALL A, GRAHAM E, NEWMAN S and CROWSTON K (2012) The future of citizen science: emerging technologies and shifting paradigms. Front. Ecol. Environ. 10 (6) 298-304. https://doi.org/10.1890/110294 [ Links ]
ROWNTREE KM, VAN DER WAAL BW and PULLEY S (2017) Magnetic susceptibility as a simple tracer for fluvial sediment source ascription during storm events. J. Environ. Manage. 194 54-62. https://doi.org/10.1016/j.jenvman.2016.11.022 [ Links ]
SHEPPARD SA and TERVEEN L (2011) Quality is a verb: The operationalization of data quality in a citizen science community. In: Proc. 7th International Symposium on Wikis and Open Collaboration, 3-9 October 2011, Mountain View, California. 29-38. https://doi.org/10.1145/2038558.2038565 [ Links ]
SILVERTOWN J (2009) A new dawn for citizen science. Trends Ecol. Evol. 24 (9) 467-471. https://doi.org/10.1016/j.tree.2009.03.017 [ Links ]
VAN DER WAAL BW (2015) Sediment connectivity in the Upper Thina Catchment, Eastern Cape, South Africa. PhD thesis, Rhodes University. [ Links ]
WOLMAN MG and MILLER JP (1960) Magnitude and frequency of forces in geomorphic processes. J. Geol. 68 54-74. https://doi.org/10.1086/626637 [ Links ]
WREN D, BARKDOLL B, KUHNLE R and DERROW R (2000) Field techniques for suspended-sediment measurement. J. Hydraul. Eng. 126 (2) 97-104. https://doi.org/10.1061/(ASCE)0733-9429(2000)126:2(97) [ Links ]
Received 15 August 2016
Accepted in revised form 26 May 2017
* To whom all correspondence should be addressed. 0848655154; e-mail: ljforster1@gmail.com

