


Servicios Personalizados
Articulo
 Inglés (pdf)
 Articulo en XML
 Referencias del artículo
Indicadores

Links relacionados
-
 Citado por Google
 -
 Similares en Google
Compartir

 Permalink
Water SA
versión On-line ISSN 1816-7950
versión impresa ISSN 0378-4738
Water SA vol.43 no.2 Pretoria abr. 2017
http://dx.doi.org/10.4314/wsa.v43i2.12
Historical rainfall trends in South Africa: 1921-2015
AC KrugerI, II, *and MP Nxumalo I
IClimate Service, South African Weather Service, Private Bag X097, Pretoria, 0001, South Africa
IIDepartment of Geography, Geoinformatics and Meteorology, Faculty of Natural and Agricultural Sciences, University of Pretoria, South Africa
ABSTRACT
The aim of this study is to update the analysis of historical rainfall trends with reference to the work from previous studies, through optimizing the highest spatial resolution with the longest possible period of analysis, i.e., 1921-2015. Two interlinked datasets, namely the district rainfall and individual rainfall stations datasets were used for the trend analyses, namely, daily time series of 60 individual rainfall stations and the daily district rainfall of 88 of 94 rainfall districts in South Africa. The extreme precipitation indices defined by the World Meteorological Organization Expert Team on Climate Change Detection and Indices were applied. In general, the results show an increase in rainfall for most rainfall stations in the southern interior of South Africa, and indications of decreases in rainfall in the far northern and north-eastern parts. The increase in the annual rainfall in the south is reflected in the seasonal trends, where summer rainfall shows a similar increase, but also extends into the central interior. For other seasons, most of the country shows no significant historical trends in annual total rainfall. From the extreme rainfall analyses, an increase in daily rainfall extremes in the southern to western interior is apparent. Also, most of the country experienced increases in the intensity of daily rainfall, which confirms global results in general. Decreases in rainfall from wet spells were noted in most places over the east and north-east, while the southern and eastern parts along the escarpment experienced shorter annual dry spells. This study improves on previous studies in the region by more than doubling the analysis period, largely eliminating the influence that decadal-scale cycles might have on analyses over shorter periods. However, some differences in the trend results compared to previous studies are apparent, e.g., less pronounced drying in the east and the previously observed increase in rainfall in the western and southern interior not extending as far as the south-western Cape. The observed trends broadly confirm those of projected changes in summer rainfall, i.e., an increase in the west and decrease in the east.
Keywords: rainfall trends, extreme rainfall, climate change, South Africa
INTRODUCTION
Over recent decades, significant changes in the mean state of the climate have occurred over most parts of the globe, particularly for surface temperatures. In contrast to surface temperatures, which show almost consistent upward trends, trends in precipitation were variable across the globe (Donat et al., 2013). These variable trends are of interest to various socio-economic sectors such as agriculture, health, water and natural resource management. In addition to trends in seasonal and annual rainfall totals, of importance in terms of the impact of rainfall are trends in extreme precipitation events.
Various recent studies have acknowledged tendencies of increased extreme precipitation over some parts of South Africa, such as increased annual frequency of very heavy rainfall events in the eastern parts of South Africa from 1906 to 1997 (Groisman et al., 2005), the increased intensity of high rainfall events in the 1961-1990 period compared to 1931-1960 over much of South Africa (Mason et al., 1999), and the increased extreme rainfall index values over eastern parts of South Africa from 1910 to 2004 (Kruger, 2006). These findings confirm those of the global study by Donat et al. (2013), which indicates a general increase of the contribution of extreme daily rainfalls to annual totals, and a strong recent upward trend of the intensity of daily rainfall.
A thorough analysis of these trends is usually restricted by different factors, which may include low and uneven station density over the investigated area, the period of station record, as well as data quality and plausibility. Although South Africa has a relatively extensive station network and long data records, it is still often difficult to detect clear signals of long-term change, particularly those of rainfall which vary considerably in space and time (McKellar et al., 2014). These factors result in any trend calculation being sensitive to the specific location and period of observations. Therefore it is essential to update the analysis of historical rainfall trends on a regular basis. Here we did not only add additional recent data (5 years), but used an analysis period which is much longer than the most recent historical trend study by McKellar et al. (2014), i.e., 1921-2015 vs. 1961-2010, more than doubling the analysis period.
Precipitation variables of interest usually include the mean annual precipitation, the onset and end of rainfall seasons, wet and dry spell duration periods and the occurrence of extreme heavy rainfall events (McKellar et al. 2014). This study intends to use an optimal balance between station density and length of records to derive conclusions about the general trends in annual and seasonal rainfall, as well as extreme rainfall events. For the latter, the analysis was based on extreme precipitation indices developed by the World Meteorological Organization (WMO) Expert Team on Climate Change Detection and Indices (ETCCDI), which is used globally to detect trends in relevant climate extremes (Donat et al., 2013).
METHODS
Data
The determination of rainfall trends was mainly based on the analysis of daily rainfall measurements from individual rainfall or weather stations. At the manual stations, measurements were done at 08:00 SAST, which would indicate the rainfall for the previous day, throughout the study period. The rainfall totals from automatic weather stations were, similarly to manual stations, based on the period 08:00 SAST to 08:00 SAST on the following day. Only stations that were operational throughout the study period were selected, and for which the position has stayed more or less the same. In addition, at least 90% of daily values should have been available, which excludes any accumulated rainfall totals. Due to the substantial distances and the complex nature of rainfall in South Africa, mainly due to the regionally different rainfall-producing mechanisms or systems and the complex topography in some regions, it is difficult to perform proper quality control on rainfall data. However, those cases where zero rainfall was recorded for relatively long periods of time, when surrounding stations recorded significant rainfall amounts, were flagged and removed.
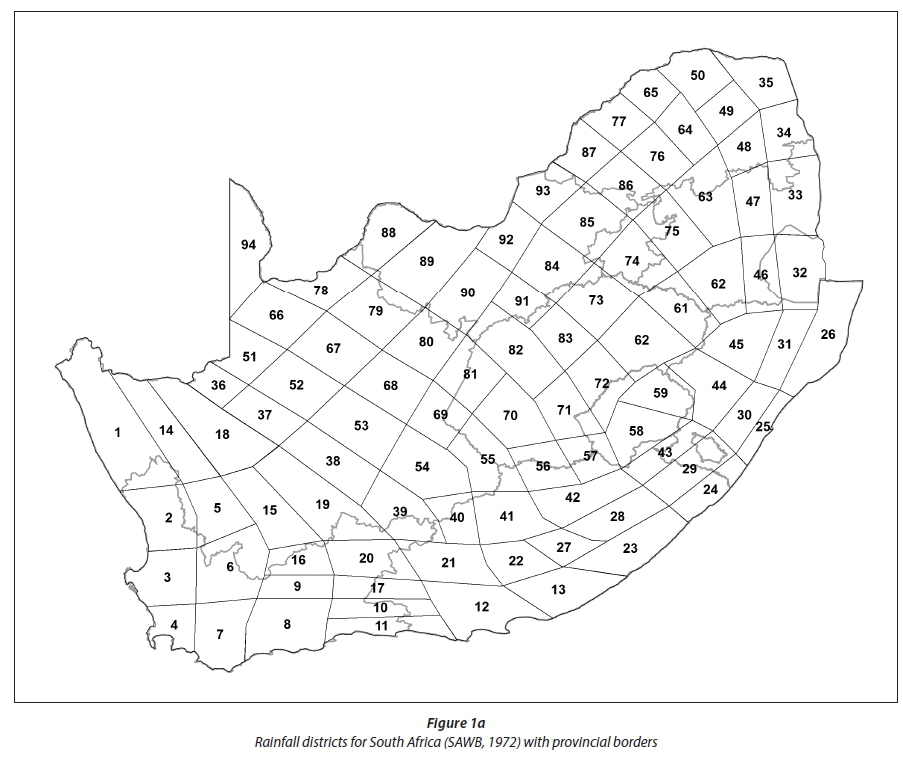
In addition to the data discussed above, the delineation of districts of homogeneous rainfall, as used by the South African Weather Service (SAWS), aided in the attempt to cover as much of the areas with unique rainfall characteristics as possible. South Africa was divided into a total of 94 rainfall districts by SAWS (then the South African Weather Bureau: SAWB, 1972), which are presented in Fig. 1a. The delineation of these districts was mainly done according to the annual march of maximum rainfall, and the boundaries between the winter, whole year and summer rainfall regions. SAWS updates the district rainfall totals on a monthly basis for the period 1921 - present, of which 90 of the 94 districts have rainfall totals available for all months of the period. A daily district rainfall total is calculated as the average of the daily values available in the district. Therefore, it follows that the particular stations used in the calculation of district rainfall values vary through time, more so for those districts with a relatively denser network of stations. Due to the number of stations used, this cannot be effectively shown on a map.
It should be noted that for many rainfall districts the rainfall cannot be considered to be homogeneous across the district, especially in regions with complex topography, e.g., the south-western Cape and along the escarpment. Due to there being different rainfall stations available for analysis at different times of the study period, it is possible that there is a bias in the number of stations in wetter areas over a particular sub-period, while there can be an opposite bias in the number of stations in relatively drier areas in another period, affecting the trend results. For most districts the particular stations used varied through time as stations opened and closed in a particular district. Therefore, it is not advisable to use only district rainfall totals to, in this case, determine historical trends. Therefore, mainly the rainfall records of individual stations was used to determine countrywide trends, with results from the districts used in regions without sufficiently long individual time series, as additional information about regions where some rainfall trends are likely but not conclusive.
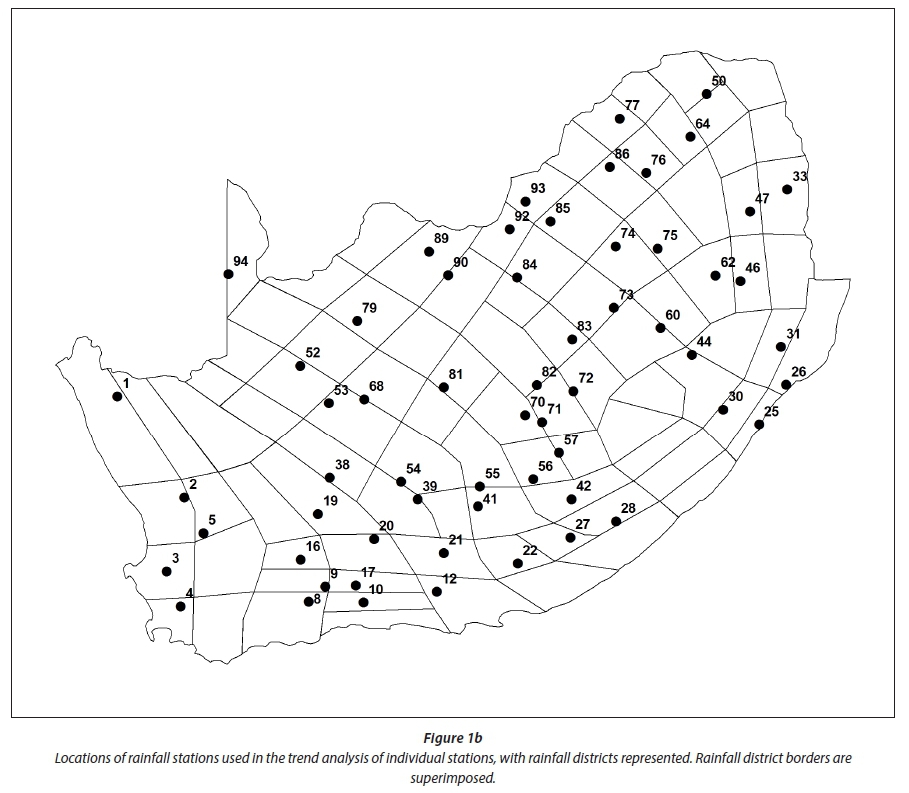
The coverage of most of the rainfall districts with rainfall records of individual stations that remained operational throughout the analysis period should provide an assessment of the ability of the station coverage to capture the tendencies in rainfall across South Africa. A set of near-complete daily datasets was identified using an approach to cover as many rainfall districts as possible for the period 1921-2015, which spans the period of available district rainfall records. For each rainfall district a rainfall station was identified with the most complete record. A total of 60 rainfall districts could be covered with rainfall stations with at least 90% of daily rainfall records available over the period 1921-2015. The locations of the rainfall stations are presented in Fig. 1b. For the trend analysis of annual rainfall, both results of individual station data and district rainfall are presented, to provide an impression of the probable extent of significant trends, particularly in those areas where continuous individual station data are not available for the whole analysis period. These regions include the western interior of the Northern Cape, some coastal areas of the Western Cape, as well as parts of the Eastern Cape, northern KwaZulu-Natal and the extreme north-east.
Analysis methodology
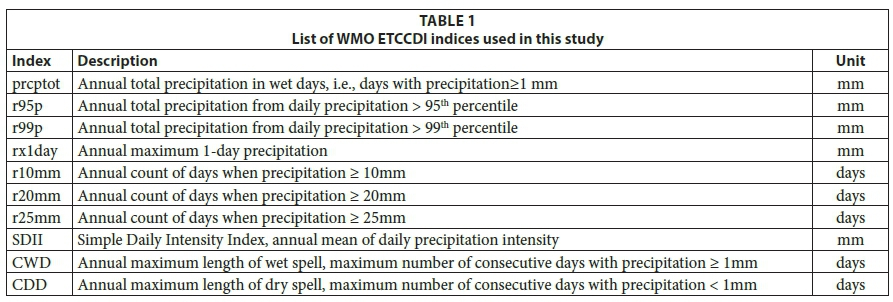
RClimDex is a software package developed under the auspices of the WMO ETCCDI that provides for the calculation of 27 core indices of temperature and rainfall extremes for the detection of changes in the climate (Zhang and Yang, 2004). The relevant 11 precipitation indices utilised in this study, defined by the ETCCDI, are listed in Table 1. The index results are provided at annual and monthly time scales. In addition to the trends from annual values presented, seasonal index values of prcptot, the total rainfall from daily values ≥ 1 mm, and r20mm, the total number of days with rainfall ≥ 20mm, were also determined to obtain an impression of seasonal tendencies in total rainfall and high rainfall events.
The base period, from which the percentiles for the relevant indices were calculated, was defined as 1981-2010, which can be considered to be the present general norm for similar trend studies. The statistical significance of the linear trends of the indices was evaluated by the 2-sided t-test at the 5% level, and assuming Gaussian non-correlation.
RESULTS AND DISCUSSION
Annual total rainfall in wet days
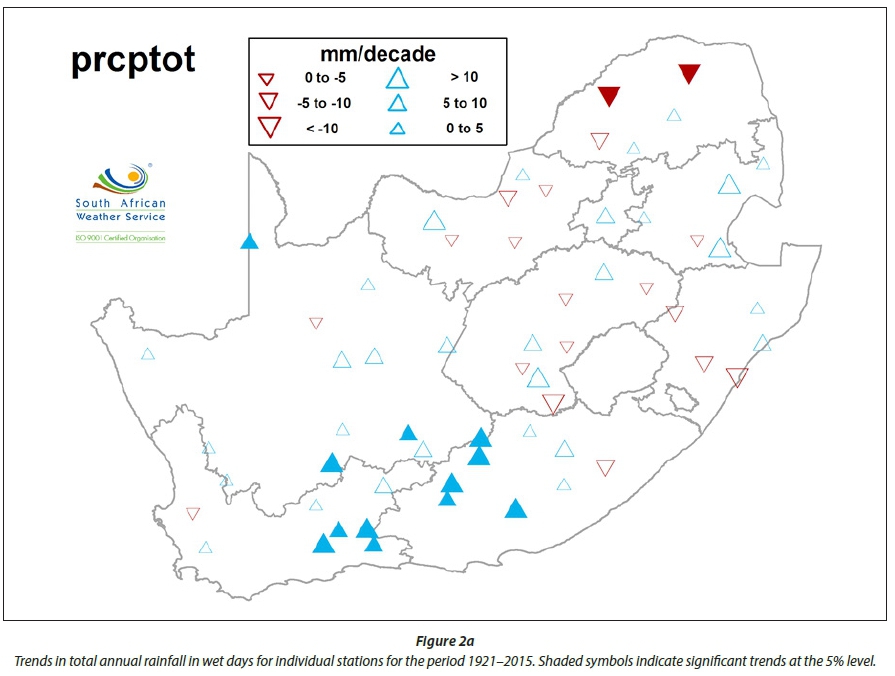
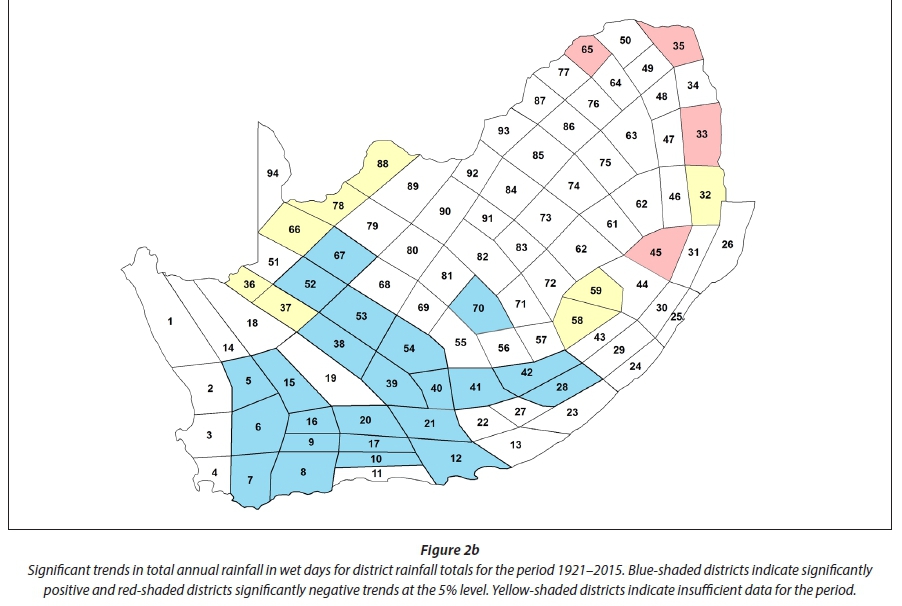
The results in the 1921-2015 trends of the annual rainfall in wet days are presented for the individual rainfall stations and district rainfall in Figs 2a and 2b, respectively. The large conformity between the individual and district rainfall results is apparent, but with some discrepancies. For instance, from the district rainfall results, District 33 has a significant negative trend, while the single long-term station has a non-significant positive trend. However, the most evident result is a positive trend in annual rainfall totals over the southern interior, mostly higher than 5 mm per decade, and probably also to the north into the western interior, as indicated by the district rainfall.
Drier conditions are evident in the extreme north and possibly parts of the north-east, as indicated by the district rainfall results. The results from the district rainfall analysis show, in general, larger footprints of significantly positive and negative trends, which indicate that the positive and negative trends could be more widespread than indicated by the individual stations. However, due to the possible inhomogeneities which might exist in the district rainfall time series and number of stations in the same region with similar trends, one can only infer with certainty that the southern interior became wetter and the extreme north drier.
Seasonal rainfall in wet days
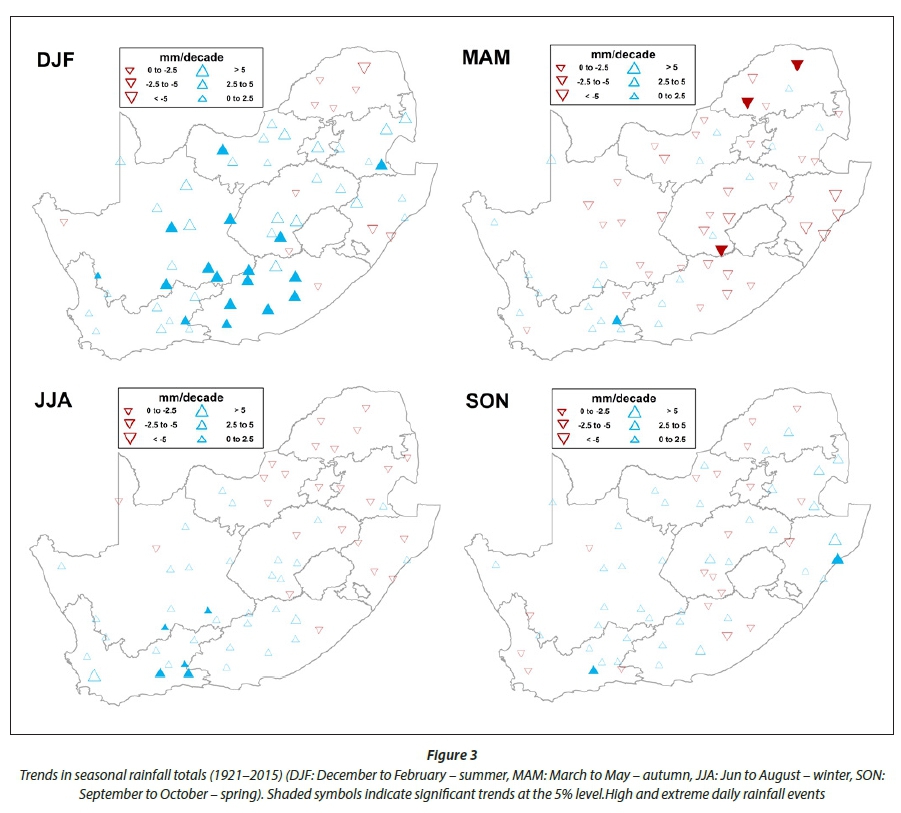
Figure 3 presents the trends in seasonal rainfall totals in wet days. It is clear that the positive trends in annual rainfall totals in the southern and western interior are reflected mostly in the summer rainfall trends, which is the main rainfall season for these particular regions, with significant upward trends of more than 5 mm per decade.
It is also evident that trends in total precipitation for autumn were declining for almost the whole country. However, these decreases are mostly non-significant. The downward trend in annual rainfall in the north-eastern interior is not well defined in the results of the seasonal rainfall, except for 2 stations in Limpopo Province in autumn, with declines of more than 5 mm per decade.
For winter, spatially coherent, but weak, mostly non-significant trends were found, with mostly upward trends in the western half of the country and downward trends in the eastern half.
High and extreme daily rainfall events
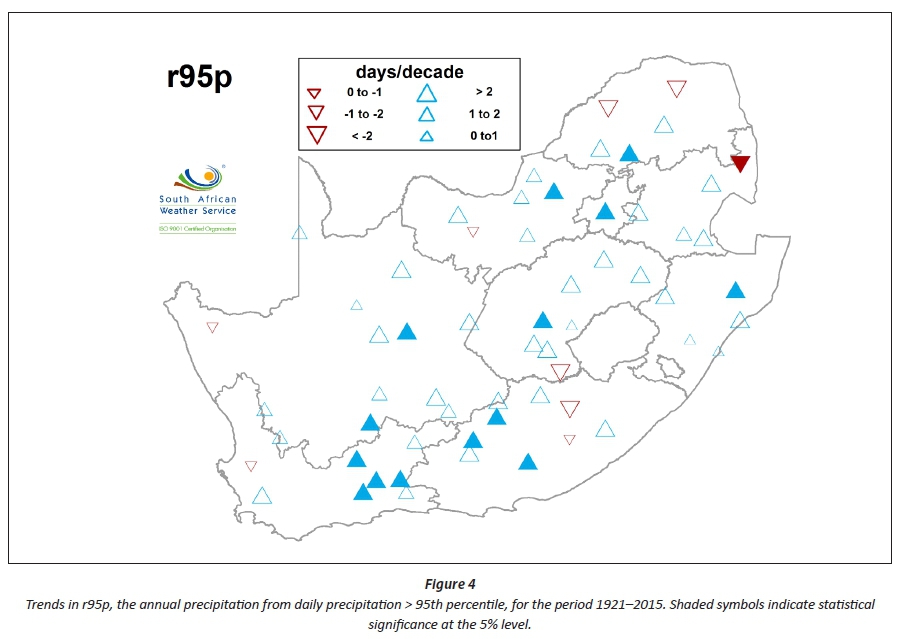
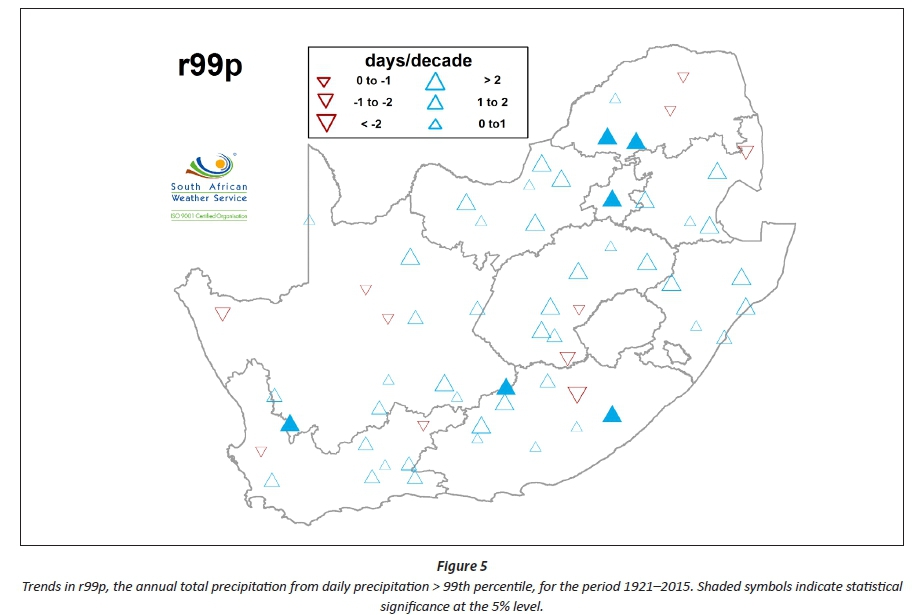
The r95p and r99p indices are calculated to determine trends in daily rainfall extremes, although other indices such as r10mm, r20mm, r25mm and rx1day also provide indications of trends in high and extreme daily rainfall events. The r95p and r99p indices measure the total rainfall per year from days with rainfall above the 95th and 99th percentile daily rainfall total. Generally significant increases in the rainfall, with very high daily rainfall totals in the southern interior, but with significant increases only from some isolated stations in the central and north-eastern interior, are indicated by r95p in Fig. 4. R99p represents the extreme top percentile of wet days. In a typical base period of 30 years (e.g. 1981-2010) one might find, e.g., 1 500 wet days, but this figure will largely depend on the particular climate. For dry climates it will be much fewer than 1 500 and for wetter climates significantly more. R99p calculates the total rainfall for a year from days with rainfall > 99th percentile, i.e., in the above case from the 15 wettest days. For most years the total will be 0, but r99p is still useful as an indication of more extreme daily rainfall conditions that may have occurred, especially outside the base period, and whether these occurrences happened earlier or later during the period analysed. However, it can be noted that most stations in the country show increases in extreme rainfall, although not statistically significant, as shown by both r95p and r99p in Figs 4 and 5.
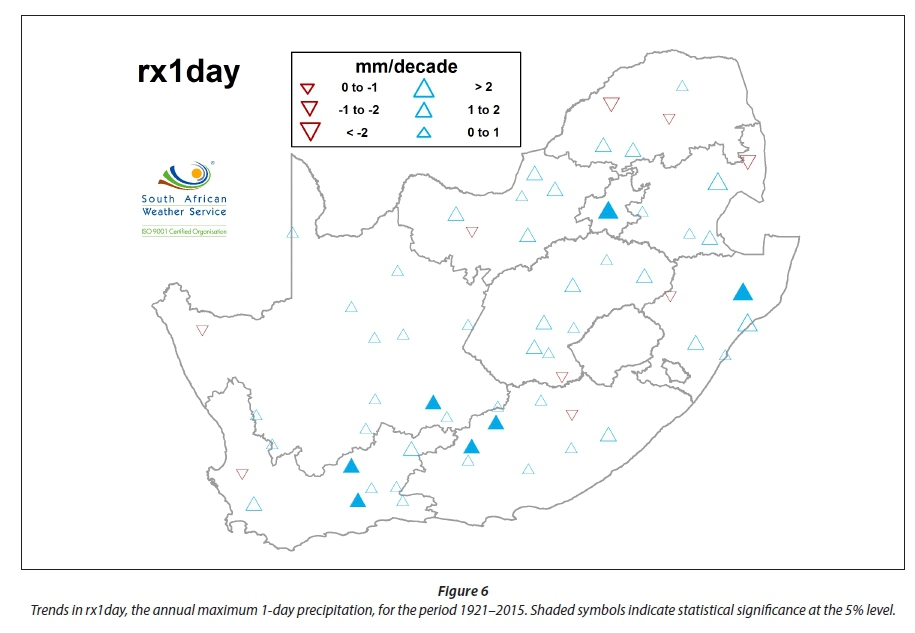
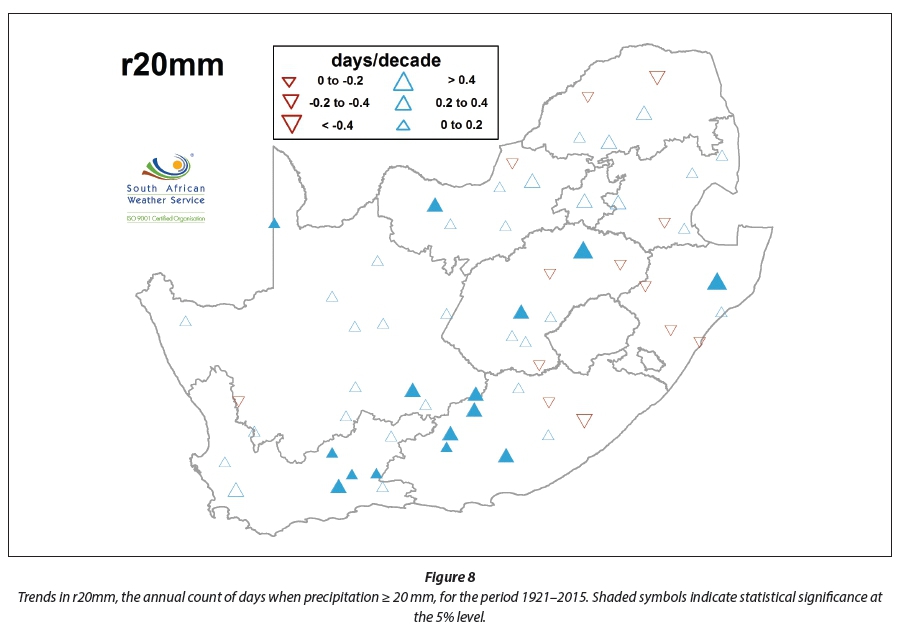
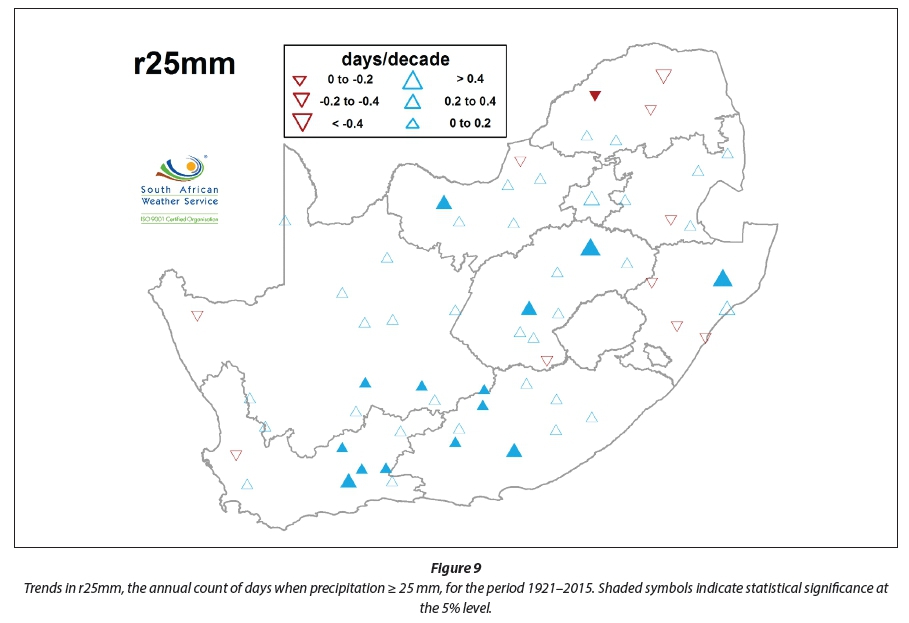
The results of the rx1day index, presented in Fig. 6, indicate whether there are trends in the annual maximum daily rainfall amounts. Results from rx1day were similar to r95p and r99p, with the most spatially coherent results some increases in the southern interior. Similar results are also displayed by the r10mm (Fig. 7), r20mm (Fig. 8) and r25mm (Fig. 9) indices which indicate the number of days per year above 10 mm, 20 mm and 25 mm, respectively. These results all indicate that the increases in the annual rainfall observed in the south and some central parts of the country are at least partially the result of increases in individual high or extreme rainfall events.
High daily rainfall per season
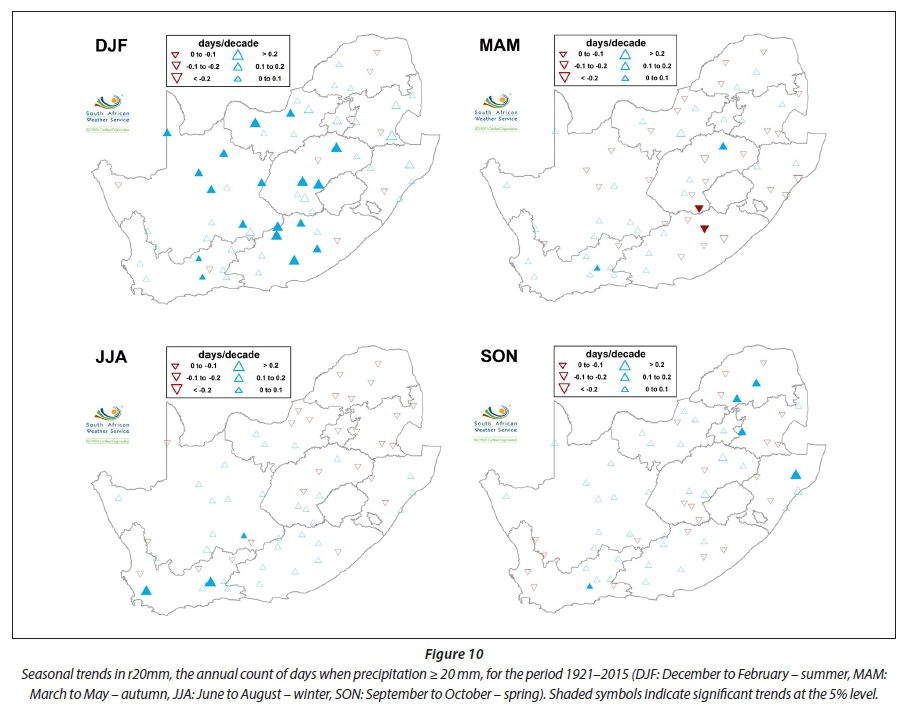
The seasonal trends in r20mm show, as with the seasonal rainfall totals, that the significant annual increases in rainfall in the south and some central parts are at least partly due to significant increases in high daily rainfall episodes during summer, the region's main rainfall season. These increases are in general higher than 0.1 days per decade and for several stations in the central interior (in the Free State, North West and Eastern Cape provinces) higher than 0.2 days per decade.
Apart from summer, the other provinces do not show spatially coherent statistically significant results, except for 4 stations in the north-eastern interior which show significant increases during spring. Also, it seems that during winter there is an increase in high daily rainfall totals in the south-western half of the country, and mostly decreases in the north-east, but these results are mostly statistically non-significant.
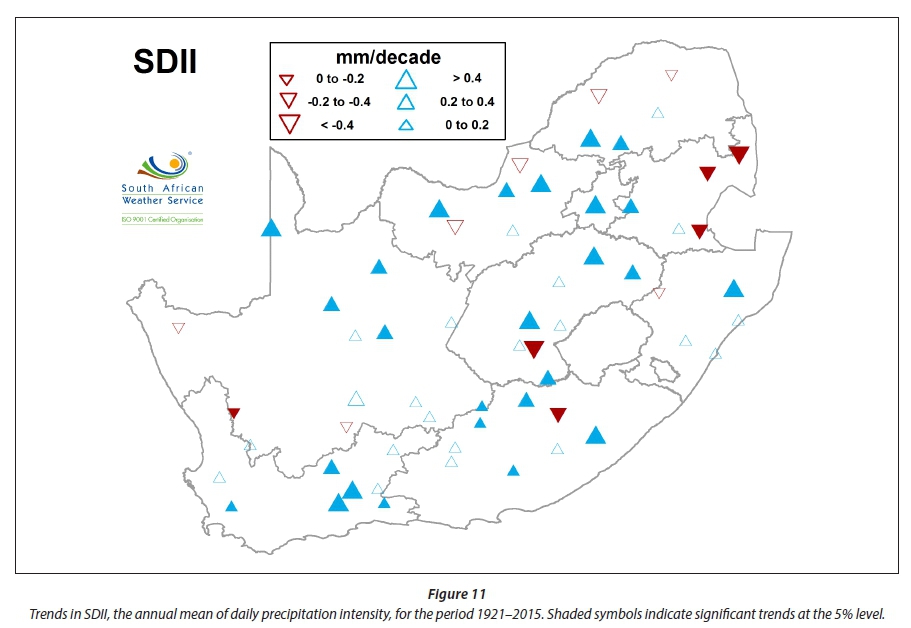
Intensity of daily rainfall
From the results for the high and extreme rainfall indices it is apparent that there are regional tendencies for daily rainfall episodes to become more intense or extreme. The Simple Daily Intensity Index (SDII)) was used to determine the annual average amount of rainfall that is received on a day with rainfall. Significant increases might indicate that the risks of high rainfall of short duration became more prevalent, which in turn indicates a higher probability of related disasters such as flash floods.
From Fig. 11 it is evident that general increases occurred in the daily intensity of rainfall over most of the country, but with some decreases evident in the extreme eastern parts of the country. The results from district rainfall trends (not shown) supported the significant increases in SDII for most districts from the south-western Cape to the central interior. Decreases in SDII were displayed by some districts in the far eastern interior, indicating that in that region some places experienced fewer days per year with relatively high rainfall.
The above results correlate with the general finding that rainfall in many parts of the southern and central interior experienced increases in annual and particularly summer rainfall, while in the extreme east decreases are evident in both annual rainfall and the frequency of high daily rainfall totals.
Intensities of continuous rainfall episodes
The rx5day index determines the highest annual amount of rainfall received in a continuous 5-day episode, which provides an indication of the trend in the intensity of continuous rainfall episodes. The trend results, presented in Fig. 12, indicate that the maximum annual amount of continuous rainfall in a 5-day episode has increased in parts of the southern interior. Most stations in the country show increases, although not statistically significant. Significant changes elsewhere are isolated and therefore no conclusions can be made therefrom in a regional sense.
Longest annual wet spell
The Continuous Wet Days (CWD) index indicates the maximum number of continuous wet days per year. For the south-western Cape the longest annual wet spell usually occurs during winter, while in the remainder of the country it usually falls in summer. Figure 13, which presents the trends in CWD, predominantly shows a decrease in the largest part of the north-eastern half of the country, with some stations indicating statistically significant decreases in excess of 0.2 days per decade. This result corresponds to the decrease in rainfall observed in some of the eastern parts of the country.
For the south-western half of the country the trends are mostly non-significant, except for 3 stations in the Eastern Cape interior, which show significantly positive trends of between 0.1 and 0.2 days per decade.
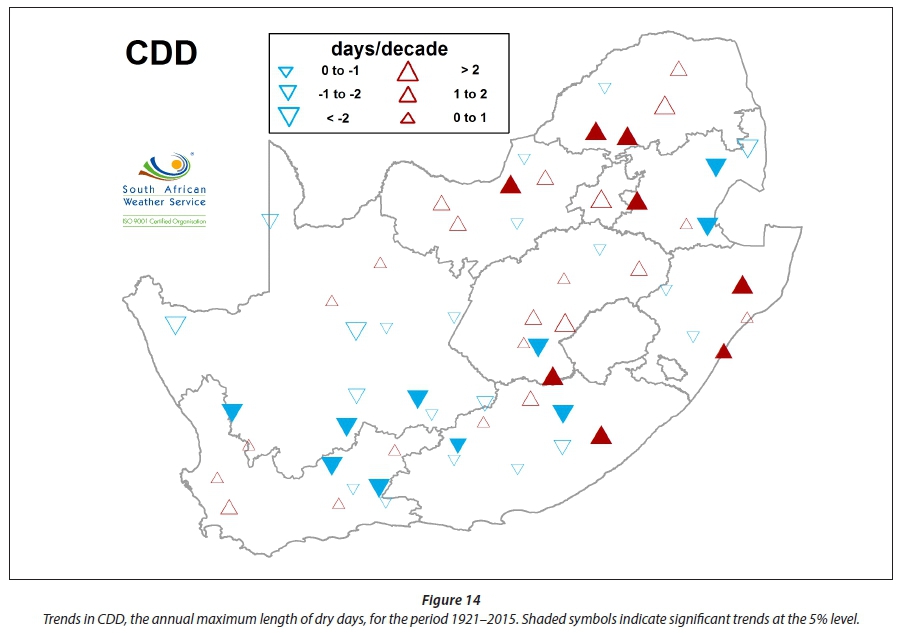
Longest annual dry spell
The Continuous Dry Days (CDD) index defines the length in days of the longest annual period with no significant rain. The definition of the index indicates that this period should fall in the winter months over most of the country, but in the summer months over the south-west where most rainfall is received during winter. Therefore, this mean is essentially a measure of the dry season duration (i.e. in the order of 100 days), rather than a dry spell in a synoptic meteorological sense (i.e. in the order of 10 days). While most of the north-eastern half of the country indicated a decrease in the longest annual period of wet days, and the south-western half mostly an increase, the opposite applies for the annual maximum period of dry days. However, it is mostly the stations along the escarpment which show significant decreases in CDD. This could indicate that there might be a historical long-term increase in the annual period when there is sufficient influx of moisture from the ocean over the adjacent interior to produce rainfall along the escarpment, as this is the main source of rainfall for these areas.
SUMMARY AND CONCLUSIONS
The most prominent finding from the rainfall trend analysis for the period 1921-2015 is the increase in rainfall over the west of South Africa, particularly in the southern interior, but also decreases in rainfall in some places in the far north-east. Although both this study and that of McKellar et al. (2014) agree on the identified increases in the west, this study and that of Kruger (2006) do not extend the increases to the south-western Cape. Kruger (2006) even indicated some significant decreases along the southern Cape coast. Decreases in the east are more pronounced in the study by McKellar et al. (2014) which could indicate that decreases in the rainfall in this particular area have become more pronounced and significant during recent decades, especially in autumn, since the latter study focuses on more recent decades.
The second important observation, apart from the general trends in the rainfall, is that most of South Africa underwent increases in the intensity of daily rainfall, confirming the results of McKellar et al. (2014). However, all of the relevant regional studies show that very high daily rainfall totals have mostly increased in the southern and south-eastern interior with some variations displayed in the spatial extent of the significant trends. This regional increase in rainfall intensity is also shown on a global scale, where most regions examined by Donat et al. (2013) showed an increase in the R95p index, particularly since the early 1930s. We have shown that the daily intensity of rainfall has increased significantly for many stations in South Africa, which is also reflected by the Donat et al. study, where it is observed that since the mid-1990s there has been a strong upward global trend.
Thirdly, most places in the east showed significant decreases in long spells of continuous rainfall while in the southern interior the longest annual dry spells, which mostly occur during winter months, have shortened.
The results of the historical rainfall trends analysis broadly confirm those of projected changes (DEA, 2013), with an increase in summer rainfall in the western interior and decrease in the east. However, the projected increase in spring rainfall over South Africa is not evident in the historical trend results.
ACKNOWLEDGEMENTS
The authors acknowledge the inputs from members of the CSIR-led consortium for the Department of Environmental Affairs project for Chapter 3 of the Third National Communication on Climate Change, for which the research was mainly conducted - to update the existing information on historical climate trends in South Africa.
REFERENCES
DEA (Department of Environmental Affairs, South Africa) (2013) Long-Term Adaptation Scenarios Flagship Research Programme (LTAS) for South Africa. Climate Trends and Scenarios for South Africa. DEA, Pretoria. [ Links ]
DONAT MG, ALEXANDER LV, YANG H, DURRE I, VOSE R, DUNN RJH, WILLETT KM, AGUILAR E, BRUNET M, CAESAR J and co-authors (2013) Updated analyses of temperature and precipitation extreme indices since the beginning of the twentieth century: the HadEX2 dataset. J. Geophys. Res. Atmos. 118 2098-2118. [ Links ]
EASTERLING DR, EVANS JL, GROISMAN PY, KARL TR, KUNKEL KE and AMBENJE P (2000) Observed variability and trends in extreme climate events: A brief review. B. Am. Meteorol. Soc. 81 (3) 417-425. https://doi.org/10.1175/1520-0477(2000)081<0417:OVATIE>2.3.CO;2 [ Links ]
GROISMAN PY, KNIGHT RW, EASTERLING DR, KARL TR, HEGERL GC and RAZUVAEV VN (2005) Trends in intense precipitation in the climate record. J Clim. 18 (9) 1326-1350. https://doi.org/10.1175/JCLI3339.1 [ Links ]
KRUGER AC (2006) Observed trends in daily precipitation indices in South Africa: 1910-2004. Int. J. Climatol. 26 (15) 2275-2285. [ Links ]
MASON SJ, WAYLEN PR, MIMMACK GM, RAJARATNAM B and HARRISON JM (1999) Changes in extreme rainfall events in South Africa. Clim. Change. 41 (2) 249-257. https://doi.org/10.1023/A:1005450924499 [ Links ]
MCKELLAR N, NEW M and JACK C (2014) Observed and modelled trends in rainfall and temperature for South Africa: 1960-2010. S. Afr. J. Sci. 110 (7/8). [ Links ]
NEW M, HEWITSON B, STEPHENSON DB, TSIGA A, KRUGER A, MANHIQUE A, GOMEZ B, COELHO CAS, MASISI DN, KULULANGA E, MBAMBAKLALA E, ADESINA F, SALEH H, KANYANGA J, ADOSI J, BULANE L, FORTUNATA L, MDOKA ML and LAJOIE R (2009) Evidence of trends in daily climate extremes over southern and west Africa. J. Geophys. Res. 111 (D14). [ Links ]
SAWB (South African Weather Bureau) (1972) WB35. Climate of South Africa. Part 10. District Rainfall for South Africa and the Annual March of Rainfall over Southern Africa. South African Weather Bureau, Pretoria. [ Links ]
ZHANG X and YANG F (2004) RClimDex (1.0):Manual. Environment Canada, Ontario, Canada. [ Links ]
Received 16 September 2016
Accepted in revised form 22 March 2017
* To whom all correspondence should be addressed. Tel: 012 367 6074; e-mail: Andries.Kruger@weathersa.co.za

