


Servicios Personalizados
Articulo
 Inglés (pdf)
 Articulo en XML
 Referencias del artículo
Indicadores

Links relacionados
-
 Citado por Google
 -
 Similares en Google
Compartir

 Permalink
Water SA
versión On-line ISSN 1816-7950
versión impresa ISSN 0378-4738
Water SA vol.43 no.2 Pretoria abr. 2017
http://dx.doi.org/10.4314/wsa.v43i2.08
Application of the activated sludge model to aerated lagoons
GvR Marais; GA Ekama*; MC Wentzel
Water Research Group, Department of Civil Engineering, University of Cape Town, Rondebosch, Cape South Africa
ABSTRACT
The different kinds of aerated lagoons, which exclude anaerobic pre-treatment ponds, are described and the design approach for aerated lagoons is explained. This hinges around ensuring that the 1st lagoon is suspension mixed and the second and any additional are facultative. Selection of the retention time for the 1st lagoon is important to ensure complete utilization of the influent biodegradable organics. Minimum retention times to achieve this at 14°C and 22°C were determined with the general activated sludge kinetic simulation model for (i) readily biodegradable soluble organics (BSO) only, (ii) slowly biodegradable particulate organics (BPO) only, (iii) real municipal wastewater (20% BSO and 80% BPO) and (iv) real municipal wastewater with 5% OHO active VSS mass seed. The minimum hydraulic retention times for these four cases are: at 14°C 1.3, 3.0, 2.0 and 1.5 d, respectively, and at 22°C 0.3, 2.0, 1.2 and 1.0 d, respectively. From a comparison of the simulation results with the steady-state model calculations, washout of OHOs takes place at about 75% of these retention times. Approximate equations to estimate the power requirements for aeration by mechanical surface aerators and mixing are given. These equations are combined with those of the steady-state activated sludge lagoon model for calculating the oxygen requirements and the aeration power density (W/m3) in each lagoon. With these equations, it is shown that influent COD concentration needs to be between an upper and lower limit band to ensure that the 1st lagoon is suspension mixed and the second lagoon is facultative. This COD concentration band decreases as the influent flow increases. The important conclusion arising from this is that if the aerated lagoon system is applied for small rural communities, where land for these large systems is likely to be available, then additional mixing energy above that for aeration will need to be provided to ensure that the 1st lagoon is suspension mixed - this additional aeration cost makes it unlikely that aerated lagoons will be applied for municipal wastewater treatment. Matching mixing and aeration power requirements for industrial organic wastewaters is easier because these usually are significantly stronger than municipal wastewaters.
INTRODUCTION
The lagoon system of wastewater treatment covers a spectrum of clearly definable systems differentiated by the degree of mixing and the method of oxygenation. At the one extreme is the oxidation pond, in which the mixing is totally dependent on natural conditions, mainly the wind, and oxygenation is almost entirely due to photosynthesis. The maximum load on the pond and its response to this is largely dictated by the prevailing environmental conditions. At the other extreme is the suspension mixed aerated lagoon, in which both mixing and oxygenation are provided by technological means which give the greatest degree of control over the system. Both the maximum loading and the response to this can be quantitatively estimated. Intermediate systems are defined by the degree of technological assistance with the mixing and oxygenation. On this basis 5 types of lagoon system can be identified, listed in increasing order of the amount of technological assistance applied for the required mixing and oxygenation:
(1) Oxidation ponds
(2) Mechanically assisted oxidation ponds
(3) Aerated oxidation ponds
(4) Facultative lagoons
(5) Suspension mixed aerated lagoons
LAGOON SYSTEMS
In order to bring some definition to the 5 types of lagoon system, the degree of aeration and mixing assistance in the different systems is briefly reviewed below.
Oxidation pond
The oxidation pond has an extensive literature and it is not the objective to review the design procedure here. This is given by Gloyna (1971) and Marais (1966; 1970). Only the factors related to mixing and aeration will be briefly discussed.
When wastewater enters an oxidation pond, the settleable fraction of the organic load settles to the bottom of the pond where it forms a sludge layer. In this sludge layer, anaerobic fermentation takes place. As the sludge layer increases so does the fermentation until the accumulation of sludge in the layer equals the rate of sludge removal by fermentation. In this way, the sludge layer could achieve a steady state if environmental conditions remain unchanged. Fermentation in the sludge layer releases energy from the system in the form of methane gas, which escapes to the atmosphere. In this fashion, fermentation contributes significantly to the removal of energy (COD) from the wastewater. Marais (1966; 1970) estimated that approximately 30 to 40% of influent energy leaves the system as methane gas. The depth of the sludge layer depends on the organic load per unit area of pond and the water temperature. The fermentation rate is very temperature dependent - increasing as the temperature increases. Therefore, with seasonal temperature variations, the sludge layer depth also varies, increasing during the cold season (i.e. accumulating energy in the sludge layer) and decreasing during the hot season (reducing the energy in the sludge layer).
In the supernatant (upper) layers of the pond, algae develop, which, with photosynthesis, supply oxygen to the pond to facilitate heterotrophic breakdown of the non-settleable organics. In this way, aerobic conditions are maintained in the upper layers of the pond. The types of algae that grow and their concentrations are crucially affected by the mixing of the pond contents by wind action. If the mixing energy is low, stratification develops which prevents non-motile algae in the lower layers from being brought periodically to the photic surface layers. The non-motile algae therefore die out and are supplanted by motile algae which can move in and out of the photic zone independently of mixing. The non-motile algae are good oxygen producers whereas the motile algae are not. Also the density of the non-motile algae is greater than that of the motile algae. Consequently, during stratification, the oxygenation capacity of the pond is severely impaired, resulting in poor non-settleable organic material breakdown by the heterotrophic organisms. During windy and temperate weather, mixing is good and non-motile algae proliferate. This results in good oxygen generation and distribution throughout the water layers of the pond by the mixing action, and hence improved non-settleable organic material breakdown by the heterotrophic organisms. In general, mixing in the pond always has a marked beneficial influence on the ability of the pond to maintain aerobic conditions and sustain higher organic loading rates. Clearly, the sludge layer and mixing conditions of the pond have a crucial effect on the response of the pond under varying natural environmental conditions.
Mechanically assisted oxidation ponds
In order to overcome the adverse effects of (i) stratification on oxygen production, and (ii) increased loading on the pond supernatant by feedback from the sludge during the hot weather, the pond can be assisted to maintain non-motile algae in suspension by artificially augmenting the mixing action. This can be accomplished in small ponds by installing a recirculating pump giving a turnover of the pond volume once or twice per day. For large ponds (> 10 ha) installation of a floating stirrer is preferable. These are similar to floating aerators but the blades are set deep below the pond surface and rotate slowly. The objective is to move large volumes of water at a slow velocity as this allows the mixing action to extend a considerable distance away from the stirrer. The energy requirement is small, ~ 0.1 W/m3 pond volume. In Cape Town, a 10 kW floating stirrer on a 16 ha pond of 1 m depth (0.6 W/m3) ensured complete mixing for extended periods over a 200 m radius. Comparison of the stirred pond with an identical unstirred adjacent pond indicated that there were higher oxygen concentrations, higher algal growth and improved visual appearance in the stirred pond.
Installation of stirring does not alter the basic physical/biological processes in the pond. It only provides greater security for good non-motile algal growth by maintaining a minimum mixing level during those periods when the natural environmental conditions are such that stratification would develop in the pond. The presence and action of the sludge layer is in no way affected.
Aerated oxidation ponds
In this system, the natural oxygenation capacity of the oxidation pond is augmented by installing air pipelines with diffusers at regular intervals along the pond bottom. Sometimes the pipelines are raised above the bottom. The rising bubbles mix the pond contents and augment the oxygen supply, but the main source of oxygen remains algal photosynthesis. The mixing energy is insufficient to prevent settlement of settleable organic material from the influent and a sludge layer forms as in the oxidation pond. By raising the aeration pipes above the pond bottom, the sludge layer is not disturbed and fermentation can proceed unimpeded as in the oxidation pond.
The performance of aerated oxidation ponds has not been widely published in the open literature and design procedures tend to be in the hands of the aeration system manufacturers.
Facultative aerated lagoons
In the facultative aerated lagoon, oxygen is supplied wholly by artificial means, usually floating aerators. Algal photosynthesis plays little or no part in the oxygen supply. However, the mixing energy is insufficient to keep the settleable solids in suspension and a sludge layer forms on the pond bottom. There is relatively little accurate information available defining the level of energy required to ensure that the settleable solids remain in suspension, or to ensure that settlement will take place. Eckenfelder (1966) suggests that facultative conditions can be presumed to be present when the power density in the lagoon is < 2 to 4 W/m3 and suspension mixing is present at > 20 W/m3. There is therefore a wide range of power inputs for which there is uncertainty regarding the type of mixing present in a lagoon. Yet it is important to know whether 'suspension mixed' or 'facultative' conditions are present in a lagoon because this affects the oxygen requirements and effluent quality from the lagoon.
A difficulty reported in the operation of facultative aerated lagoons is that foaming occurs. This tends to happen particularly where facultative lagoons are applied for the treatment of industrial wastewaters with high soluble BOD5 fractions. The reason for this is low mixing energy, so that the OHO active mass formed settles out with the result that aerobic degradation of organics in the lagoon supernatant layers is slowed. This type of foaming also occurs in activated sludge (AS) plants during start-up, when the organic load to OHO VSS ratio is very high.
Suspension mixed aerated lagoons
In this system, the aeration energy input is so high that no settlement of suspended solids takes place. Provided the lagoon is maintained in an aerobic state, the system is identical to the normal AS system except that (i) no settling tank and (ii) no sludge recycle are provided. Consequently, the sludge age (Rs) is equal to the hydraulic retention time (Rh). The effluent contains organic particulate material, mostly the AS formed from the influent organics, viz., active OHO (XBH), endogenous (XE) and unbiodegradable particulate organics from the influent (XI). From the COD balance, the reduction in COD between the unfiltered influent and effluent COD is equal to the carbonaceous oxygen demand for growth and endogenous respiration per unit influent flow. Generally speaking, this COD reduction is insufficient: The effluent COD is too high for unrestricted discharge to receiving stream and rivers. Additional treatment with the specific objective of removing the settleable solids from the effluent flow without settling tanks is necessary to achieve a reasonably good (though not nitrified) effluent quality.
Additional treatment is usually achieved in one or more oxidation ponds or facultative lagoons. In these second lagoons, the solids settle out to form a sludge layer and a relatively solids-free effluent is obtained. The sludge in the layer ferments so that a considerable proportion of the influent energy is lost from the system via methane gas. Due to the fermentation, recycling of energy (COD) from the sludge layer to the supernatant layers occurs, imposing an oxygen demand in the supernatant. Therefore, the behaviour of the second facultative pond or lagoon does not at first sight appear to be different to the system where the suspension mixed lagoon is eliminated and the influent discharged directly to a facultative lagoon. However, there is a major difference. In the suspension mixed lagoon, the soluble and particulate organics are transformed to settleable solids by biological and physical processes such as growth, adsorption and flocculation. Most of the effluent organics are therefore settleable and settle out much more readily and completely in the second pond. The suspension mixed lagoon therefore acts as a biological 'flocculator', which promotes solid/liquid separation in the subsequent facultative pond.
The oxygen demand in the suspension mixed lagoon can be calculated with good precision with the steady-state AS model as described in this paper. Also, by making the reasonable assumption that all the influent biodegradable organics are transformed to OHO active mass in the first suspension mixed lagoon, an accurate estimate of the upper limit of the oxygen demand in the subsequent facultative lagoon can also be made. This is done with the aid of the endogenous respiration part of the AS model and by assuming that the facultative pond is suspension mixed. Thus, by making the 1st lagoon suspension mixed and assuming the second lagoon is also, it is possible to estimate with reasonable accuracy the oxygen demand for the 1st lagoon and obtain an upper bound for the oxygen demand in the second facultative lagoon. It will be shown that in the 1st lagoon the energy input from the surface aerator is sufficient to establish suspension mixing conditions whereas in the second lagoon it is not, with the result that facultative conditions are established in the second lagoon. The implications and merits of this approach are below.
APPLICATION OF THE ACTIVATED SLUDGE MODEL TO SUSPENSION MIXED LAGOONS
The design approach is based on two theories, (i) the steady-state activated sludge (AS) model and (ii) energy requirements for mixing. Assuming constant flow and load, and completely mixed conditions in the 1st and second lagoons, allows application of the steady-state AS model to both. By assuming that all the influent biodegradable organics are utilized and transformed to OHO active VSS in the 1st lagoon, it behaves very similarly to the single completely mixed AS system and the full growth-endogenous respiration AS model is applied to the design of the 1st lagoon. With no growth of OHO biomass in the second lagoon, it behaves similarly to the in-series reactor waste activated sludge aerobic digester and only the endogenous respiration part of the AS model is applied to the design of the second (and additional) lagoons. As mentioned above, the energy requirements for suspension mixing and settlement of solids are not well defined, certainly not as well as for the AS model. Due to this uncertainty, it is difficult to specify definitive design criteria that accurately define the type of mixing. The mixing 'theory' included in the approach is based on some early empirical formulae and anecdotal data from the literature. However, the design approach is sound and as mixing 'theories' improve, these can be included in the design approach outlined below.
The aerated lagoon model in terms of COD is presented first, and thereafter in terms of BOD5. Recasting the design procedure in terms of BOD5 allows it to be used with the BOD5 as the energy measurement parameter. Most of the aerated lagoon performance data available in the literature are in terms of BOD5. The design equations are therefore required in terms of BOD5 to validate the design approach.
COD-BASED STEADY-STATE THEORY
The 1st lagoon
The same steady-state AS model equations of Marais and Ekama (1976) apply to the 1st lagoon with sludge age (Rs) equal to nominal hydraulic retention time (Rh), i.e., Eqs 1 to 8 below are obtained directly from their Eqs 43, 48, 53, 49, 30 and 31, 33, 32 and 51, respectively, with Rs = Rh:
Influent biodegradable organics:

Influent unbiodegradable particulate organics (UPO):

Effluent unbiodegradable soluble organics (USO):

Effluent unbiodegradable particulate organics (UPO):

Effluent biodegradable organics:

Effluent OHO biomass:

Effluent endogenous residue:

Effluent VSS:

where:
Sb1 = filtered effluent biodegradable COD concentration from the 1st lagoon.
The remaining symbols are defined in the List of Symbols in Appendix 2. The subscripts 1 or n denote the concentrations from the 1st or nth lagoon. Because the lagoons are assumed suspension (or completely) mixed, the concentrations in the lagoon and its effluent are equal.
From the above, the unfiltered effluent COD concentration from the 1st lagoon St1 is given by:

The filtered effluent COD concentration from the 1st lagoon Stf1 is given by:

The carbonaceous oxygen demand in the 1st lagoon (FOc1, kgO/d flux, Eq. 11) is found from Eq. 38 in Marais and Ekama (1976), i.e.
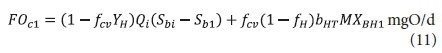
where:

With regard to the values of the kinetic (Kv and bH) and stoichiometric (fH, fcv, YH) constants, the same values for the AS system can be used. Of these, the only one of uncertain validity is the COD utilization rate Kv [L/(mgOHOVSS·d)]. It therefore may not give a very accurate estimate of the filtered effluent biodegradable COD concentration (Sb1) from the 1st lagoon. However, this does not influence the design of the 1st lagoon very much because Sb1, being soluble, is likely to be readily biodegradable and therefore very low (Marais and Ekama, 1976). More important is the unutilized biodegradable particulate organics (BPO) concentration to determine the concentration of biodegradable COD utilized in the lagoon. Being slowly biodegradable, this concentration will be significantly greater than Sb1. However, it cannot be measured because it is enmeshed with the AS and therefore part of the VSS concentration. For this reason, the design approach is based on prudent selection of the retention time (see below) to ensure a high soluble and particulate biodegradable COD utilization. Then the resulting carbonaceous oxygen demand (OD) will not be strongly influenced by the unutilized COD concentration. Whether the COD utilization is 95% or 98% in the 1st lagoon, does not affect the carbonaceous OD very much - only by 3%. If desired, the Kv value determined by Marais and Ekama (1976) on AS systems treating municipal wastewater can be used, i.e.:

where:
Kv20 = substrate utilization rate at 20°C = 0.07 L/(mgOHOVSS·d)
But it is far simpler to just ignore KvT and assume 100% biodegradable COD utilization (i.e. Sb1 = 0) provided the hydraulic retention time (Rh1) is correctly selected (see below).
For industrial wastewaters, the Kv value may be significantly different to that for municipal wastewaters but again this will not affect the design of the lagoon system very much, provided the retention time is not selected too low, because it focuses on supplying the correct mass of oxygen per day rather than on the accuracy of the effluent COD concentration.
The 2nd lagoon
The effluent from the 1st lagoon, containing Sb1, XI1, Sus1, XBH1, XE1 and Xv1, passes to the 2nd lagoon with retention time Rh2. If 100% utilization of biodegradable COD was not assumed for the 1st lagoon, then in the 2nd lagoon, utilization of the influent biodegradable COD will be complete (Sb2 = 0). Therefore, the concentrations of the variables in the 2nd lagoon, and its effluent, are:
Effluent unbiodegradable soluble organics (USO):

Effluent unbiodegradable particulate organics (UPO):

Effluent biodegradable organics:

Effluent OHO biomass:

Effluent endogenous residue:

Effluent VSS:

From the above, the unfiltered effluent COD concentration from the 2nd lagoon St2, if suspension mixed, is given by:

And, if facultative, is approximately equal to the filtered effluent COD concentration from the 2nd lagoon Stf2, which is given by:

The carbonaceous oxygen demand in the 2nd lagoon (FOc2, kgO/d) is like Eq. 11, except Sbi is Sb1, i.e.:

where:
MXBH2 = OHO VSS mass in 2nd lagoon = XBH2V2 kgVSS
and V2 = volume of the 2nd lagoon = Rh2Qi ML
The 3rd lagoon
The effluent from the 2nd lagoon, containing XI2, Sus2, XBH2, XE2 and Xv2, passes to the 3rd lagoon (if included) with retention time Rh3. In this lagoon, because utilization of biodegradable organics is complete, only endogenous respiration of the AS takes place (utilization of biodegradable organism organics). Therefore, the concentrations of the variables in the 3rd lagoon, and its effluent (if completely mixed), are:
Effluent unbiodegradable soluble organics (USO):

Effluent unbiodegradable particulate organics (UPO):

Effluent biodegradable organics:

Effluent OHO biomass:

Effluent endogenous residue:

Effluent VSS:

From the above, the unfiltered effluent COD concentration from the 3rd lagoon St3 is given by:

The filtered effluent COD concentration from the 3rd lagoon Stf3 is given by:

The carbonaceous oxygen demand in the 3rd lagoon (FOc3, kgO/d flux) is like Eq. 22 but with no biomass growth, i.e.:

where:
MXBH3 = OHO VSS mass in 3rd lagoon =XBH3V3 kgVSS and V3 = volume of the 3rd lagoon = Rh3Qi ML
SELECTION OF RETENTION TIME
To determine the effect of retention time on the degradation efficiency of the readily biodegradable soluble organics (BSO) and slowly biodegradable particulate organics (BPO), the general AS model (ASM1, Henze et al., 1987 or UCTOLD, Dold et al., 1991) was run for a single suspension mixed lagoon at a number of different retention times from 0.1 to 8 d at 14°C and 22°C with influents comprising (i) BSO only, (ii) BPO only, and the example raw wastewater in WRC (1984) (iii) with and (iv) without a 5% (as COD) OHO VSS seed. All the runs were based on the default kinetic and stoichiometric constant values and the results are shown plotted in Figs 1a to h. Also shown in Fig. 1 are the steady-state (SS) lagoon model results assuming 100% influent biodegradable COD utilization in the 1st lagoon. From Figs 1a to h, the minimum retention time for (i) OHO washout (no biodegradable COD utilization) and (ii) equivalence with the steady-state model (> 95% influent biodegradable COD utilization) are listed in Table 1.
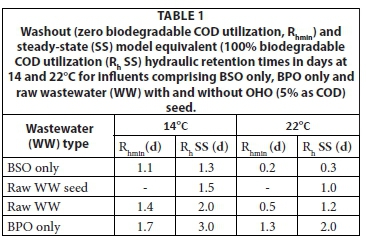
From Figs 1a to h and Table 1, the following can be noted;
(1) At both temperatures, the BSO influent has the shortest washout retention time and the BPO influent the longest. The washout retention time for the raw wastewater, which comprises both BSO (25%) and BPO (75%), is (as expected) between the BSO and BPO influents washout retention times. The raw wastewater with the 5% OHO seed does not have a washout retention time because OHOs are fed continuously into the lagoon with the influent resulting in at least some utilization of BSO and BPO depending on the retention time. The washout retention time for the raw wastewater is 1.4 d and 0.5 d at 14°C and 22°C, respectively.
(2) The retention time for approximate equivalence with the steady-state model is longer than the washout retention time. For the BSO, the increase is very small - only 0.2 and 0.1 d at 14°C and 22°C, respectively. For the BPO, the increase is large - 1.3 and 0.7 d at 14°C and 22°C, respectively. Hence, the more easily the influent biodegradable organics are degraded, the smaller the difference between the washout and steady-state equivalent retention times. Like for the washout retention times, the steady-state equivalence retention time for the raw wastewater is between the BSO and BPO influent values, i.e., at 2.0 d and 1.2 d at 14°C and 22°C, respectively. The steady-state equivalent retention time for raw wastewater with the 5% OHO seed is somewhat lower at 1.5 and 1.0 d than that for the raw wastewater without OHO seed (2.0 d and 1.2 d).
From the above, it can be seen that if the retention time in the 1st lagoon is selected longer than 2.0 d at 14°C and 1.2 d at 22°C, virtually complete utilization of influent biodegradable organics will take place. Therefore, at retention times greater than these, the steady-state lagoon model assuming all the biodegradable organics are completely utilized can be applied to municipal wastewater without significant error. For other wastewaters, these minimum retention times may be different, depending on the biodegradability of the organics in the wastewater.
OVERALL LAGOON PERFORMANCE
Even if biodegradation of the influent biodegradable organics is virtually complete in the 1st lagoon, the COD removal is still low. This is because the AS formed in the 1st lagoon is part of the unfiltered effluent COD (Eq. 9) because the lagoon is suspension mixed. In fact, the power input of the aeration system in the 1st lagoon, sized to supply the growth and endogenous oxygen demands (Eq. 11), is usually sufficient for suspension mixing. The filtered effluent COD is very low because (depending on the wastewater type and retention time) most of the influent biodegradable soluble organics (BSO) are utilized and transformed to OHO VSS mass (Eqs 5 and 6). In most wastewaters, including municipal wastewater, the BSO are readily biodegradable and OHO mass is produced very rapidly from it. This OHO mass accelerates the utilization of the slowly biodegradable particulate organics (BPO), but that not utilized in the retention time of the 1st lagoon is enmeshed with the AS and so is removable by settlement (or filtration) in the 2nd lagoon. This is the main purpose of the 2nd (and 3rd facultative) lagoon. In fact, the power input of the aeration system in the 2nd (and 3rd) lagoon, sized to supply mainly the endogenous oxygen demand (Eqs 22 and 31), is usually insufficient for suspension mixing, even though the oxygen demand in it is calculated assuming complete mixing. The unfiltered effluent COD from the 2nd (and 3rd) lagoons is therefore mainly the COD of the remaining non-settleable AS (which is small) and the unbiodegradable soluble organics (USO) (Eqs 21 or 30). The COD of filtered effluent is mainly the COD of the USO (Eqs 21 or 30).
COD BALANCE OVER THE LAGOON SYSTEM
Each lagoon in the system, as well as the system overall, must conform to the COD balance. The COD balance up to and including the nth lagoon is given by;

where:
Qi Sti = COD load applied to system (kgCOD/d)
Stn = unfiltered COD concentration from the nth lagoon mgCOD/L (Eqs 9, 20 and 29)
∑FOcn = flux OD up to and including the nth lagoon (kgO/d, Eqs 11, 22 and 31).
It should be noted that the COD removal and the COD degraded are equal only for the 1st lagoon because this is the only lagoon that is suspension mixed. With settlement of AS in the facultative 2nd (and 3rd) lagoons, the COD removal is much greater than the COD degraded, both of which are difficult to estimate because they depend on the environmental conditions in the lagoons. The COD degraded depends on the fermentation rate in the sludge layer and the COD removal on the efficiency of AS settling.
STEADY-STATE MODEL APPLICATION
The theory set out above can be applied to raw municipal wastewater without difficulty. This is because the unbiodegradable soluble and particulate COD fractions (fS'us and fS'up) are fairly well known (WRC, 1984). When applying the theory to specific industrial wastewaters, the problem is that these wastewater characteristics are not known. To determine these two characteristics for a particular industrial wastewater requires an experimental investigation in which two or more AS systems treating the particular wastewater are operated at different sludge ages for an extensive period (about 6 months). At present, there are not many industrial wastewaters that have been characterized in this way in terms of COD. There is far more operating experience with municipal and industrial wastewater treatment in aerated lagoons in terms of BOD5.
Therefore, the steady-state aerated lagoon model equations developed above in terms of COD are transformed to BOD5 units below to give some validation of the model. Interestingly, the use of BOD5 leads to a simple aerated lagoon design procedure and provides insight into their behaviour because the biological processes in the BOD bottle on an unfiltered effluent from the nth lagoon are the same as in the (n + 1)th lagoon - i.e. mainly endogenous respiration.
BOD5-BASED THEORY
The main difference when using the BOD5 as the wastewater strength parameter instead of the COD, is that the BOD5 is related, in a non-linear way, only to the oxygen consumed in the utilization of the biodegradable organics through the growth and endogenous respiration processes (see Appendix 1 for detail). Initially in the BOD test, oxygen is utilized for growth of OHO VSS (catabolism) on the biodegradable organics in the sample and thereafter in the utilization of the biodegradable organics of the OHO VSS via endogenous respiration.
The unfiltered influent BOD5 is the oxygen utilized for growth of OHO VSS on the biodegradable organics in the influent wastewater and for endogenous respiration of this OHO VSS over 5 d. The BOD5 gives no indication of the unbiodegradable organics in the effluent, which in some industrial wastewaters can be considerable. From Eq. A13 in Appendix 1, the influent BOD5 and biodegradable COD (Sbi) are related proportionally for a particular wastewater. If the proportionality factor is γ, then the biodegradable COD (Sbi) from a measured BOD5 is:

The magnitude γ is related to the rate of utilization of the wastewater organics in the BOD5 test (i.e. the K rate in Eq. A14), which in turn is related to the proportion of BSO in the wastewater. However, if γ values for different wastewaters are known, it is possible to use the BOD5 parameter in the COD-based design equations developed above.
The BOD5 in the unfiltered effluent from a suspension mixed lagoon is oxygen utilization due to two effects, i.e. (i) growth of OHO mass on the residual influent biodegradable organics and (ii) endogenous respiration of the OHO VSS in the effluent and that produced in the test. The unfiltered effluent BOD5 from the 1st lagoon therefore is similar to the carbonaceous oxygen demand in the 2nd lagoon (Eq. 22). In fact, the biological processes in the BOD5 test are simply a continuation of those in the 1st lagoon.
The remaining BSO can be measured on the filtered effluent BOD5. However, there is no way of knowing how much of the unfiltered effluent BOD5 concentration is due to undegraded BPO enmeshed in the AS. Being slowly biodegradable, the BPO concentration can be high at low retention times (< 1 d, see Figs 1e and f). However, it is not necessary to have a very accurate value because it is usually very low for Rh > 1.5 d. At Rh > 1.5 d, most of the biodegradable organics, whether readily (BSO) or slowly (BPO) biodegradable, will have been utilized and so usually can be neglected without much error in the estimate of the carbonaceous oxygen demand, especially if the influent BOD5 is high (see Figs 1e and f).
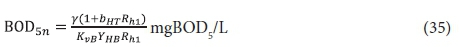
Accepting that the remaining influent biodegradable organics concentration in the lagoon effluent is zero, then from Eq. A9, with Sbi = 0 and t = 5d, the unfiltered effluent BOD5 from the nth lagoon is:
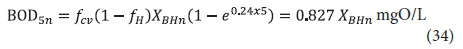
Note from Eq. 34 that, even though all the influent biodegradable organics have been utilized, the effluent BOD5 is not zero. This is because endogenous respiration of the OHO VSS continues in the BOD5 test.
The 1st lagoon
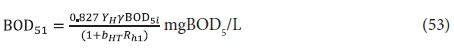
The same steady-state AS model equations based on COD apply. If required, the filtered effluent BOD5f1, can be calculated from:
The BOD5 utilized, ΔBOD5, is the difference between the influent and effluent BOD5, i.e .:

and hence from Eq. 6, the active organism concentration is:

where:
BOD5i = influent BOD5 concentration (mg/L)
BOD5f1 = filtered effluent BOD5 (mg/L)
Equations 35 to 37 are correct for purely soluble organic wastewaters. For wastewaters that include particulate biodegradable organics, these equations are only approximate because ΔBOD5 does not correctly reflect the influent biodegradable organics utilized - the concentration of unutilized particulate biodegradable organics enmeshed in the VSS solids is not known.
Because the BOD5 gives no estimate of the influent unbiodegradable particulate organics concentration (UPO, Supi or XIi), the VSS concentration in the lagoon cannot be calculated.
The mass of OHO VSS in the 1st lagoon is given by:

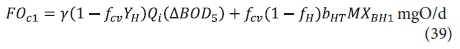
and hence the carbonaceous oxygen demand in the 1st lagoon (FOc1, kgO/d) is found from Eq. 11, i.e.:
From Eq. 34, the BOD5 of the unfiltered effluent, BOD51, is given by:

The equations above work best when BOD5f1 = 0 so that ΔBOD5 = BOD5i, and hence it is recommended to select retention times at which there is reasonable certainty that this is so (see Fig 1a to h and Table 1).
With regard to the values of the kinetic (KvB and bH) and stoichiometric (fH, fcv, YHB) constants, only KvB and YHB are different and the BOD5-based values can be calculated from the COD-based values. Converting the filtered effluent biodegradable COD (Sb1, Eq. 5) to BOD5 (BOD5f1, Eq. 35) with Eq. A12 yields:

Also, the yield coefficient in terms of BOD5 is obtained from:

where YHB =yYH and y is the COD/BOD5 ratio of the influent wastewater. With YH = 0.45 mgVSS/mgCOD yields YHB = 0.81 mgVSS/mgBOD5 for γ = 1.8 for municipal wastewater.
Hence, setting Eqs 5a and 35 equal, yields:
Kvb = Kv0.707 = 0.055L/(mgVSS.d)
Substituting 0.81 for YHB and 0.055 for KvB into Eq. 35 yields the BOD5 equivalent (from Eq. A12) of Sb1 in Eq. 5.
Of the YHB and KvB, KvB is of uncertain validity for the same reasons that Kv is uncertain. It therefore may not give accurate estimates of the filtered effluent BOD5 concentration from the 1st lagoon. However, like Kv, this does not influence the design of the 1st lagoon very much because (i) a retention time is selected so that the residual soluble and particulate (enmeshed with the VSS) biodegradable organics are very low and (ii) the design approach is based on the carbonaceous OD which is not strongly influenced by the residual biodegradable organics concentration, especially if the influent BOD5 is high. But, if required, the KvB value, determined from the effluent soluble COD concentration from AS systems treating municipal wastewater, can be used, i.e.:

where:
KvB20 = substrate utilization rate at 20°C = 0.055 L/(mgVSS·d)
For industrial wastewaters, the KvB value may be significantly different to that for municipal wastewaters but again this will not affect the design of the lagoon system very much, because the design focuses on selecting the appropriate retention time and supplying the correct mass of oxygen per day rather than on the accuracy of the residual biodegradable wastewater organics concentration. For Rh > 1.0 − 1.5 d, it is easiest to assume that BOD5f1 = 0 and ΔBOD5 = BOD5i.
The 2nd lagoon
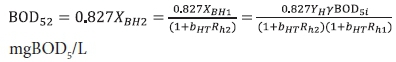
The effluent from the 1st lagoon, containing BOD5f1 and XBH1, passes to the 2nd lagoon with retention time Rh2. In this lagoon, utilization of the influent biodegradable organics will be complete (BOD5f2 = 0). Therefore, the unfiltered effluent BOD5 concentration, BOD52 from the 2nd lagoon is:

The filtered effluent BOD5 concentration is 0, i.e.:

and the OHO concentration XBH2 is given by:

The carbonaceous oxygen demand in the 2nd lagoon (FOc2, kgO/d) is found from Eq. 39, i.e.:

where:
MXBH2 = OHO VSS mass in 2nd lagoon:
= Vl2XBH2 kgVSS
= Rh2Qi XBH2 kgVSS
The VSS concentration cannot be calculated with the BOD5 as wastewater strength parameter.
The 3rd lagoon
The effluent from the 2nd lagoon, containing XBH2, passes to the 3rd lagoon (if included) with retention time Rh3. In this lagoon, because utilization of wastewater biodegradable organics is complete, only endogenous respiration of the AS takes place (utilization of biodegradable organism organics). Therefore, the concentrations of the variables in the 3rd lagoon, and its effluent, are:


From Eq. 34 the unfiltered effluent BOD5 concentration from the 3rd lagoon BOD53 is:

The carbonaceous oxygen demand in the 3rd lagoon (FOc3, kgO/d) is found from Eq. 39 with ΔBOD5 = 0, i.e.

where:
MXBH3 = OHO VSS mass in 3rd lagoon = V3XBH3 kgVSS = Rh3Qi XBH3 kgVSS
As for Lagoons 1 and 2, the VSS concentration in the 3rd lagoon cannot be calculated with the BOD5 as wastewater strength parameter because the influent unbiodegradable particulate organics (UPO) concentration (Supi, XIi) is unknown.
THE VALUE OF
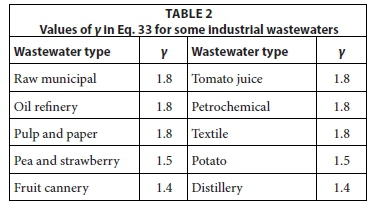
From an examination of suspension mixed lagoon behaviour treating different industrial wastewaters reported in the literature, values of γ were derived and are listed in Table 2.
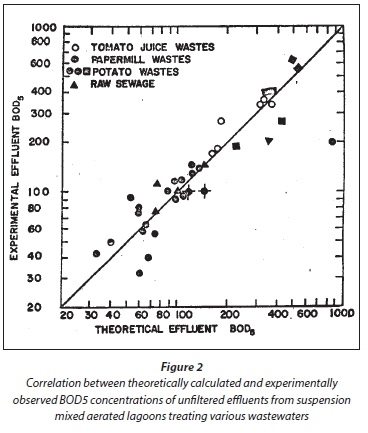
With the γ values in Table 2, and applying the above equations to assess lagoon performance as reported in the literature, the correlation between the calculated and observed unfiltered effluent BOD5 concentrations are shown in Fig. 2. In the assessment of each lagoon, the data were taken only where there was reasonable certainty that the system was suspension mixed. A difficulty in assessing the validity of the steady-state lagoon model is that rarely, if ever, are oxygen utilization rates reported for lagoons. Without this parameter, it is not possible to either (i) give very reliable values for γ or (ii) validate the model better. Notwithstanding these difficulties, the correlation in Fig. 2 is reasonably good and so the steady-state lagoon model can be accepted as reasonably good.
DESIGN OPTIMIZATION
The 1st lagoon
For design, valuable insights into the relative importance of different facets of the design, such as retention time, oxygen demand, and single versus series lagoons, can be gleaned from the BOD5-based steady-state lagoon model. For this discussion, complete utilization of influent wastewater organics in the 1st lagoon will be accepted, i.e., ΔBOD5 = BOD5i. This considerably simplifies the model.
From Eq. 37, the OHO concentration in the 1st lagoon XBHi, is:

where:
YHγ = yield coefficient in terms of BOD5
For most wastewaters, γ = 1.8 and hence YHB = γYH = 0.81 mgVSS/mgBOD5.
The unfiltered effluent BOD5 is given by Eq. 40 with BOD5f1 = 0 and substituting Eq. 34 into this yields:
and so

The carbonaceous oxygen demand in the 1st lagoon (FOc1, kgO/d) is found from Eq. 39, i.e.:
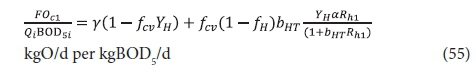
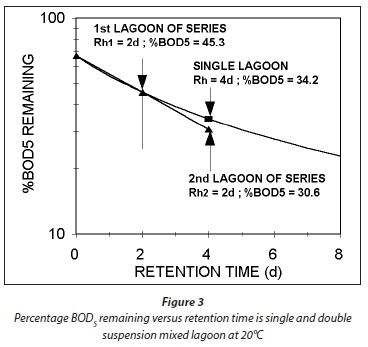
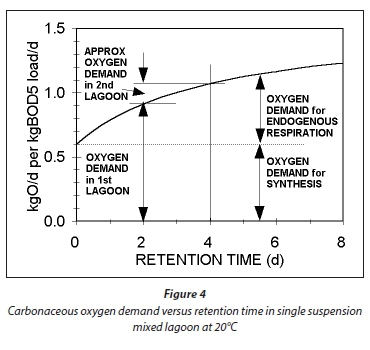
Plots of Eqs 54 and 55 for a temperature of 20°C, at which bH20 = 0.24/d, are given in Figs 3 and 4, respectively. Figure 3 shows that an appreciable fraction of the BOD5 removal is due to growth (catabolism, Eq. A1) given by the difference 100 − 67 = 33% at Rh = 0. The minimum retention time for a lagoon is about 1 d, to ensure that the growth process on biodegradable wastewater organics is virtually complete, giving a BOD5 removal of 46% (Fig 4). At 2 d retention time, only an additional 8.7% BOD5 removal is obtained. As the retention time increases, the additional BOD5 removal added decreases with each day added. The same effect is observed in the oxygen demand (Fig. 4). Therefore, the volumetric efficiency of BOD5 removal decreases as the retention time increases. So as to make the most efficient use of the lagoon volume, the retention time needs to be as short as possible. However, at short retention times the BOD5 removal is unacceptably low. In-series suspension mixed lagoons have improved BOD5 removal compared with single lagoons at the same retention time, but not enough to make a significant difference. This is demonstrated below.
The 2nd lagoon
From Eq. 46 with BOD5fi = 0, the OHO concentration in the 2nd lagoon and its effluent is:

The unfiltered effluent BOD5 is given by Eq. 44 and successively substituting Eq. 56 for XBH2 and Eq. 52 for XBH1 into this yields:
and so for γ = 1.8 and YH = 0.45 mgVSS/mgCOD:

The carbonaceous oxygen demand in the 2nd lagoon (FOc2, kgO/d) is found from Eq. 47, and successively substituting Eq. 56 for XBH2 and Eq. 52 for XBH1 into this yields:

If in Eq. 58, Rh1 = Rh2, then the ratio of the BOD5 reduction (due to endogenous respiration) from lagoon to lagoon down the series is the same. In Fig. 3, this is shown by the straight line from 67% at Rh = 0, through the BOD5 remaining at Rh1 = 2d (45.3%) and continuing a further 2 d (for the 2nd lagoon) to 4 d. Therefore, in double lagoon system with 4 d retention time, the BOD5 remaining is 30.8% whereas in a single lagoon of 4 d retention time, the BOD5 remaining is 34.2%. This difference is very small, too small to make much difference between single and in-series lagoons. The oxygen demand reflects the same outcome. From Eqs 55 and 58, the ratio of the oxygen demand in the 1st and 2nd lagoon is 0.21/0.91 = 0.23, making the oxygen demand in the 2nd lagoon only 23% of that in the 1st lagoon (see Fig. 4 for an approximate visual difference). Because OD is a direct measure of the BOD removal, it is clear that the removal in the 2nd lagoon, of equal volume to the 1st, is only 23% of that in the 1st. With such a low OD, the aeration power input is insufficient to establish suspension mixing in the second lagoon. The design approach is therefore to meet the OD required in the 2nd lagoon but not to supplement the aeration power input with mixing energy to establish suspension mixing, but instead to allow the 2nd lagoon to be facultative. By being facultative, the 2nd lagoon achieves far greater BOD5 removals by sedimentation to a sludge layer and oxidation by anaerobic fermentation than by aerobic oxidation. (With aerobic digestion, multiple reactor digesters do achieve significantly lower effluent active fractions (equivalent to BOD5 remaining) than the single reactor digester at the same retention time (Ekama et al., 2006). Even though one expects the same outcome for suspension mixed aerated lagoons because the biological process is the same, i.e. endogenous respiration, the reason that it doesn't yield the same outcome is because the retention times in the aerated lagoons are an order of magnitude shorter than in aerobic digesters.)
In order to demonstrate that the input by the aeration system establishes suspension mixing and facultative conditions in the 1st and 2nd lagoons, respectively, the power requirements for aeration need to be determined. This is presented below.
POWER REQUIREMENTS FOR AERATION
The oxygen transfer rate (OTR) of an aeration device is given by its mass oxygen transfer per unit energy consumption - kgO/kWh - under standard conditions, which are into clean de-oxygenated tap water at STP - standard temperature (20°C) and pressure (1 atm = 760 mm Hg). This OTR value (Rstd) is a characteristic of the aeration device and is specified by the manufacturers. The OTR under standard conditions (Rstd) needs to be corrected for the site conditions (Ract) where the aeration device is installed. The parameters that are different at the site compared to standard conditions are (i) atmospheric pressure and water temperature, (ii) the oxygen mass transfer coefficient KLa and (iii) non-zero water dissolved oxygen (DO) concentration. The saturated DO concentration under STP is corrected for temperature and atmospheric pressure at the site and for impurities in the wastewater (β). The KLa coefficient is corrected for temperature (θ) and impurities in the wastewater (α). Details of these corrections are given in WPCF/ASCE (1988).
Combining all the corrections gives the ratio of the OTR under site and standard conditions, i.e.:
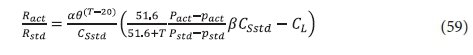
where:
α = KLa correction factor of impurities
θ = KLa correction factor of temperature = 1.012 for mechanical surface aerators
CSstd = saturation DO concentration under standard conditions = 9.07 mgO/L at STP
T = temperature at the site (°C)
Pact = barometric pressure at site (mmHg)
Pstd = standard barometric pressure (mmHg) = 760 mmHg
pact = water vapour pressure at site (mmHg)
pstd = water vapour pressure at standard temperature 20°C (mmHg) = 17.51 mmHg
β = CSstd correction factor of impurities
CL = DO concentration in lagoon (mgO/L).
The effect of temperature and altitude on the Ract/Rstd ratio is shown graphically in Fig. 5. The relationship between altitude and barometric pressure in mmHg can be approximated with

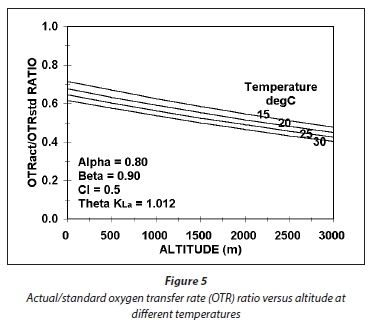
where Alt = altitude in m, and the relationship between the saturated vapour pressure of water and temperature between 5 and 35oC can be approximated with:

where:
p20 = saturated vapour pressure of water at 20°C = 17.51 mmHg
From Fig. 5, it can be seen that the effect of temperature and altitude is not very strong on the Ract/Rstd ratio, only 25% between 15 and 30°C and 0 and 3 000 m and decreasing as both temperature and altitude increase. The lowest power requirement for aeration for a particular carbonaceous oxygen demand (OD) therefore will be at sea level and low temperature. As temperature and altitude increase, the power input for a fixed OD increases and therefore increases the power density (W/m3) for mixing in the lagoon.
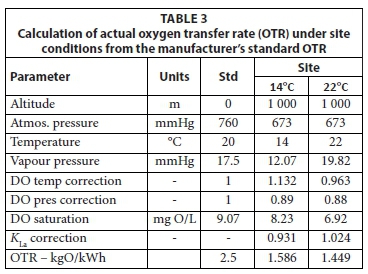
In Eq. 59, the 1st and 2nd terms in front of the β are the saturation DO concentration correction for temperature and pressure, respectively. Accepting an altitude of 1 000 m, which gives a site barometric pressure of about 673 mmHg, maximum and minimum seasonal temperatures of 14 and 22°C, a manufacturer's Rstd of 2.5 kgO/kWh and a lagoon design DO concentration of 0.5 mgO/L, and α = 0.80 and β = 0.90 gives the Ract values for mechanical surface aerators listed in Table 3.
Once the actual OTR at the site is known, the power requirements for aeration are calculated from the mass oxygen demand (OD) per day (flux) FOc, i.e.:

and the power density by:

where:
Ocn = oxygen demand (OD) in kgO/(m3·d) in nth lagoon = FOc / Vn
with FOcn in kgO/d and lagoon volume Vn in m3
MIXING POWER REQUIREMENTS
The power density expressed in W/m3 is the usual way in which mixing power density in biological reactors is defined. However, this parameter only partially defines the mixing conditions. Other parameters such as surface aerator and mixer design, spacing of aerators, aerator rotational speed and reactor geometry all influence the mixing efficiency at a particular power density. However, the effect of these factors is difficult and complex to define and adds unnecessary detail when the power densities for suspension or facultative mixing regimes are not well known.
Very little information is available on the power density required to maintain suspension mixing. According to Von der Emde (1969), Kalbskopf proposed the power densities in Table 4 to maintain AS in suspension.
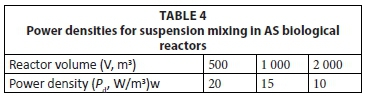
The power density (Pd) in Fig. 6 can be related to the volume with the following approximate equation:

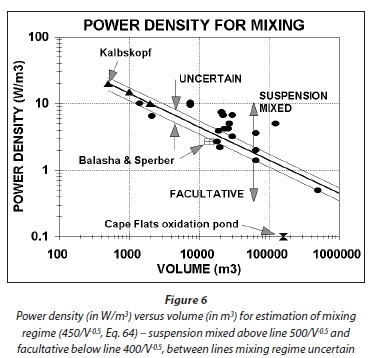
A plot of Eq. 64 is shown in Fig. 6 (solid line). Also shown are the power densities (●) in aerated lagoons which, apparently, behaved kinetically in accordance with the theory for suspension mixed aerated lagoons (data on mixing energies from Beychok, 1971). Although this does not constitute a satisfactory proof that the lagoons were indeed suspension mixed, it does support the implications of Eq. 64 that the power density decreases as volume increases. Only one instance was found which could be used to validate Eq. 64; Balasha and Sperber (1975) operated an aerated lagoon of 14 000 m3 at a power density of 2.7 W/m3 and reported no evident sludge deposition (☒). For this volume, the power density from Eq. 64 is 3.8 W/m3. Therefore, a somewhat lower power density than estimated by Eq. 64 establishes suspension mixing. Since the objective of Eq. 64 is to establish a minimum lower value in the 1st lagoon, to ensure suspension mixing, and an upper maximum value for the 2nd lagoon, to ensure facultative conditions, overestimation by Eq. 64 for suspension mixing conditions is acceptable. Therefore, even though application of Eq. 64 to aerated lagoons extrapolates it way out of the range of AS biological reactor volumes in Table 4, it would appear that Eq. 64 can be applied (with caution) to determine the mixing regime from the power density in large aerated lagoons - provided the actual power density in the 1st and 2nd lagoons are significantly above and below that given by Eq. 64, suspension and facultative mixing regimes are likely to be present in the 1st and 2nd lagoons, respectively.
Knowledge of the minimum power densities for suspension mixed and facultative mixing regimes is of crucial importance in the design of series lagoon systems. In the 1st lagoon, suspension mixing is essential for rapid transformation into settleable solids by (i) growth of OHO VSS from the influent biodegradable soluble organics and (ii) growth and flocculation of the influent particulate biodegradable and unbiodegradable organics, and in the 2nd lagoon, facultative conditions are essential to settle out the settleable solids formed in the 1st lagoon to produce an effluent low in suspended solids. Interestingly, because the oxygen demand in the 1st lagoon includes the growth oxygen demand, its aeration power input invariably is sufficient for suspension mixing, and because the oxygen demand in the 2nd lagoon excludes the growth oxygen demand, its aeration power input invariably is insufficient for suspension mixing. This will be demonstrated in a worked example below.
Knowledge of the minimum power density for suspension mixing in different volumes also allows intelligent application by scaling up pilot plant data to full-scale plant design. A pilot plant may have been deliberately operated as a facultative lagoon with a certain power density. If the full-scale plant is designed with the same power density, the lagoon may be suspension mixed and deliver an effluent BOD5 (COD) very different from that expected from the pilot plant performance.
DESIGN EXAMPLE
To demonstrate the aerated lagoon design procedure based on the steady-state AS model, the example raw wastewater in WRC (1984), i.e. 15 ML/d at 750 mgCOD/L, is treated in a two-in-series aerated lagoon system, the 1st suspension mixed and the 2nd facultative. The hydraulic retention time (HRT) in the 1st lagoon is selected at 1.5 d to ensure near complete utilization of influent biodegradable organics at the minimum temperature of 14°C. The 2nd lagoon is designed for a retention time of 4 d. Because the oxygen demand is highest at the maximum temperature, the calculations are repeated at 22°C to determine the aeration power requirements, which establishes the mixing conditions in the lagoons. Complete utilization of biodegradable organics in the 1st lagoon is assumed because HRT selection is based on this (Fig 1). The results of the calculations for the COD and BOD5 models are given in Table 5. The oxygen transfer rate (OTR) at the site were calculated from the information in Table 3.
From Table 5, the following can be noted:
(1) The COD- and BOD5-based models give identical results. This is because the same γ value of 1.8 was used (i) to calculate the influent BOD5 concentration, which is 325 mgO/L and (ii) in the BOD5 model calculations. From Eq. A10, which is based on the AS growth-endogenous respiration model, the γ value is 1.41 yielding an influent BOD5 concentration of 415 mgO/L. Differences in γ values do not affect the BOD5-based model, provided the same value is used to calculate the influent BOD5 and in the model. If only the influent BOD5 concentration is known, then it is best to select a γ value on the high end, because this leads a more conservative design, i.e., higher oxygen demand.
(2) The effluent COD and BOD5 concentrations from the 2nd lagoon are uncertain. The concentrations given in Table 5 are the lowest and highest possible values. If 100% solids removal is achieved in the 2nd lagoon, which is unlikely, the unfiltered effluent COD concentration is the unbiodegradable soluble concentration, i.e., 53 mgCOD/L and the BOD5 is 0. At the other extreme, if the 2nd lagoon were suspension mixed, the unfiltered effluent COD concentration is the soluble unbiodegradable COD plus the COD of the AS solids, i.e., 354 and 375 mgCOD/L at 22 and 14°C, respectively; the effluent BOD5 is 79 and 93 mgO/L at 22 and 14°C respectively. From this it can be seen that if settlement of solids in the 2nd lagoon is good, the lagoon system can achieve very respectable effluent organic concentrations. The disadvantage of lagoons is not their organic removal efficiency, which clearly can be good, but that lagoon systems, due to their low retention times, rarely nitrify. For municipal wastewater with high influent TKN concentrations this is a severe shortcoming. For agro-industrial wastewaters with much lower TKN/COD ratios, the lack of nitrification is not such a serious shortcoming. Indeed, with some agro-industrial wastewaters N and P may have to be dosed to ensure optimal OHO growth. The N and P dosages can be calculated with the AS model equations (Marais and Ekama, 1976; WRC, 1984; Henze et al., 2008).
(3) The power density (Pd) supplied by the aeration system in the 1st lagoon is 5.38 W/m3 at 22°C. As a Pd > 3 W/m3 is required for suspension mixing, the 1st lagoon will be suspension mixed. The power density of the aeration system in the 2nd lagoon is only 0.82 W/m3 and, as 1.84 W/m3 are required for suspension mixing, the lagoon will be facultative. Because the retention time of the 1st lagoon is generally short (1-2 d) and oxygen demand includes that for growth, it will generally be found that the 1st lagoon will be suspension mixed, unless the influent COD concentration is low. Furthermore, because the retention time of the 2nd lagoon usually is longer than the 1st (3-6 d), and oxygen demand is that for endogenous respiration only, it will be found that the 2nd lagoon is generally facultative, unless the influent COD is high.
Elaborating on (3) by making the influent flow and COD concentration variables, the power densities for aeration and mixing for the 1st and 2nd lagoons are given by:
where the LHS of Eqs 65 and 66 are the power densities due to aeration in the 1st (Pd1) and 2nd (Pd2) lagoons and the RHS the power density limit between suspension mixing (>) and facultative (<) conditions in the lagoons. Note that in Eqs 65 and 66 Qi is in ML/d.
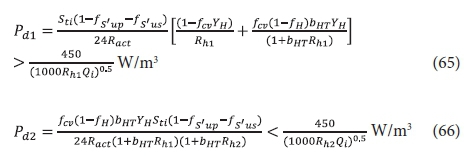
From Eq. 65, Figs 7a and b show the minimum raw wastewater, with unbiodegradable soluble organics (USO) COD fraction (fS'us) = 0.07 and unbiodegradable particulate organics (UPO) COD fraction fS'up = 0.15), influent COD concentration versus the influent flow to achieve suspension mixing in the 1st lagoon at retention times of 1.0, 1.5, and 2.0 d for 14 (Fig. 7a) and 22°C (Fig. 7b) based on the aeration system characteristics in Table 3. While the positions of the lines change only marginally for different wastewater and aeration system characteristics, the lines in Figs 7a and b show a general trend, i.e.:
•For a fixed influent flow, the shorter the HRT of the 1st lagoon (Rh1), the lower the influent COD concentration (Sti) to achieve suspension mixing in the 1st lagoon.
•At the same HRT, the lower the wastewater temperature, the higher the influent COD concentration for suspension mixing in the 1st lagoon.
•The higher the influent flow, the larger the lagoon volume at a particular HRT, the lower the power density required for suspension mixing, and hence the lower the influent COD concentration (Sti).
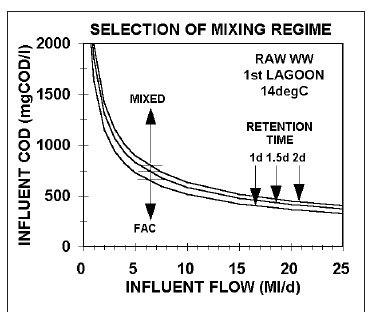

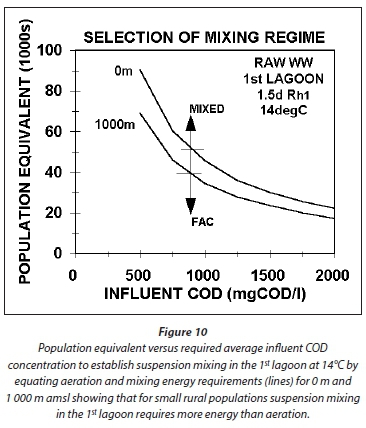
Because the minimum HRT for the 1st lagoon is around 1 d at 22°C and 1.5 d at 14°C, the minimum influent COD concentration to establish suspension mixing is about 650 and 830 mgCOD/L at 22 and 14°C for an influent flow of 5 ML/d. At 0.5 ML/d, the concentrations are much higher, i.e., about 2 000 and 2 600 mgCOD/L 22 and 14°C. The pattern here is important to note. The lower the influent flow, the higher the influent COD concentration for suspension mixing by the aeration system alone. For agro-industrial wastewaters, like those from fruit and vegetable processing, the influent COD concentrations are usually high (2 000-3 000 mgCOD/L) and so suspension mixing by the aeration system alone can be achieved even at very low flows of 0.5 ML/d (Figs 7a and b). For municipal wastewater with low per capita water consumption, as is usual for rural areas, the raw wastewater influent COD concentrations are from 1 000-1 200 mgCOD/L (in South Africa), so the influent flow has to be quite high to achieve suspension mixing in the 1st lagoon, i.e. > 2 ML/d at 22°C and Rh1 = 1.0 d at 1 000 mgCOD/L and > 3 ML/d at 14°C and Rh1 = 1.5 d at 1 050 mgCOD/L). Because aerated lagoons are more likely to be applied in rural areas where land is more readily available, town populations are generally low (3 000 to 10 000), too low to generate a high influent flow. For example, a town with a population of 5 000 at 0.1 kgCOD/(person·d) produces an organic load of 500 kgCOD/d. If the water contribution is, say, 100 L/d per person, then the influent COD concentration and flow are 1 000 mgCOD/L and 0.5 ML/d. At a retention time of 1.5 d at 14°C, the minimum influent COD concentration for suspension mixing by the aeration system alone is around 2 600 mgCOD/L. The minimum influent flow at 1 000 mgCOD/L is about 3.0 ML/d at 14°C and Rh1 = 1.5 d giving a population of around 30 000. This is not a small town and it is probably better to build a normal AS system for it. Clearly, when treating municipal wastewater from small towns in aerated lagoons, the mixing energy of the aeration system in the 1st lagoon needs to be supplemented to ensure suspension mixing, making it unlikely that it will be applied due to the higher than normal activated sludge energy requirements (Fig 10).
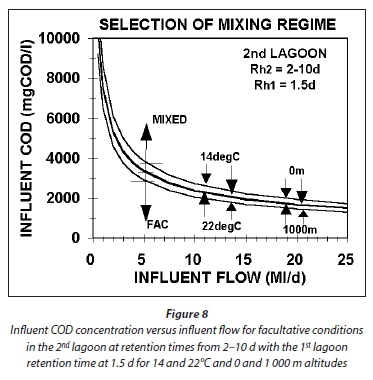
For the 2nd lagoon, the maximum influent COD concentration versus influent flow for facultative conditions is shown in Fig 8 for 14 and 22°C, altitudes of 0 and 1 000 m and a retention time of 1.5 d in the 1st lagoon. From Fig. 8 it can be seen that:
•The higher the influent flow, the lower the influent COD concentration to ensure facultative conditions in the 2nd lagoon.
•The higher the temperature and the higher the altitude, the lower the influent COD concentration to ensure facultative conditions in the 2nd lagoon.
•Retention times in the 2nd lagoon between 2 and 10 d do not affect the influent COD concentration and flow relationship.
An important conclusion from the above is that if high-strength agro-industrial wastewaters are treated in aerated lagoons, the influent flow must be low otherwise facultative conditions will not be achieved in the 2nd lagoon. Without facultative conditions, settlement of solids will not take place and the effluent will have high COD, BOD5 and suspended solids concentrations.
Combining the suspension and facultative mixing regime requirements for the 1st and 2nd lagoons defines lower and upper bounds for the influent COD concentration at different influent flows. This is shown in Fig. 9 (which is a combination of Figs 7a and 8). Proper operation of the lagoon system requires the influent COD concentrations above the 1st lagoon lines to ensure suspension mixing in the 1st lagoon and below the 2nd lagoon line to ensure facultative conditions in the 2nd lagoon. Influent COD concentration and flow values that fall midway in this band are best because the higher above the 1st lagoon lines, the higher the mixing energy for suspension mixing and the lower below the 2nd lagoon line, the lower the mixing energy for facultative conditions. Figure 9 is valid for 14°C and 1 000 m altitude - higher temperatures and lower altitudes move the relative positions of the lines, but not by very much. However, these figures are not intended to be design charts but only to illustrate the principles involved in aerated lagoon process design. Influent COD concentration and flow combinations for suspension mixing in the 1st lagoon and facultative conditions in the 2nd lagoon will be affected significantly by different aeration system parameters to those in Table 3, in particular the standard OTR (Rstd) of the aeration device and the impurity correction factors for the oxygen mass transfer coefficient KLa (α) and saturated DO concentration (β). While the trends shown in Figs 7 to 9 are general and can be used for establishing the feasibility of treating a particular wastewater in an aerated lagoon system, it is recommended that detailed process design calculations are undertaken for each particular case using the equations developed in this paper. Furthermore, the lower and upper bounds for the influent COD concentration at different influent flows (Fig. 9) are based entirely on the premise that all the mixing energy is supplied by the aeration device. If the aeration mixing energy is supplemented, the lower bound on the 1st lagoon will fall away. However, the upper bound on the 2nd lagoon cannot fall away unless the aeration mixing energy can somehow be reduced without reducing the oxygen transfer. Finally, a matter of primary importance in design, but which is not addressed in this paper and therefore left to the expertise and experience of the design engineer, is how the aeration device's mixing energy is most effectively distributed into the lagoon volume - it is well known that different aeration devices have significantly different mixing efficiencies.
An alternative to the facultative lagoon is the facultative oxidation pond. Here it is difficult to determine a retention time. The fact that the pond receives organics (BOD) which are virtually all in a particulate solids form would aid settling of this material to the base of the pond. Probably, a pond of 5 to 7 d retention time, 1.5 m deep would be satisfactory. Balashi and Sperber (1975) report on the behaviour of such oxidation ponds. Effluent from a suspension mixed lagoon with 5 to 11 d retention time was discharged into an oxidation pond which was 60% of the volume of the aerated lagoon. The depth of the pond was 1 m. Although an estimated 170 t VSS mass was discharged to the oxidation pond over a period of 2 years, only 40 t accumulation was measured in the sludge layer. No problems with odour development were noted. Based on this experience, it seems that a facultative pond following suspension mixed lagoons is also an appropriate method of wastewater treatment, particularly where space is not limiting.
CONCLUSION
The different kinds of aerated lagoons, which exclude anaerobic pre-treatment ponds, were described and the design approach for aerated lagoons was explained, viz., ensuring the 1st lagoon is suspension mixed and the second is facultative. By careful selection of the hydraulic retention time (HRT) of the 1st lagoon (HRTs calculated with the general activated sludge simulation model are given in the paper), it can be accepted that the influent biodegradable organics are completed utilized and transformed to OHO active VSS in the 1st lagoon - it behaves very similarly to the single completely mixed AS system and the full growth-endogenous respiration AS model is applied to the design of the 1st lagoon. With no growth of OHO biomass in the 2nd lagoon, it behaves similarly to the single or in-series reactor waste AS aerobic digester and only the endogenous respiration part of the model is applied to the design of the 2nd (and additional) lagoons.
Even if biodegradation of the influent biodegradable organics is virtually complete in the 1st lagoon, the COD removal is still low. This is because the AS formed in the 1st lagoon is part of the unfiltered effluent COD because the lagoon is suspension mixed. In fact, the power input of the aeration system in the 1st lagoon, sized to supply the growth and endogenous respiration oxygen demands, is usually sufficient for suspension mixing of high influent COD concentration agro-industry wastewaters. The filtered effluent COD is very low because (depending on the wastewater type and HRT) most of the influent soluble biodegradable organics are utilized and transformed to OHO VSS mass. In most wastewaters, including municipal wastewater, the soluble biodegradable organics are readily biodegradable and OHO mass is produced very rapidly from it. This OHO mass accelerates the utilization of the slowly biodegradable particulate organics, but that not utilized in the HRT of the 1st lagoon is enmeshed with the AS and so is removable by settlement (or filtration) in the 2nd lagoon. This is the main purpose of the 2nd (and 3rd) facultative lagoon. In fact, the power input of the aeration system in the 2nd (and 3rd) lagoon, sized to supply mainly the endogenous respiration oxygen demand, is usually insufficient for suspension mixing even though the oxygen demand in it is calculated assuming complete mixing. The unfiltered effluent COD from the 2nd (and 3rd) lagoons is therefore mainly the COD of the remaining non-settleable AS (which is small) and the unbiodegradable soluble COD. The COD of filtered effluent is mainly the unbiodegradable soluble organics (USO).
Because selection of HRT of the 1st lagoon is important to ensure complete utilization of the influent biodegradable organics, minimum retention times to achieve this at 14°C and 22°C were determined with the general AS kinetic simulation model UCTOLD (Dold et al., 1980, 1991) which gives identical results to Activated Sludge Model No 1 (ASM1, Henze et al., 1987; Dold and Marias, 1986) for (i) readily biodegradable soluble organics (BSO) only, slowly biodegradable particulate organics (BPO) only, real municipal wastewater (20% BSO and 80% BPO) and real municipal wastewater with 5% OHO active VSS mass seed. The minimum hydraulic retention times were found to be at 14°C 1.3, 3.0, 2.0 and 1.5 d, respectively, and at 22°C 0.3, 2.0, 1.2 and 1.0 d, respectively. From a comparison of the simulation results with the steady-state model calculations, washout of OHOs takes place at about 75% of these retention times.
Approximate equations to estimate the power requirements for aeration by mechanical surface aerators and mixing are given. These equations are combined with those of the steady-state AS model for calculating the oxygen requirements and the aeration power density (W/m3) in each lagoon. With these equations it is shown that influent COD concentration needs to be between an upper and lower limit band to ensure that the 1st lagoon is suspension mixed and the second lagoon is facultative. This influent COD concentration band decreases as the influent flow increases, e.g., at 0.5 ML/d the influent COD needs to be between 2 600 and 9 000 mg/L, but at 15 ML/d between 500 and 2 000 mg/L. The important conclusion arising from this is that if the aerated lagoon system is applied for small low-flow rural communities, where land for these large systems is likely to be available, then additional mixing energy over and above that required for aeration will need to be provided to ensure that the 1st lagoon is suspension mixed. Due to the higher than normal activated sludge energy requirements this will necessitate, it is unlikely that aerated lagoons will be applied for treating municipal wastewater from small towns. Matching mixing and aeration power requirements is easier for agro-industrial organic wastewaters which usually have significantly higher influent organic strengths (COD) than municipal wastewaters.
ACKNOWLEDGEMENTS
This paper was commenced by Professor Gerrit van Rooyen Marais, Professor of Water Resources and Public Health Engineering at the University of Cape Town from 1967. He continued working on it after his retirement in 1992 with Professor Mark Wentzel but it remained unfinished at Mark Wentzel's permanent medical boarding in 2007 and Gerrit Marais' passing away in 2009. Working from their drafts and notes, I was able to finish it for publication.
REFERENCES
BALASHI E and SPERBER H (1975) Treatment of domestic wastes in an aerated lagoon and polishing pond. Water Rese. 9 43 https://doi.org/10.1016/0043-1354(75)90151-7 [ Links ]
BEYCHOK MR (1971) Performance of surface aerated basins. Water 1970, Chem Eng Prog: Symposium Series, 67 322. [ Links ]
DOLD P L, EKAMA G A and MARAIS GvR (1980) A general model for the activated sludge process. Prog. Wat. Tech. 12 (Toronto) 347-358. [ Links ]
DOLD P L and MARAIS GvR (1986) Evaluation of the general activated sludge model proposed by the IAWPRC task group. Wat. Sci. Technol. 18 (Copenhagen) 63-89. [ Links ]
DOLD P L, WENTZEL M C, BILLING A E, EKAMA G A and MARAIS GvR (1991) Activated sludge system simulation programs (Version 1.0). Water Research Commission, Private Bag X03, Gezina, 0031, South Africa. [ Links ]
ECKENFELDER WW (1966) Industrial Water Pollution Control. McGraw-Hill, New York. [ Links ]
EKAMA GA, WENTZEL MC and SÖTEMANN SW (2006) Mass balanced plant wide wastewater treatment plant models Part 2 - Tracking the influent inorganic suspended solids. Water SA 32 (3) 277-285. [ Links ]
GLOYNA (1971) Waste Stabilisation Ponds. WHO monograph series No 60. WHO, Geneva. [ Links ]
HENZE M, GRADY C P L Jr, GUJER W, MARAIS GvR and MATSUO T (1987). Activated Sludge Model No.1. IAWQ Scientific and Technical Report No.1. IAWQ, London. [ Links ]
HENZE M, GUJER W, MINO T and VAN LOOSDRECHT MCM (2000). Activated Sludge Models Nos 1, 2, 2d and 3. IWA Scientific and Technical Report No 9. IWA, London. ISBN 1 900 222248. 121 pp. [ Links ]
HENZE M, VAN LOOSDRECHT MCM, EKAMA GA and BRDJANOVIC D (2008) Biological Wastewater Treatment - Theory, Modelling and Design. IWA Publishing, London, UK. ISBN 13: 9781843391883. [ Links ]
MARAIS GvR (1966) New factors in the design, operation and performance of waste stabilisation ponds. Bull. WHO. 34, 737-763. [ Links ]
MARAIS GvR (1970) Dynamic behaviour of oxidation ponds. 2nd Intnl Symp on Waste Treatment in Lagoons, Kansas City. [ Links ]
MARAIS GvR and EKAMA GA (1976) The activated sludge process Part 1 - Steady state behaviour. Water SA 2(4) 163-200. [ Links ]
PHELPS EB (1944) Stream Sanitation. John Wiley & Sons, New York. [ Links ]
VON DER EMDE W (1969) Entwurf Beluftungssysteme, Wiener Mitteilungen, 4, Abwasserreinigungsanlagen - Entwurf, Bau, Betrieb, Vienna. [ Links ]
WPCF/ASCE (1988) Aeration - Manual of Practice FD-13, Water Pollution Control Federation, ASCE Manuals and Reports on Engineering Practice No. 68. American Society of Civil Engineers, Reston VA. [ Links ]
WRC (Water Research Commission, South Africa) (1984) Theory, design and operation of biological nutrient removal activated sludge systems. (Ed.: Wiechers HNS). WRC Report No. TT16/84, Water Research Commission, Pretoria. ISBN 0 908356 13 7. [ Links ]
Received 2 September 2016
Accepted in revised form 17 March 2017
* To whom all correspondence should be addressed. e-mail: george.ekama@uct.ac.za
Modelling the BOD test with the activated sludge model
Relationships for the COD/BOD5 ratio at different stages of biological treatment are derived below with the aid of the AS theory set out by Marais and Ekama (1976). The COD/BOD5 is required to recast the COD-based steady-state AS model into BOD5 terms for design of aerated lagoons, which have a long history based on BOD5.
Accepting the wastewater organics (COD) fractionation into soluble and particulate and biodegradable and unbiodegradable fractions, the biodegradable COD of influent wastewater (Sbi) in terms of the total COD (Sti) is given by Eq. 1 in the paper.
In the BOD bottle, the biodegradable organics (Sbi) are all utilized by the ordinary heterotrophic organism (OHO) seed and metabolized into active OHO mass. The oxygen utilized and the OHO biomass formed in the catabolism and anabolism parts of the metabolic growth process are given by Marais and Ekama (1976) as:


where:
YH = OHO yield coefficient = 0.45 mgVSS/mgCOD
fcv = COD/VSS ratio of the OHO biomass = 1.48 mgCOD/mgVSS
The COD/VSS ratio of 1.48 was found from many years of experimental work with AS systems treating real municipal wastewater and is the default value in the IWA ASMs (Henze et al., 2000).
After growth of the OHO biomass, it undergoes endogenous respiration as outlined by Marais and Ekama (1976). The oxygen utilization rate for endogenous respiration is given by their Eq. 20, i.e.:

where:
fH = unbiodegradable fractions of OHO VSS mass
bHT = specific endogenous respiration rate at T°C
The specific endogenous respiration rate, bH, was measured in batch aerobic digestion tests by Marais and Ekama (1976) and confirmed by Ekama et al. (2006). It was found to be independent of sludge age of the AS system but slightly sensitive to temperature, viz.:

where:
bH20 = specific endogenous respiration rate at 20°C = 0.24/d
In the endogenous respiration process, the OHO VSS concentration XBH declines with time at the 1st order bH rate and generates an unbiodegradable particulate endogenous residue XE, i.e.:

Integrating Eq. A5 over time yields the OHO VSS concentration time at under batch test conditions, i.e.:

Substituting Eq. A6 into Eq. A3 and integrating again yields the cumulative oxygen utilized for endogenous respiration Oet after time t, i.e.:

and accepting Oe = 0 at time t = 0, yields:

Adding to this the catabolic growth oxygen demand, Os (Eq. A1), which assumes growth is instantaneous, yields the cumulative carbonaceous oxygen demand at time t days (Oct), which is the theoretical BOD at time t, i.e.:

Substituting Eq. A2 for XBHi, 5 d and infinity for t yields the BOD5, BODu and their ratio:

Substituting the total COD Sti, yields for the BOD5

and hence the theoretical approximation of COD/BOD5 ratio based on the steady-state AS model is:

From the Phelps (1944) empirical relationship for the BOD time curve (see Fig. A1), i.e.:

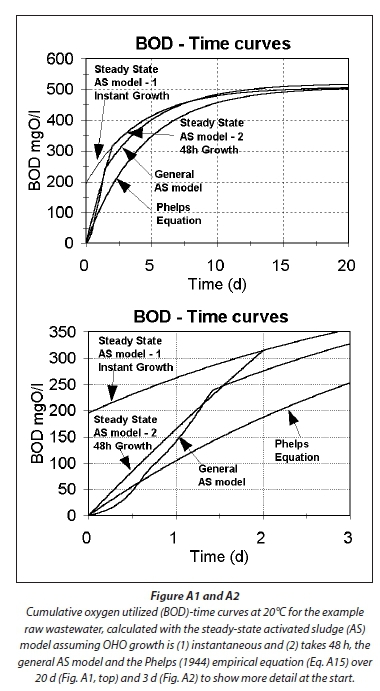
where K = 0.23/d at 20°C.
allows a relationship to be made between the BOD5 and the ultimate BOD (BODu at 20 d), i.e.:

The similarity at 20°C between the Phelps K (0.23/d) and the endogenous respiration rate (0.24/d) of the growth-endogenous respiration model confirms this approach to modelling the BOD test.
Taking the example raw and settled wastewater (WW) values for fS 'us and fS 'up given in WRC (1984), i.e. Raw WW: fS'us = 0.07, fS'up = 0.15 and Settled WW: fS'us = 0.117, fS'up = 0.04, yields COD/BOD5 ratios of 1.81 and 1.67 respectively from Eq. A13. The settled wastewater value is considerably lower than the measured mean values given for settled wastewater by Marais and Ekama (1976). Combining Eq. A11 for BODu with Eq. A15 of Phelps for the BOD5/BODu ratio yields COD/BOD5 ratios of 2.17 and 2.01 for the example raw and settled wastewaters, respectively. The raw wastewater value is reasonably close to the 2.1 value often used in South Africa for the COD/BOD5 ratio for raw wastewater, and the settled wastewater value is close to the values reported by Marais and Ekama (1976) in their Table 2. Thus, the assumption in Eq. A10, that OHO growth is instantaneous, does not appear valid.
Plotting the theoretically calculated BOD time curves with the steady-state (Eq. A9) and general AS models such as UCTOLD (Dold et al., 1980; 1991) or IWA ASM No1 (Henze et al., 1987) provides further evidence for the validity of the above approach for calculating the COD/BOD5 ratio with the AS model. Figures A2 and A3 show the BOD time curves for the example raw wastewater calculated from (1) the steady-state AS model (Eq. A9) assuming growth of OHO mass is (1.1) instantaneous and (1.2) complete after 48 h, (2) the general AS model, which makes a distinction between rate of utilization of readily biodegradable soluble organics (BSO) and slowly biodegradable particulate organics (BPO) and (3) the empirical Eq. A14 of Phelps (1944). For the general AS model line, the default kinetic and stoichiometric constants were used and the OHO seed (as COD) was 2% of the influent COD.
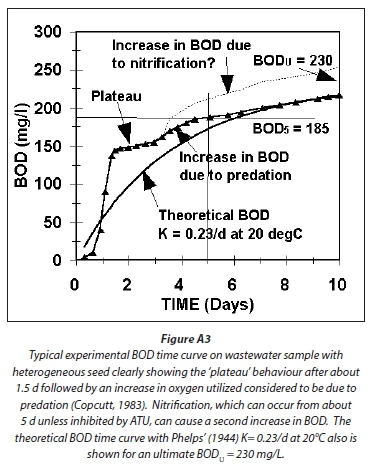
Comparing Figs A1 and A2 with Fig. A3, which shows a typical experimentally observed BOD time curve and the Phelps' Eq. A14, the following can be noted:
1. The BODu is predicted to be virtually the same for all four methods, i.e., about 510 mg/L for the 750 mgCOD/L example raw wastewater.
2. The BOD5 for the steady-state AS model methods are closely similar, i.e., about 410 mg/L, which is about 80% of the BODu. This is somewhat higher than the Phelps Eq. A14 predicted BOD5, which is 68% of the BODu, i.e. 345 mg/L. From Fig A3, the experimentally observed BOD5/BODu ratio also is around 80% (185/230), which is higher than the Phelps value of 68% (157/230). Therefore, the AS model estimates of the BOD time curve appear closer to that experimentally observed than the Phelps equation, but the difference is small: If the BODu in Fig A3 is 250 mg/L instead of 230 mg/L, the Phelps equation cuts through the experimentally observed BOD5 = 185 mg/L point (185/250 = 0.74). However, as noted above the steady-state AS model estimates for the BOD5/BODu ratio do give COD/BOD5 ratios that are higher than observed values (Table 2 in Marais and Ekama, 1976), and those implemented in practice.
3. Figure A2 shows an initial lag in the BOD time response and then a rapid increase with a plateau at ~1.5 d. The general AS model (Fig. A2) shows a similar response. In the model, the initial lag is due to the very low initial seed OHO concentration (3% of total COD). Because growth on readily BSO is rapid, the OHO concentration rapidly increases and causes the sharp increase in BOD. After ~0.65 d, the BSO is all utilized but growth continues on the slowly BPO, which stops at ~1.5 d. Although the specific OHO growth rate on BPO is about 1/10th of that on BSO, after 0.65 d, the actual BPO utilization rate is reasonably high because the OHO concentration has increased due to the rapid growth on BSO. Therefore, the BOD continues to increase steeply while utilizing the BPO. Once the BPO is completely utilized at ~1.5 d, OHO growth ceases and the BOD increases much more slowly due to the slow endogenous process. The delay of 1.5 d in complete BPO utilization causes the OUR associated with the endogenous process also to be delayed (shift to the right in Fig. A1), giving a BOD5 value of about 392 mg/L which is 77% of the BODu. Thus, the general model BOD5/BODu ratio (0.77) lies between that of the steady-state AS models (0.80) and that of Phelps (0.68), and illustrates the uncertainty in this value.
The above discussion demonstrates that the AS models simulate the BOD time curve reasonably well. While the general model simulates it better than the steady-state model, the latter nevertheless gives a reasonable 1st estimate of COD/BOD5 ratio; this can be refined from the BOD5/BODu ratio of Phelps (as demonstrated above), or from that of the general AS model. The relationships developed above therefore can be used when converting from COD to BOD5 units.
List of symbols and abbreviations
List of symbols
α oxygen transfer rate (KLa) correction term for impurities
β DO saturation concentration correction term for impurities
γ COD to BOD5 conversion factor
θ oxygen transfer rate (KLa) correction term for temperature
bH OHO endogenous respiration rate. Additional subscript T or 20 denotes T or 20°C
BOD5i influent BOD5 concentration (mgO/L)
BOD5n unfiltered BOD5 concentration in and exiting nth lagoon (mgO/L)
BOD5fn filtered BOD5 concentration in and exiting nth lagoon (mgO/L)
ΔBOD5 change in BOD5 concentration (influent minus effluent) (mgO/L)
CL DO concentration in lagoon (mgO/L)
CSstd saturation DO coentration under standard (STP) conditions
fcv COD/VSS ratio of infl;uet UPO and OHO biomass = 1.48 mgCOD/mgVSS
fH unbiodegradable fraction of OHO biomass = 0.20 mgVSS/mgOHOVSS
FOcn flux oxygen demand (kgO/d) required for organics removal in nth lagoon
fS'up unbiodegradable particulate organics (USO) fraction of total COD
fS'us unbiodegradable soluble organics (UPO) fraction of total COD concentration
K substrate utilization rate in the BOD time equation of Phelps (1944)
KLa oxygen mass transfer coefficient (/d)
Kv substrate utilization rate in VSS and COD units. Additional subscript T or 20 denotes T or 20°C
KvB substrate utilization rate in VSS and BOD5 units. Additional subscript T or 20 denotes T or 20°C
MXBHn mass OHO biomass in nth lagoon (kgOHOVSS)
Oc oxygen utilization rate for organic removal [mgO/(l·d)]. Additional subscript t denotes rate at time t
Oe oxygen utilization rate for endogenous respiration [mgO/(l·d)]. Additional subscript t denotes rate at time t
Os oxygen utilization rate for OHO growth (catabolism) [mgO/(l·d)]
p20 saturation vapour pressure for water at 20°C (mmHg)
pact saturation vapour pressure for water at site temperature (mmHg)
Pact atmospheric pressure under site conditions (mmHg)
Pdn power density for aeration in nth lagoon (W/m3)
Pn power requirement for aeration in nth lagoon (kW)
pstd saturation vapour pressure for water at standard temperature (mmHg)
Pstd atmospheric pressure under standard (STP) conditions (mmHg)
Qi influent flow rate (ML/d)
Ract oxygen transfer rate under site conditions
Rhn hydraulic retention time (HRT) of the nth lagoon. Subscript min denotes minimum.
Rs sludge age or solids retention time (SRT) in days
Rstd oxygen transfer rate under standard (STP) conditions
Sbi influent biodegradable COD concentration
Sbn residual biodegradable COD concentration exiting nth lagoon
Stfn filtered COD concentration exiting nth lagoon.
Sti influent total COD concentration
Stn unfiltered COD concentration exiting nth lagoon
Supi influent unbiodegradable particulate organics (UPO) COD concentration
Susi influent unbiodegradable soluble organics (USO) COD concentration
Susn unbiodegradable soluble organics (USO) COD concentration exiting nth lagoon
t time
T Temperature in °C
Vn volume of nth lagoon (m3)
XEn concentration of OHO endogenous residue in nth lagoon (mgVSS/L)
XIi influent unbiodegradable particulate organics (UPO) VSS concentration
XIn concentration of UPO exiting nth lagoon (mgVSS/L)
Xvn concentration of OHO biomass in and exiting nth lagoon (mgOHOVSS/L)
YH OHO yield coefficient = 0.45 mgOHOVSS/mgCOD
YHB OHO yield coefficient in terms of BOD5 = γ 0.45 mgOHOVSS/mgBOD5
List of Abbreviations
AS activated sludge
ASM1 Activated Sludge Model No 1
BOD5 5 day biochemical oxygen demand
BODu ultimate (20d) biochemical oxygen demand
BPO biodegradable particulate organics
BSO biodegradable soluble organics
COD chemical oxygen demand
DO dissolved oxygen
N nitrogen
OD oxygen demand
OHO ordinary heterotrophic organisms
OTR oxygen transfer rate
P phosphorus
SS steady state
STP standard temperature (20°C) and pressure (1 atm = 760 mmHg)
TKN total Kjeldahl nitrogen
UPO unbiodegradable particulate organics
USO unbiodegradable soluble organics
VSS volatile suspended solids
WW wastewater


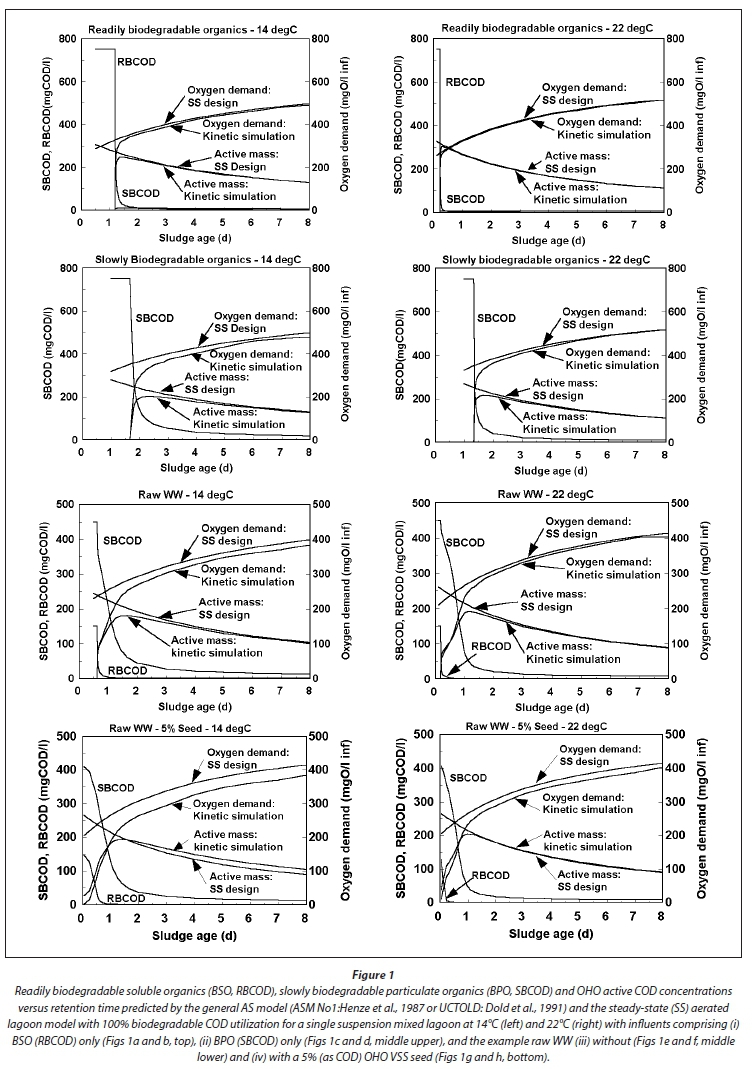
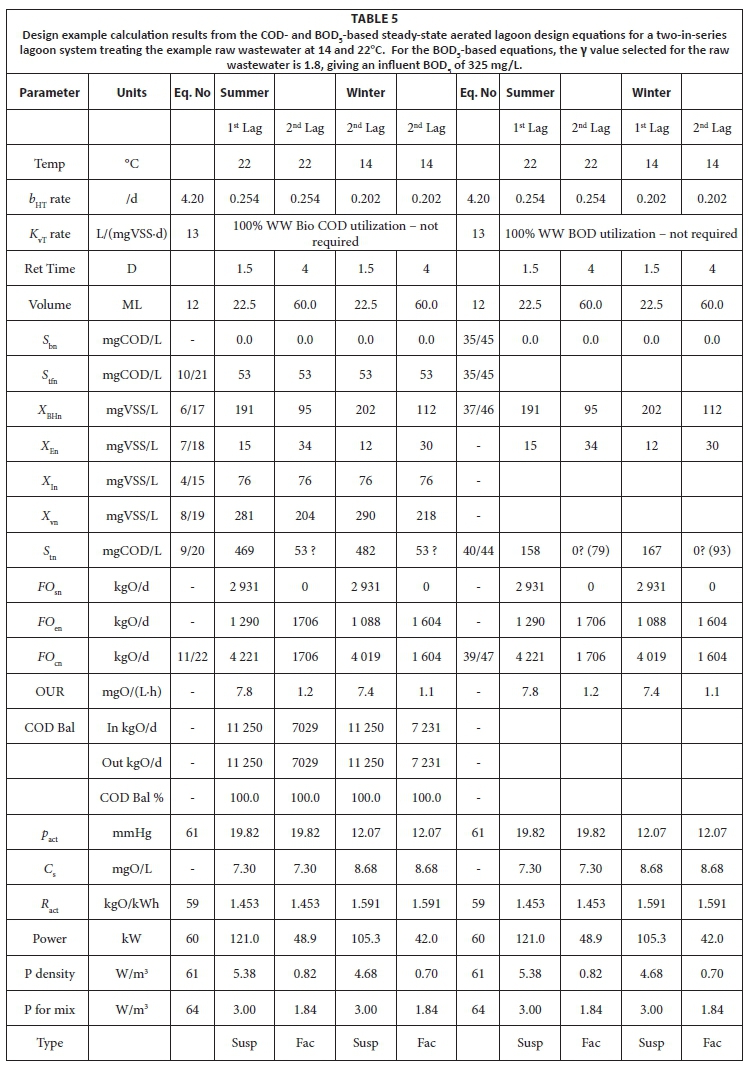