


Servicios Personalizados
Articulo
 Inglés (pdf)
 Articulo en XML
 Referencias del artículo
Indicadores

Links relacionados
-
 Citado por Google
 -
 Similares en Google
Compartir

 Permalink
Water SA
versión On-line ISSN 1816-7950
versión impresa ISSN 0378-4738
Water SA vol.43 no.2 Pretoria abr. 2017
http://dx.doi.org/10.4314/wsa.v43i2.07
Determinant of farmers' ability to pay for improved irrigation water supply in rural KwaZulu-Natal, South Africa
Sinenhlanhla Njoko; Maxwell Mudhara*
School of Agricultural, Earth and Environmental Sciences, University of KwaZulu-Natal, Private Bag X01, Scottsville 3209, Pietermaritzburg, South Africa
ABSTRACT
The aim of this study was to determine smallholder farmers' ability to pay (ATP) for improved irrigation water supply, using their gross margins, in rural KwaZulu-Natal, South Africa. The analysis was conducted on a sample of 161 irrigators. Production data were collected from the irrigators and the residual imputation method (RIM) was used to calculate the gross margins that the farmers realised. An ordinary least squares regression was used to investigate factors affecting ATP. Results indicate that factors such as labour, training, household assets and road conditions positively influence ATP. The study highlights the importance of support to farmers and their institutions. The study also concludes that farmers are making profits from their irrigated crops, especially tomatoes, and therefore recommends that farmers start paying for the water used for their crops.
Keywords: smallholder irrigation, ability to pay, residual imputation method, gross margins, OLS regression
INTRODUCTION
Smallholder irrigation is an important rural development factor, creating employment opportunities, generating income and enhancing food security in Africa in general, and in South Africa (SA) in particular (Bacha et al., 2011; Van Averbeke et al., 2011; Denison and Manona, 2007; Speelman, 2009). As a result, South Africa has invested in the sector by rehabilitating existing irrigation schemes (Perret and Geyser, 2007). In 2012 the government budgeted R15 million for rehabilitation of smallholder irrigation schemes (DAFF, 2012). On the other hand, the agriculture sector, being the largest water user, is under pressure to release water to other sectors (Kanyoka et al., 2008). The growing water scarcity continues to put pressure on farmers to use water more efficiently. A growing area of interest in SA is that of finding balanced and effective resource management strategies for allocating water among the key sectors (Speelman, 2009; Yokwe, 2006).
Effective water resource management requires that water be treated as an economic good. As such, making rational decisions about water resource management requires reliable estimates of the economic value of water (Speelman, 2009; Hellegers and Perry, 2006). Knowledge of this value contributes significantly in designing fair, informed and rational pricing systems, providing incentives to irrigators to use water sparingly and efficiently, and allowing recovery operations and maintenance (Perret and Geyser, 2007). Moreover, understanding water values plays an important role when making investment decisions in water resources development, and policy decisions on sustainable water use and water allocations.
In South Africa, the issue of water valuation among small-scale irrigation schemes is topical, following the new water policy released by the Minister of Water Affairs and Forestry in April 1997. According to the new policy, water subsidies paid to farmers will gradually decrease as they will increasingly have to pay for their water use (DWAF, 2004). It is in this context that studies investigating willingness to pay (WTP) are more widely available (Adepoju and Omonona, 2009; Akter, 2006; Alhassan, 2012; Bogale and Urgessa, 2012; Futija et al., 2005; Kanyoka et al., 2008; Moffat et al., 2011; Ndetewio et al., 2013). Ability to pay (ATP) studies are not common and yet are important, since, whilst irrigators may be willing to pay for improved water services, the question of their ability to do so still remains. While WTP is a maximum amount which water-users are willing to pay for a given service, it is difficult to directly use this as basis of setting tariffs as there are variations in characteristics that determine this willingness (Ndetewio et al., 2013). Moreover, it is necessary to set the irrigation water fee at a price level that the majority of irrigators can actually afford to pay, especially where most of these farmers depend on irrigation for their livelihoods. For that purpose, ATP is frequently referred to and used as it reflects an affordable price.
The ATP is considered as the amount which irrigators can pay for water for their cropping needs and is calculated with reference to gross margins (Fujita et al., 2005). Charging farmers for irrigation water should be done carefully because if prices are set too low, revenues may not be sufficient to cover the full costs of supplying water. On the other hand, if water prices are set too high, irrigators may not be able to afford the new improved irrigation water supply. Therefore, to set the required water price, information on the ability of irrigators to pay for such services is essential. Since pricing of water is a key component of an appropriate incentive for efficiency, sustainability and accountability, there is a need to research the demand for the service in order to understand the fundamental value that irrigators place on the improved water service, so that the price that reflects the ability of the irrigators to pay for the improved water services can be established (Alebel, 2002). This study, therefore, aimed to estimate the amount farmers are able to pay for irrigation services using farmers' gross margins. Furthermore, the study investigates the factors that determine farmers' ATP for irrigation in Msinga Local Municipality. The study was part of a project initiated, managed and funded by the Water Research Commission (WRC) (K5/2176) entitled 'Empowerment of women in rural areas through water use security and agricultural skills training for gender equity and poverty reduction in KwaZulu-Natal (KZN) and North West Province'.
STUDY AREA
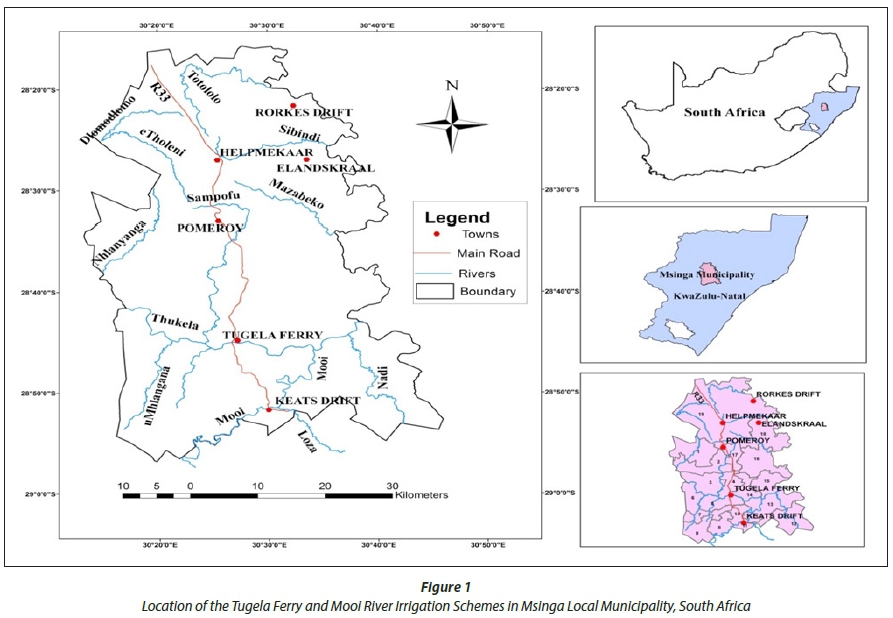
Primary data for the study were collected in Msinga Local Municipality, Mzinyathi District, South Africa. Over 70% of this land (1 725 km2) is under traditional authority while the remaining 30% is commercial farm land (Dearlove, 2007). Much of the terrain is located in deep gorges of the Tugela and Buffalo rivers. This effectively isolates the municipal area from the immediate surrounding municipal areas.
Msinga has very limited employment opportunities. Agriculture is one of the most important economic sectors in Msinga, with most households engaged in smallholder farming (Cousins, 2012; Sinyolo, 2013). Rain-fed crop production, however, is very challenging in Msinga because the area is both hot and dry. The area is characterized by frequent droughts, making irrigation the main mode of household food production (Cousins, 2012). One opportunity that exists for some of the rural people to increase incomes and participate in the local economy is provided by irrigation farming, specifically in the Tugela Ferry and Mooi River Irrigation Schemes. The two irrigation schemes play an important role in the local economy of Msinga as sources of food, employment and market for agricultural inputs (Cousins, 2012; Gomo, 2012; Sinyolo, 2013) Figure 4.1 shows the location of Msinga Local Municipality in SA.
The distinctive features of irrigation farming in the Msinga schemes are very similar to those found in other low-cost, gravity-fed schemes in South Africa. They are similar in plot sizes, which are small. In irrigation schemes like Msinga plot sizes are 0.1 ha, although farmers can accumulate a number of plots and end up with an average of 0.24 ha each (Sinyolo et al., 2014). The systems of production are highly labour-intensive and common cash crops grown include green maize, tomatoes, cabbage, potatoes, and leafy green vegetables. The production of specialized types of fresh produce like garlic, beetroot, etc., for niche markets is absent or very limited (Denison and Manona, 2007; Van Averbeke and Khosa, 2011; Cousins, 2012).
The Tugela Ferry Irrigation Scheme (TFIS) is located on both banks of the Tugela river, which supplies the scheme with water. The scheme was planned and constructed by the Natal Native Trust between 1898 and 1902 and has been operational ever since (Cousins, 2012). The scheme is made up of 7 blocks of irrigable land covering 837 ha (Cousins, 2012; Fanadzo, 2012). A total of about 1 500 irrigators participate in the scheme, growing various crops. According to Cousins (2012), the Tugela Ferry irrigators comprise about 15% of all smallholder irrigation farmers in the KZN Province (Sinyolo, 2013).
Farmers in the irrigation scheme were initially allocated 2 plots each of 0.1 ha in size. Over time, some farmers acquired more plots through leasing or borrowing. The main access to land is through the traditional authorities who allocate land to households. Selling of land is not permissible under the current traditional land tenure system.
Initially, all of the blocks were to receive water from the main gravity-fed canal; however, over time water shortages have persisted, leaving only 4 blocks to benefit from the canal while other blocks use motorized pumps. The 4 blocks receiving water under the gravity system use a canal that is 31 km long to draw the water. Another block uses a diesel pump whilst the remaining 2 blocks use electric pumps.
In the Mooi River Irrigation Scheme (MRIS), a diversion constructed across the Mooi River abstracts water into a canal, which runs for a distance of 20.8 km from the abstraction point to the end of the scheme (DAEA, 2011). The scheme has 15 blocks of different sizes. The exact year that the scheme was established is not known; however, it is speculated that it may have been early in the 20th century. Most of the farmers currently in MRIS and TFIS, and even some non-members, grew up with their parents participating in the scheme. Essentially, the purpose of the scheme is to improve the livelihoods of those in the surrounding areas through food production and job creation (Gomo, 2012). The scheme covers a total area of 600 ha, divided into plots which are 0.1 ha. The scheme is made up of approximately 824 farmers, each occupying at least 1 plot; however, some farmers occupy more than one (DAEA, 2011). Irrigators do not have other land outside the irrigation scheme, although dryland farming is prevalent in other parts of the area.
The scheme is managed through block committees, which, amongst other things, see to the distribution of water. As a whole, the scheme is managed by the Irrigation Management Committee which ensures equitable water distribution and resolves conflicts (Gomo, 2012). The first 11 blocks draw water under gravity and the last 4 blocks receive water that is diesel pumped. Initially, all the blocks received water from the main canal, but water shortages due to leakages and multiple uses, and increased numbers of participants, has meant that only the first 11 blocks benefit from the gravity-fed canal (Gomo, 2012).
METHODS
Data collection
A structured questionnaire was used to interview the farmers who were household heads. The data collected include household characteristics, land, crop systems, market, sources of off-farm income, credit, water management aspects, and problems associated with agricultural practices in general. The questionnaire was pre-tested and modified accordingly to improve its reliability and validity. Field data were collected in November 2013 over a period of 3 weeks from 2 irrigation schemes, i.e., MRIS and TFIS.
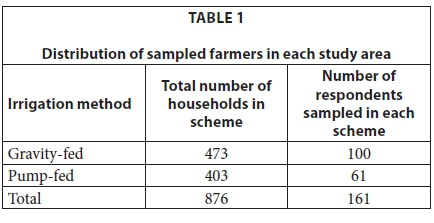
Households in the two study sites were stratified into gravity-fed and pump-fed irrigators (Table 1). Gravity-fed irrigators in Tugela Ferry were not included in the study as the scheme was under rehabilitation at the time of the survey. The farmers had not been producing crops for a year, which made it difficult for irrigators in that part of the scheme to meaningfully participate in the survey. The proportional random sampling method was used to select the women used for the study, in order to equally represent the categories of gravity-fed and pump-fed farmers. A random sampling procedure was employed to select a total of 161 respondents, where 131 were from the MRIS and 30 were from TFIS. Most blocks in TFIS where not functional during the time of the survey. Hence, a sample of 30 farmers was a fair representation of the operational units in the scheme.
Residual imputation method
The residual imputation method (RIM) was used to measure the return to water out of the gross margin obtained from all the production inputs employed. The residual imputation method is the most frequently used approach to applied shadow pricing of producers' goods, particularly for irrigation water (Young, 1996; Speelman, 2009; Yokwe, 2006). For the RIM, the incremental contribution of each input in the production process is determined. If appropriate prices can be assigned by market forces to all inputs but one, the remainder of total value of product is attributed to the remaining or residual input, which in this case is water (Young, 1996; Lange and Hassan, 2007).
The residual valuation assumes that if all markets are competitive, except the one for water, the Total Value Product (TVP) equals exactly the opportunity costs (OC) of all the inputs:
TVP = ∑ VMPi*Qi +VMPw*Qw
where: TVP = total value of the commodity produced; VMPi = value of marginal product of input i, VMPw = value of marginal product of water, Qi = quantity of input i used in production and Qw = quantity of water used in production.
It is assumed that the opportunity costs of non-water inputs are given by their market prices. Therefore, the shadow price of water can be calculated as TVP less the costs of all non-water inputs to production and returns to land. The residual, obtained by subtracting the non-water input (including land) costs from total annual crop revenue, equals the gross margin (GM). The GM can be interpreted as the maximum amount the farmer could pay for water and variable costs.
However, the gross margin would also include the replacement costs or depreciation, for the scheme to be sustainable. In other words, the realistic ability to pay is less than the gross margin by the adjustment for depreciation.
The technique is based on two principles, as discussed in Young (1996) and Speelman (2009):
•The prices of all resources should equal returns at the margin. This is a well-known condition for competitive equilibrium, i.e., as would occur if perfectly competitive markets were to exist for all agricultural inputs.
•The total value of production (TVP) can be divided into shares; in such a way that each resource is paid according to the value of its marginal productivity (VMP) and the total product is completely exhausted (Young, 1996; Lange and Hassan, 2007).
The RIM has the advantage of being relatively easy to implement. However, it is sensitive to small variations in the specification of the production function and assumptions about market and policy environment. Therefore, the RIM is only suitable when the residual input contributes a large fraction of the output value, as is the case for water in irrigated agriculture in water-scarce regions (Speelman, 2009; Yokwe, 2006). If an input to production is omitted or underestimated, its contribution is wrongly attributed to water. To overcome this problem, all relevant inputs should be included in the model. Some important inputs like farm labour, including family labour, are often unpaid. A shadow price is then estimated, usually in terms of the opportunity cost of the workers (Young, 1996).
In this study, the revenue earned by the farmers for each crop was calculated by multiplying their production by respective market prices. The portion of total production that was consumed by the household was excluded as it was taken as negligible. Inputs considered relevant in the production process, such as fertilizers, pesticides, energy, tillage, seed, land and labour, were taken into account. For fertilizers and pesticides the competitive market prices were used to determine costs. However, the value of inputs provided to farmers by extension services through the government subsidy scheme, e.g., fertilizers, pesticides and seeds, added to input costs. For inputs and the output, market and individual prices are considered to equal shadow prices.
GM = TVP − ∑PiQi
Where: GM = gross margin and Pi = price of input i.
TVP = [PcQc+ PmQm+ PtQt+ PsQs+ PpQp+ PbQb+ PbuQbu]
∑PiQi = PfQf+ PpeQpe+ PtiQti+ PfuQfu+ PlQl+ PseQse
Qc = Quantity of cabbage heads harvested per hectare
Qm = Quantity of maize harvested per hectare
Qt = Quantity of tomatoes harvested per hectare
Qs = Quantity of spinach bunches harvested per hectare
Qp = Quantity of potato bags harvested per hectare
Qb = Quantity of bean bags harvested
Qbu = Quantity of butternut bags harvested per hectare
Qf = Quantity of fertilizer used per hectare
Qpe = Quantity of pesticide used per hectare
Qti = Number of times tillage done per hectare
Qfu = Number of litres used per hectare
Ql = Number of times labour employed per hectare
Qse = Number of seed packets used per hectare
Pc = Price per cabbage head (R5)
Pm = Price per ton of maize (R3 000)
Pt = Price per tomato crate (R100)
Ps = Price per bunch of spinach (R10)
Pp = Price per bag of potatoes (R40)
Pb = Price per 5kg bag of beans (R40)
Pbu = Price per bag of butternuts (R30)
Pf = Price per bag of 50kg fertilizer (R600)
Ppe = Price per bag of 50kg pesticide (R540)
Pti = Price for tillage per ha (R500)
Pfu = Price of fuel per litre (R12.48)
Pl = Price of labour per day (R20)
Pse = Price per packet of seeds (R11)
Most farmers in Msinga employ family labour. According to Van Averbeke (2008), one of the important advantages of using family labour is flexibility. Individual family members are often faced with the choice between working on the farm and engaging in other economic activities, which may be more rewarding financially, hence motivating family members to work on the farm is a critical management factor. To calculate labour costs, a shadow price of R20/day per person was used. This value for labour costs was estimated based on discussions with farmers and extension officers during focus group discussions and key informant interviews, respectively. According to the focus group discussions and key informant interviews, labour is employed in the plots twice a week, for 4 weeks a month over a cropping season. To calculate the gross margins, the total costs were subtracted from the total revenue and then divided by the land occupied by the farmer in order to get gross margins per hectare.
OLS regression
The Ordinary Least Squares (OLS) method was employed to determine the factors that influence farmers' ATP. The OLS regression model was estimated as follows:
Y= β0+β1X1+β2X2+………+ βiXi +ei
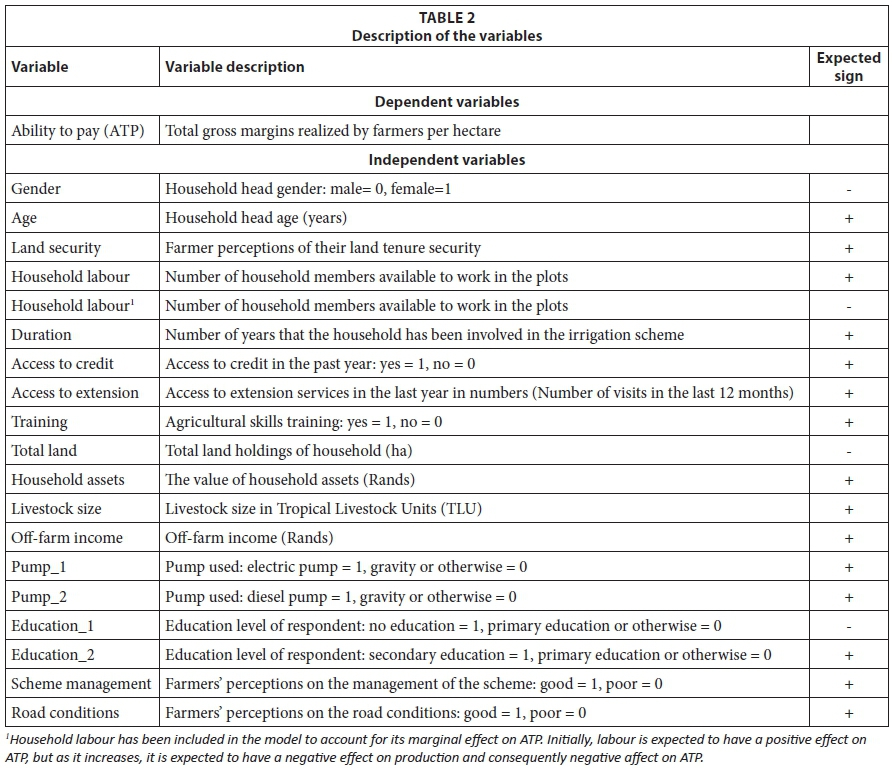
where: Y is the dependent variable, which is gross margin; β's are the parameter estimates, X's are the explanatory variables (Table 2).
RESULTS
Descriptive statistics
The schemes also have some distinctive features: the majority of plot holders are women (88.75%). The average age of the farmers in the schemes was 58 years. This shows that the more elderly are more involved in agriculture. This could be indicative of the fact that the males and the younger population have moved to the cities to explore better opportunities. Household size ranges from 1 to 20, with an average of 7. This could potentially indicate a sizeable amount of family labour, especially when labour availability is mainly dependent on the family size. Of the sampled population, 57% had no education and 16% had obtained secondary education. This shows very low levels of literacy in Msinga. When looking at the duration of time that the farmers have been in the scheme (also a proxy for irrigation-farming experience), the minimum is 1 year and the maximum is 40 years, with a mean duration of 19 years. Experience is expected to aid farmers in increasing both their productivity and profitability.
The production of food crops for home consumption is limited as, according to the farmers, less than 5% is consumed at home whilst the bulk of production is for sale. Farmers are commercially oriented and approach farming as a business. Almost all crops use fertilizers and crop chemicals. The use of hired labour is not common as most farmers employ household labour. An active, informal plot rental market makes it possible for many farmers to gain access to additional plots. More than 30% of farmers indicated that they were leasing some land. This level of land rental could minimise the plots that are not under cultivation in any given year.
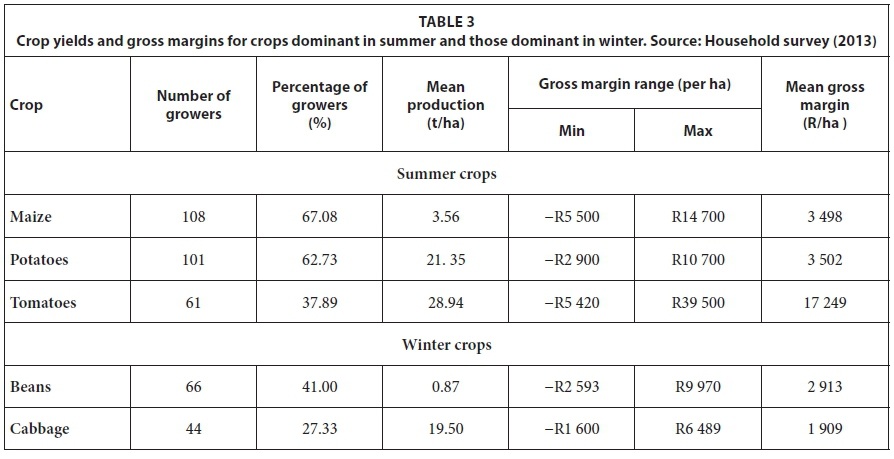
The crops grown by most farmers in summer are maize, which is grown by 67% of the respondents, potatoes, grown by 63%, and tomatoes, grown by 38% of the sample. In winter, beans and cabbage were the dominant crops, with beans grown by 38% of the sample and cabbage grown by 27%.
Table 3 shows the crops grown by season in the schemes and the yields realized. An average of 3.56 t/ha of maize is produced by the farmers in the schemes, with the mean gross margin being 3 497.57 R/ha. According to Mnkeni et al. (2010), maize could potentially yield 8.2 t/ha. The average yield for potatoes is 21.4 t/ha with a mean gross margin of 3 501.79 R/ha. Mnkeni et al. (2010) reports potato yields of 45.3 t/ha. Tomatoes had the least number of growers in summer. This may be due to the costly nature of tomato production, from fertilizers to herbicides and pesticides. On average, the yield of tomatoes was 28.94 t/ha, with an average gross margin of 17 249.41 R/ha. Mnkeni et al. (2010) reported an average potential yield of 47.1 t/ha for tomatoes. The results show that tomatoes had the highest gross margin among the summer season crops. However, gross margins are not the only determinant of farmers' decisions to plant tomatoes, as it is a perishable commodity. For example, access to reliable markets is critical.
With the winter crops, the average production of beans was 0.87 t/ha with an average gross margin of R2 913.14. The number of cabbage producers was lower than for other crops. According to Mnkeni et al. (2010), the potential yield for cabbage is 64.8 t/ha for small-scale irrigators. However, in these schemes, the average yield was 19.50 t/ha and the gross margin was 1 909.19 R/ha per season, reflecting the low price for this crop.
The yields reported in this study are below those reported by Mnkeni et al. (2010). However, this was expected. Lower yields are expected under farmer-managed conditions because of the less than optimal conditions under which they produce crops. This is especially true of Msinga, which experiences unfavourable conditions for agriculture.
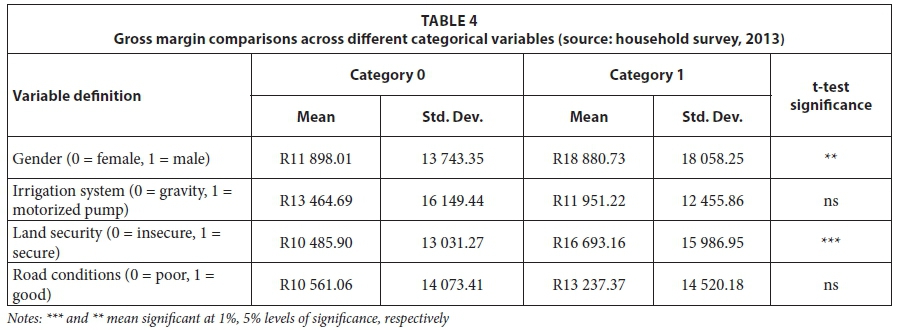
Table 4 shows comparisons of gross margins across categorical variables, and the t-tests presented in the table indicate that there is a statistically significant difference between the gross margins by gender. Males achieve higher gross margins than females, probably because the former have better access to resources, resulting in higher productivity.
The difference between the gross margins of those who felt land secure and their counterparts was statistically significant. On average, the land secure realised higher gross margins compared to the insecure. This is expected as those with secure land tenure invest resources and measures that lead to improved long-term productivity relative to their counterparts. There were statistically significant differences between gross margins based on the type of irrigation water conveyance method. Farmers relying on gravity had higher gross margins compared to those using motorized pumps. Gravity irrigation water is cheaper and hence leads to high gross margins.
Factors affecting ability to pay for water
An OLS model was estimated to determine the household characteristics that predict households' ATP for improved irrigation. The model results are presented in Table 5. The results show that, collectively, all estimated coefficients are statistically significant since the F statistic is statistically significant (p < 0.01). The Adjusted R2 value of about 31% is acceptable considering this is cross-sectional data. The Akaike Information Criteria (AIC) was employed to check whether the model was correctly specified. The results showed that the OLS was a correct specification of the model.
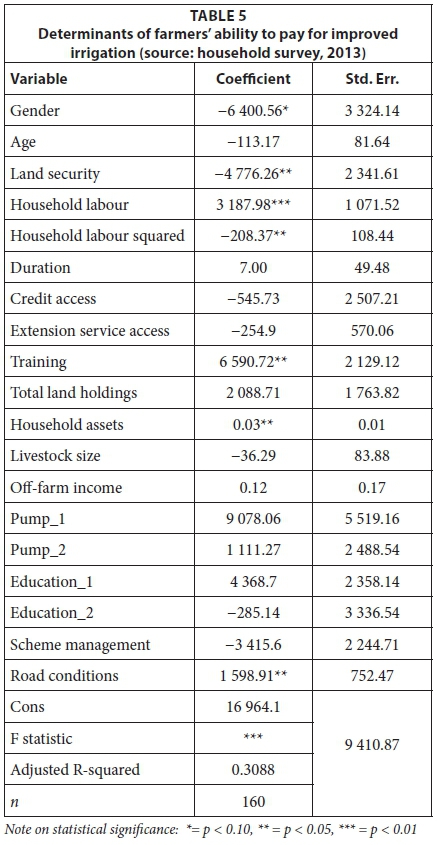
Among the explanatory variables included in the analysis, 7 variables had a significant effect on respondents' ATP. Results from the estimated model reveal that gender, land security, household labour, household labour squared, training, household assets and road conditions significantly impact on farmers' ATP. The gender of the household head significantly affects the ATP (p < 0.1). The results indicate that if the household head is female, the ATP is R6 400.56 less than that of male-headed households, ceteris paribus.
The parameter estimate for land security is negative and significant (p < 0.05). This implies that the ATP for farmers who do not feel secure with their land is R4 776.26 less than that of those who feel secure, ceteris paribus.
The household labour coefficient estimate is positive and significant (p < 0.01). This implies that if the household labour increases by 1 person, the ATP will increase by R3 187.98, ceteris paribus. However, the relationship between labour and gross margin is not linear. The coefficient estimate for household labour squared is negative and significant (p < 0.05). As household labour increases, the household's ATP for improved irrigation initially increases but decreases at higher levels of household labour, ceteris paribus.
The coefficient estimate for training is positive and significant (p < 0.05). This implies that those farmers/household heads who have received some agriculture-related training have R6 590.72 more ATP for irrigation water compared to those who have not received any form of training, ceteris paribus. This was expected as training can equip farmers with the information that can help them to increase productivity, which increases their ATP.
Accordingly, the parameter estimate for household assets is positive and significant (p < 0.1). This implies that an increase in the household assets will result in an increase in the household's ATP for the improved irrigation, ceteris paribus. Household assets are a sign of wealth such that families with high-value assets are expected to have invested in more capital and even production technologies, which would allow them to produce more, realize higher gross margins and, consequently, be able to pay more for improved irrigation. Household assets in the present study include houses, cars, water tanks, motor cycles, etc., which were all valued and added together to get their total value at household level.
According to the model, farmers' perceptions of the road conditions impact on their ATP for improved irrigation. The parameter estimate for road conditions is positive and significant (p < 0.05). That is, if farmers perceive the road conditions to be good, their ATP for irrigation water will be R1 598.91 more than that of their counterparts. Good road conditions imply easier access to markets. If farmers have better access to markets, they are able to sell their produce with ease and realize higher gross margins, which in turn leads to increased ATP for water.
DISCUSSION
The findings that male-headed households earn higher gross margins in this study suggests that such households generally have better access to resources which is expected to lead to increased profits and therefore higher ATP. These findings are in line with those of Quisumbing (1996) and Udry et al. (1995), who found that in Sub-Saharan Africa, women are less educated and have limited access to labour, fertilizers and other inputs. That is, women have to 'learn by doing' as most of them are illiterate and often learn agricultural practices that are passed from one generation to another. This differs from males who have higher literacy rates and access to resources, and therefore can achieve higher productivity and gross margins. Kyomugisha (2009) also found similar results where security of land tenure is one of the factors that influence investment to enhance land productivity and gross margins. Farmers who have secure land tenure are more likely to invest in improved production practices than their counterparts. Farmers who do have not security of land tenure may not invest much to keep the land productive, e.g., adopting practices like crop rotation, as they may be trying to maximize extraction, in the process reducing the quality of the soil and its productivity. Kyomugisha (2009) concludes that secure land tenure impacts positively on the level of investment made towards production, which increases productivity and gross margins, and the farmers ATP for water.
The initial increase in ATP, which is followed by a decrease as labour increases, can be explained from a productivity perspective. Given the small farm sizes under irrigation, initial increases in labour lead to higher productivity. However, eventually further increases result in reduced productivity and, by extrapolation, a decline in ATP.
There are a number of organizations training farmers; these are from the government, non-government organizations and the private sector. The government is the major player in providing training through its various agricultural development programmes (Kinambuga, 2010). The government also collaborates with non-governmental organizations to train farmers. Nevertheless, the proportion of farmers who access training is very low and this has a bearing on their production abilities, and thus gross margins achieved and their ATP for irrigation water. Only 31% of the respondents had received training related to agriculture. Training is important as it gives farmers production information and technologies that can increase their productivity. Therefore, farmers with no training risk having low production due to lack of knowledge. The average asset base of the farmers in the study was R83 916.34. The expectation is that households with a higher value of assets also do better in their level of production and make good gross margins, thus should afford higher ATP for irrigation water. This is in agreement with Kinambuga (2010).
According to Arias et al. (2013), when market integration of producers is limited, interventions to reduce barriers to market participation will often have a greater payoff. One such intervention is improving market information systems, by improving feeder roads or reducing the fees that traders pay to transport products between markets. Therefore, farmers' perception of their roads is one way to determine their access to market (Arias et al., 2013). In the present study, farmers' perceptions have been used as a proxy for market access, and 81% of the respondents perceived their roads to be in good condition.
CONCLUSIONS
The main aim of this study was to determine the ability of farmers to pay for improved irrigation water supply in rural KZN's Msinga Local Municipality, and to determine factors that determine their ATP for improved irrigation. Results show that farmers are realizing positive gross margins from their plots, although some made negative gross margins due to harsh weather conditions, but in general positive gross margins are realized from the irrigation schemes. The study shows that support services such as training are pivotal in improving farmers' understanding of agricultural issues, influencing their cropping patterns, and thus their ATP for water. Furthermore, the study shows the importance of institutions, particularly security of land tenure, that also influence the ability of farmers to pay for irrigation water. The study recommends increased farmer training to expose farmers to agricultural knowledge. The study further concludes that, given the gross margins of the farmers, overall the farmers have the ATP for improved irrigation. Government policies to ensure sustainability of smallholder irrigation schemes should recognize the opportunity to recoup running costs directly from farmers.
REFERENCES
ADEPOJU AA and OMONONA BT (2009) Determinants of willingness to pay for improved water supply in Osogbo Metropolis, Osun State, Nigeria. Res. J. Soc. Sci. 4 1-6. [ Links ]
AKTER S (2006) Farmers' willingness to pay for irrigation water under government managed small scale irrigation projects in Bangladesh. J. Bangladesh Stud. 9 21-31. [ Links ]
ALEBEL B (2002) Analysis of affordability and willingness to pay for improved water service in urban areas, strategy for cost recovery. MSc Thesis, School of Graduate Studies of Addis Ababa University, Addis Ababa. [ Links ]
ALHASSAN M (2012) Estimating farmers' willingness to pay for improved irrigation: an economic study of the Bontanga irrigation scheme in Northern Ghana. MSc thesis, Department of Agricultural and Resource Economics, Colorado State University, Fort Collins, Colorado. [ Links ]
ARIAS P, HALLAM D, KRIVONOS E and MORRISON J (2013) Smallholder integration in changing food markets. Food and Agriculture Organization of the United Nations, Rome. [ Links ]
BACHA D, NAMARA R, BOGALE A and TESFAYE A (2011) Impact of small-scale irrigation on household poverty: Empirical evidence from the Ambo District in Ethiopia. Irrig. Drain. 60 1-10. https://doi.org/10.1002/ird.550 [ Links ]
BOGALE A and URGESSA B (2012) Households' willingness to pay for improved rural water service provision: application of contingent valuation method in Eastern Ethiopia. J. Hum. Ecol. 38 (2) 145-154. [ Links ]
COUSINS B (2012) Smallholder irrigation schemes, agrarian reform and 'accumulation from below': Evidence from Tugela Ferry, KwaZulu-Natal. Paper presented at Strategies to overcome poverty and inequality: Towards Carnegie III, 3-7 September 2012, University of Cape Town, South Africa. [ Links ]
DAEA (Department of Agriculture and Environmental Affairs, KwaZulu-Natal Province) (2011) Mooi River Irrigation Scheme topographic survey, southern region. DAEA, Hilton. [ Links ]
DEARLOVE PD (2007) Msinga Municipality Integrated Development Plan 2005/2006. KwaZulu-Natal Department of Local Governance and Traditional Affairs. URL: http://devplan.kzntl.gov.za/idp_reviewed_2007_8/IDPS/KZ244/Adopted/Msinga %20IDP.pdf (Accessed 27 March 2014). [ Links ]
DENISON J and MANONA S (2007) Principles, approaches and guidelines for the participatory revitalization of smallholder irrigation schemes. Volume 1: A rough guide for irrigation development practitioners. WRC Report No. TT 309/07. Water Research Commission, Pretoria. [ Links ]
DAFF (Department of Agriculture, Forestry and Fisheries, South Africa) (2012) Revitalization of irrigation schemes. URL: http://www.nda.agric.za (Accessed 1 July 2015). [ Links ]
DWAF (Department of Water Affairs and Forestry, South Africa) (2004) National Water Resource Strategy. (DWAF). URL: http://www.dwaf.gov.za/Documents/Policies/NWRS/Default.htm (Accessed 26 April 2014). Department of Water Affairs and Forestry, Pretoria. [ Links ]
FANADZO M (2012) Revitalisation of smallholder irrigation schemes for poverty alleviation and household food security in South Africa: A review. Afr. J. Agric. Res. 7 (13) 1956-1969. https://doi.org/10.5897/ajarx11.051 [ Links ]
FUJITA Y, FUJII A, FURUKAWA S and OGAWA T (2005) Estimation of willingness to pay (WTP) for water and sanitation services through contingent valuation method (CVM): A case study in Iquitos City, The Republic of Peru. JBICI Rev. 11 59-87. [ Links ]
GOMO T (2012) Water management in communally managed smallholder irrigation schemes: Technical performance of Mooi River Irrigation Scheme. MSc thesis, School of Engineering, University of KwaZulu-Natal, Pietermaritzburg, South Africa. [ Links ]
HELLEGERS PJ and PERRY CJ (2006) Can irrigation water use be guided by market forces? Theory and Practice. Int. J. Water Resour. Dev. 22 79-86. https://doi.org/10.1080/07900620500405643 [ Links ]
KANYOKA P, FAROLFI S and MORARDET S (2008) Households' preferences and willingness to pay for multiple use water services in rural areas of South Africa: An analysis based on choice modelling. Water SA 34 (6) 715-723. [ Links ]
KINAMBUGA D (2010) Evaluation of the constraints to profitable smallholder dairying: a case of Nakuru County, Kenya. MSc thesis, Egerton University, Kenya. [ Links ]
KYOMUGISHA E (2009) Land tenure and agricultural productivity in Uganda. Uganda strategy support program (USSP). Brief No. 5. IFPRI, Kampala. [ Links ]
LANGE GM and HASSAN R (2007) Methodologies for valuation of water services. In: Lange GM and Hassan R (eds) The Economics of Water Management in Southern Africa: An Environmental Accounting Approach. Edward Elgar Publishing, Cheltenham. 203-236. [ Links ]
MNKENI P, CHIDUZA C, MODI A, STEVENS J, MONDE N, VAN DER STOEP I and DLADLA R (2010) Best management practices for smallholder farming on two irrigation schemes in the Eastern Cape and KwaZulu-Natal through participatory adaptive research. WRC Report No. TT 478/10. Water Research Commission, Pretoria. [ Links ]
MOFFAT B, MOTLALENG G and THUKUZA A (2011) Households' willingness to pay for improved water quality and reliability of supply in Chobe ward, Maun. Botswana J. Econ. 8 (12) 45-61. [ Links ]
NDETEWIO P, MWAKANJE A, MUJWAHUZI M and NGANA J (2013) Factors influencing willingness to pay for watershed services in lower Moshi, Pangani Basin, Tanzania. Int. J. Agric. Environ. 02 57-75. [ Links ]
PERRET S and GEYSER M (2007) The full financial costs of irrigation services: a discussion on existing guidelines and implications for smallholder irrigation in South Africa. Water SA 33 (1) 67-78. [ Links ]
QUISUMBING A (1996) Male-female differences in agricultural productivity: methodological issues and empirical evidence. World Dev. 24 (10) 1579-1595. https://doi.org/10.1016/0305-750X(96)00059-9 [ Links ]
SINYOLO S, MUDHARA M and WALE E (2014) The impact of smallholder irrigation on household welfare: The case of Tugela Ferry irrigation scheme in KwaZulu-Natal, South Africa. Water SA 40 (1) 145-156. https://doi.org/10.4314/wsa.v40i1.18 [ Links ]
SINYOLO S (2013) The impact of smallholder irrigation and water security on household welfare: The case of Tugela Ferry irrigation scheme in KwaZulu-Natal, South Africa. MSc thesis, School of Agriculture, Earth and Environmental Sciences, University of KwaZulu-Natal, Pietermaritzburg, South Africa. [ Links ]
SPEELMAN S (2009) Water use efficiency and influence of management policies, analysis for the small-scale irrigation sector in South Africa. PhD thesis, Ghent University, Belgium. [ Links ]
UDRY C, HODDINOTT J, ALDERMAN H and HADDAD L (1995) Gender differentials in farm productivity: implications for household efficiency and agricultural policy. Food Policy 20 (5) 407-423. https://doi.org/10.1016/0306-9192(95)00035-D [ Links ]
VAN AVERBEKE W (2008) Best management practices for small-scale subsistence farming on selected irrigation schemes and surrounding areas through participatory adaptive research in Limpopo Province. Draft Final Report of WRC Project K5/1464//4. Centre for Organic and Smallholder Agriculture (COSA), Department of Crop Sciences, Tshwane University of Technology, Pretoria. [ Links ]
VAN AVERBEKE W and KHOSA TB (2011) Smallholder irrigation schemes in South Africa with a focus on Dzindzi Canal Irrigation Scheme in Limpopo: dynamic smallholders amidst contested policy priorities. In Aliber M (ed.) Strategies to support South African smallholders as a contribution to government's second economy strategy. Vol. 2: Case studies. Institute for Poverty, Land and Agrarian Studies, School of Government, University of the Western Cape, Cape Town. 145-162. [ Links ]
VAN AVERBEKE W, DENISON J and MNKENI PNS (2011) Smallholder irrigation schemes in South Africa: A review of knowledge generated by the Water Research Commission. Water SA 37 (5) 797-808. https://doi.org/10.4314/wsa.v37i5.17 [ Links ]
YOKWE SCB (2006) Investigation of the economics of water as used by smallholder irrigation farmers in South Africa. MSc thesis, Faculty of Natural and Agricultural Sciences, Department of Agricultural Economics, Extension and rural development, University of Pretoria, Pretoria. [ Links ]
YOUNG RA (1996) Measuring economic benefits for water investments and policies. World Bank Technical Paper No. 338. The World Bank, Washington, D.C. [ Links ]
Received 17 November 2014
Accepted in revised form 28 February 2017
* To whom all correspondence should be addressed. Tel: +27 (33) 260-5518; e-mail: Mudhara@ukzn.ac.za

