


Servicios Personalizados
Articulo
 Inglés (pdf)
 Articulo en XML
 Referencias del artículo
Indicadores

Links relacionados
-
 Citado por Google
 -
 Similares en Google
Compartir

 Permalink
Water SA
versión On-line ISSN 1816-7950
versión impresa ISSN 0378-4738
Water SA vol.43 no.1 Pretoria ene. 2017
http://dx.doi.org/10.4314/wsa.v43i1.16
Effects of land use change on streamflow and stream water quality of a coastal catchment
CR PetersenI, II, *; NZ JovanovicI; DC Le MaitreI; MC GrenfellII
ICSIR, Natural Resources and the Environment, PO Box 320, Stellenbosch, 7599, South Africa
IIInstitute for Water Studies, Department of Earth Science, University of the Western Cape, Private Bag X17, Bellville, 7535, South Africa
ABSTRACT
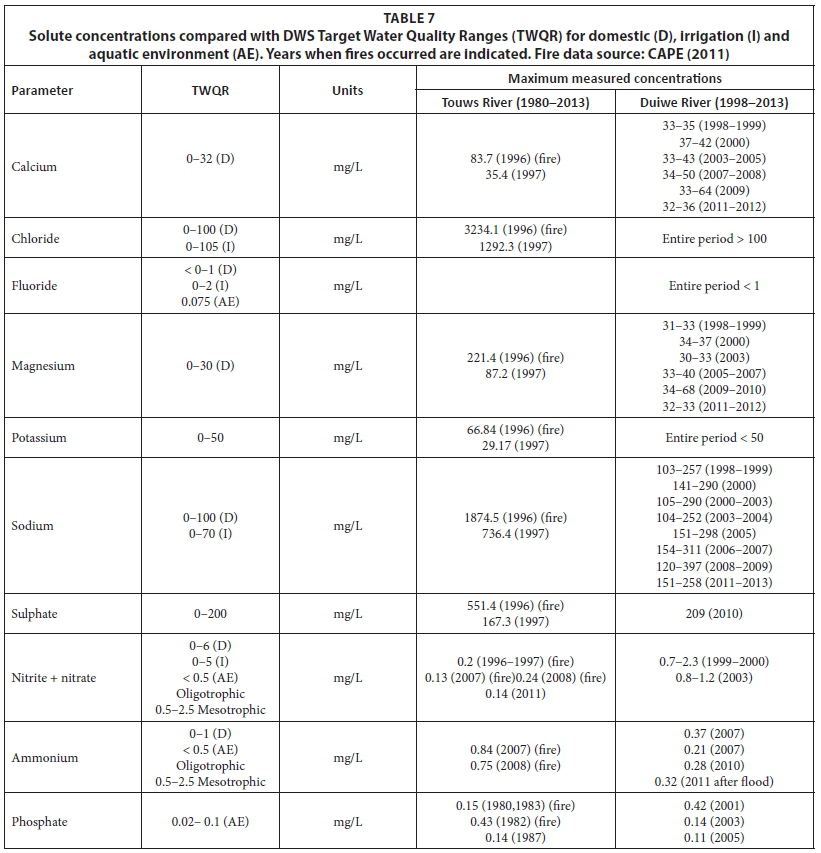
This study aimed to link land cover/use change to water quality in an important water supply coastal catchment. The approach followed a spatial and temporal analysis of historical catchment land use change to assess how changes influenced water quality and river flow in the Touws and Duiwe Rivers, southwestern Cape, South Africa. Each sub-catchment has unique characteristics which influence land use and water quality and the purpose was to analyse each one separately. Historical water quality and flow analysis were based on the records available (Duiwe River: 1998-2013; Touws River: 1980-2013) together with rainfall data. Records were analysed to detect trends over time, which were linked to changes in land use activities. Agriculture intensified rapidly in the Duiwe River catchment with most arable land cultivated by 1960 and water storage as farm dams escalating. Concentrations of nutrients and electrical conductivity were higher in the Duiwe River than in the more natural Touws River, and were positively correlated to river flows. Mean values for total nitrogen and electrical conductivity were 0.03 mg/L and 16.7 mg/L, respectively, in the Touws River and 0.25 mg/L and 127 mg/L, respectively, in the Duiwe River. Nutrient concentrations decreased in the Duiwe River after 2006 as fertilizer applications to pastures were reduced. The South African Target Water Quality Ranges were exceeded at times and in the Touws catchment this appears to have been due to extensive fires. For instance, sodium concentrations reached a maximum of 1 874.5 mg/L in 1996 compared to a usual average concentration of 20.8 mg/L where the guidelines are between 0 and100 mg/L. The link between land cover/use and water quality was demonstrated and when spatial heterogeneity of the catchments was altered by human or natural events, this was reflected in changes in the water quality.
Keywords: land cover, spatial analysis, sub-catchment scale
INTRODUCTION
Water is a limited resource and water quality deterioration is a major threat to water resources in Southern Africa, given the prevalence of natural climatically-driven water scarcity. National-scale assessments of water resources showed that freshwater and estuarine ecosystems are highly threatened by intense land use pressures escalating from river source to sea (Nel et al., 2011). Moreover the cumulative impacts from freshwater systems are received by coastal ecosystems and the effects of land cover change can negatively impact productivity, biodiversity and ecological functioning of these ecosystems (Lemley et al., 2014). As coastal ecosystems are often of economic and ecological significance to a country estuarine management can no longer be limited to the coastline (Barbier et al., 2011). Managers are realising that their strategies need to extend further inland to include the impacts on water quality and flow in rivers feeding these systems (Lemley et al., 2014).
An understanding of the influence of land use and management within a catchment is required to assess the impact of non-point source pollution on water quality. This, in turn, is related to spatial and temporal scales and catchment heterogeneity (Ding et al., 2015). Much of what we observe in present-day landscapes and their associated ecosystems is a product of the past. Therefore it is critical to study past events when trying to holistically interpret the present. One way of interpreting the response of rivers to land-use change is by historical analysis (Spink et al., 2010). Aerial photography provides important insights into the history of landscape development and river responses. For example, Parsons and Gilvear (2002) illustrated the re-establishment of nature conservation corridors as landforms evolved with changes in river management. Hoffman and Rohde (2007) used repeat landscape photography to illustrate the environmental history of an area. As land cover/use and rivers are intimately linked the opportunity is provided to assess how changes to this can impact rivers and their water quality, whether quality is determined by factors such as climate, landscape and geology or whether land use and management play a role (Mehdi et al., 2015).
Hydrological processes such as evapotranspiration, interception, infiltration and percolation may change due to modifications of land cover type which can alter the water balance of a catchment (Nosetto et al., 2012). The management of land use activities can play a role, e.g., altering river channels or changing the imperviousness of a surface (Brummer et al., 2016) so surface water discharge increases or decreases (Royall, 2013) altering the flow in rivers and groundwater and affecting the physical, chemical and biological processes in the receiving water bodies (Tong and Chen, 2002).
Studying the past allows us to place recent and ongoing changes to water quality into perspective, and to adopt a proactive rather than reactive approach to river and land management so that adaptive management can be implemented (Spink et al., 2010). Although there have been several studies elsewhere (e.g. Lerodiaconou et al., 2005); Hardison et al., 2009; Yu et al. (2013), there have been few studies of African coastal catchments. This is especially true where the rivers are an important water supply source for the human population, economically and for the provision of ecosystem goods and services, such as along the Southern Cape coast.
This study focuses on land cover/use and how it has changed on a sub-catchment scale and within a buffer zone (including the riparian and adjacent area) of two mainstem rivers, the Touws and Duiwe, thereby influencing water quality and flows, in an important water supply coastal catchment. Each of the sub-catchments studied has unique characteristics which influence water quality and the purpose was to analyse each one separately. The questions addressed were: (i) how has land cover/use changed over time and (ii) how has the land use (directly and indirectly) influenced water quality and flows in the past and present.
STUDY AREA
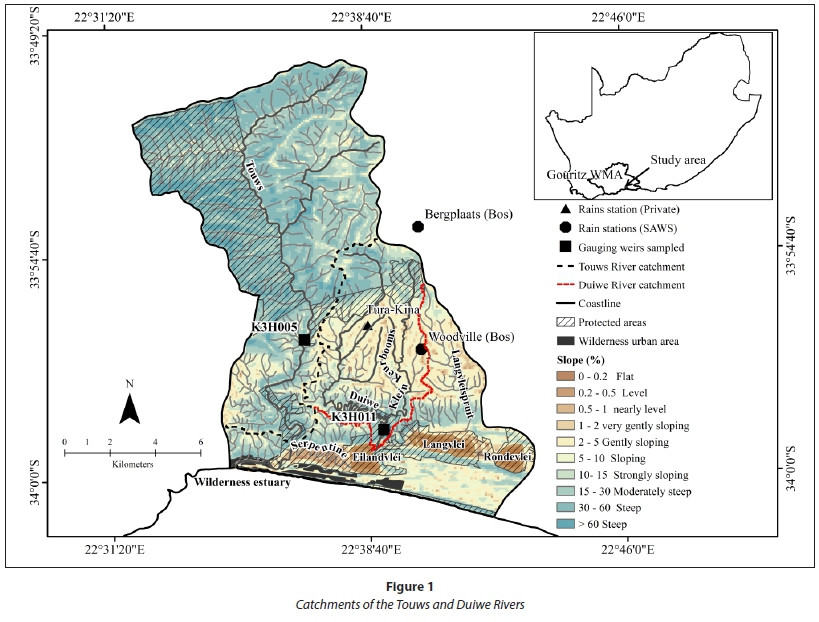
The study area is located on the southern coast of South Africa in the Gouritz Water Management Area (WMA) (Fig. 1). The two main coastal sub-catchments, of the Touws (95.81 km2) and Duiwe (33.82 km2) Rivers (Table 1), are located in quaternary catchment K30D. The Touws River feeds an estuary, and the Wilderness Lakes are fed by the Duiwe and Langvleispruit Rivers with a channel connecting the lake system to the same estuary. The area is ecologically sensitive and has a rich biodiversity with vegetation biomes forming part of the Cape Floral Kingdom (Pauw, 2009) which include the Wilderness Lakes system, a Ramsar site protected in the Garden Route National Park (Russell, 2013).
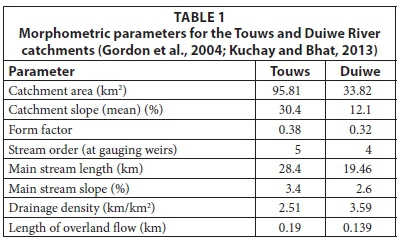
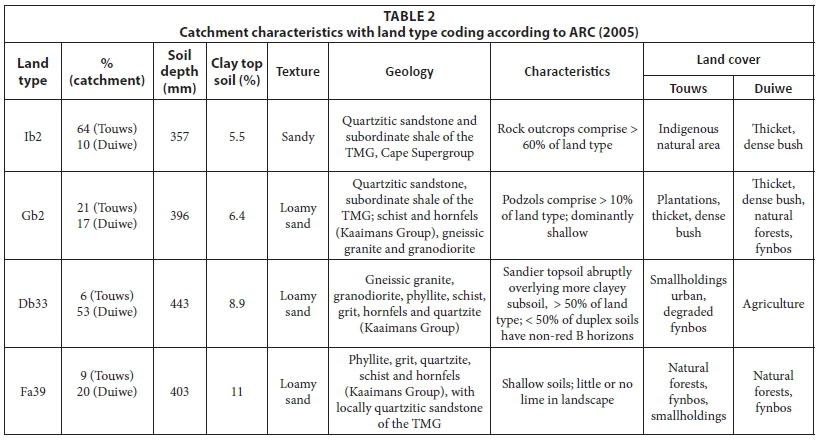
Rainfall occurs throughout the year with little seasonal variation, the wettest period being from September to March and the driest being April-August. In the mountain catchments the rainfall ranges from 900 to 1 400 mm/a (Schultze, 1997). Summer temperatures range from 22-25°C and winters from 18-21°C. Berg winds can raise the temperatures to 30°C, mainly in spring, and are important for determining the fire patterns in the fynbos vegetation and, therefore, the distribution of natural vegetation in both forests and fynbos over the landscape (Van Wilgen et al., 2010). Fynbos, the natural shrubland vegetation, has a high degree of species richness and endemism and has been descibed by Mucina and Rutherford (2006). Cathment characteristics are described in Tables 1 and 2.
METHODS
Mapping
To gain an understanding of land cover change and use over time and space, aerial photographs were mapped from 1980 to 2013. The historical analysis provided an initial context for water quality comparison in each catchment since water quality response to the historical pattern of land use change and catchment impacts can be immediate or have a lag effect. Digital, orthorectified aerial photographs for 2006, 2010 and 2013 were available. The earliest photographs were orthorectified to a common scale and mosaiced using a digital elevation model as a base layer for topographical data. The same area was assessed and digitised on-screen using ArcMap 10.2 (ESRI) and the resulting maps were overlain to observe changes in land cover to give a total estimate of the amount of change for the mapped categories. The mapping boundaries used were sub-catchments delineated by Maherry et al. (2013). The percentage for each land cover category was calculated for the sub-catchment and a buffer zone along each bank of the rivers. A buffer zone of approximately 100 m was used based on the lowest resolution of the digital data and catchment topography.
Surface water quality, rainfall and flow data
Historical water quality and flow data were used to determine how changing land cover impacted water quality data obtained from the Department of Water and Sanitation (DWS, 2015a, b). There were two gauging stations where the river water quality has been sampled on a monthly basis. Daily and monthly flow data were also available. Water quality and flow data for the period 1980-2013 were available for the Touws River (K3H005) and for 1998-2013 for the Duiwe River (K3H011) (Fig. 1).
Variables used were: electrical conductivity (EC), pH, total alkalinity and the dissolved inorganic ions measured: potassium (K+), sodium (Na+), calcium (Ca2+), magnesium (Mg2+), chloride (Cl-), sulphate (SO42-), fluoride (F-), silica (Si), as well as the nutrients phosphate (PO4-P) as phosphorus, nitrate (NO3--N) and nitrite (NO2--N) (NOx) and ammonium (NH4+-N) as nitrogen. Analysis was conducted by the DWS laboratories according to the methods outlined in DWA (2009). Statistical analysis was applied to water quality and flow data, including the non-parametric Spearmans rank correlation (rs) test and the seasonal Mann-Kendall trend test in XLSTAT (2015 Addinsoft). All analyses were considered statistically significant at α < 0.05.
Daily rainfall data were obtained from the South African Weather Service (SAWS) database for 2 rainfall stations and a third was obtained from a private landowner. Rainfall and streamflow data were analysed to detect trends as well as to clarify wet and dry years and used to determine if there were any links to water quality. A hydrological year was classified as dry (25th percentile or less), wet (75th percentile or greater) or normal (between the 25th and 75th percentiles) (Du Toit and O'Connor, 2014). The simple daily intensity index, which is the annual total precipitation divided by the number of rainy days (precipitation > 1 mm) in the year, was calculated in RClimDex for all stations (Zhang and Yang, 2004).
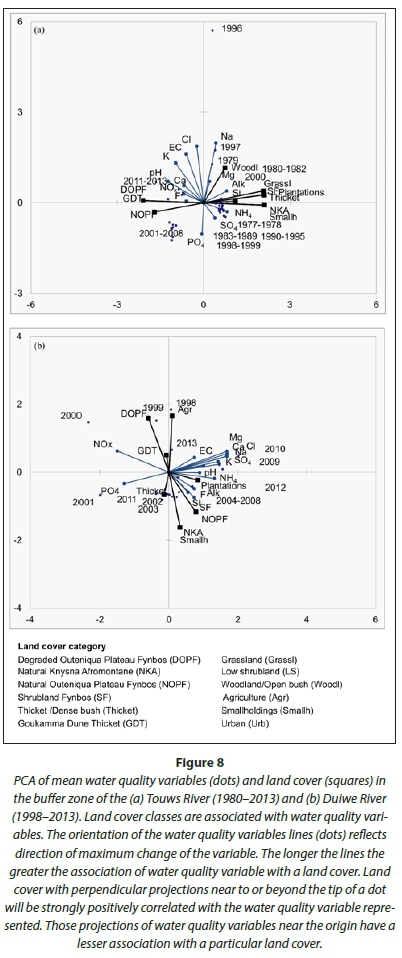
To determine if there were any significant correlations (spatially) between water chemistry and land cover, principal component analysis (PCA) was performed using XLSTAT (2015 Addinsoft) so that the influence of land cover data on water chemistry within the buffer area could be examined. The buffer was examined as the sub-catchment heterogeneity may mask any signal from land cover/use impact and the impacts may be more pronounced from the area closest to the rivers. Spearman rank correlation was used and results were considered statistically significant at α = 0.05.
RESULTS
Mapping
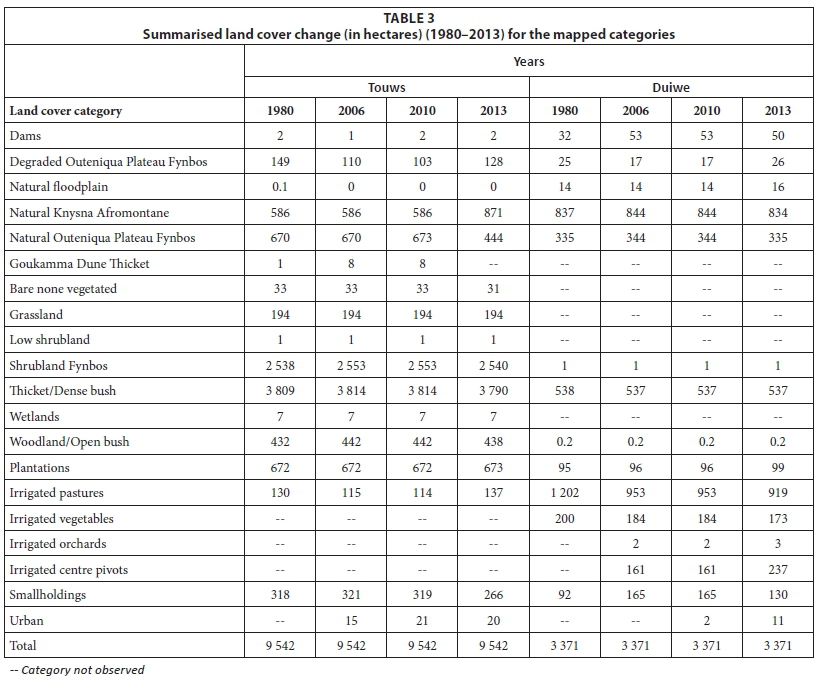
The Touws River catchment remained largely intact in its upper catchment throughout the period examined (Fig. 2a, Table 3), as the natural forest areas were formally protected from the late 1800s onward. Exotic pine plantations cover 673 ha in this catchment. The most change occurred in the lower Touws River catchment on the coastal plateau and coastal plain areas with the establishment of irrigated pastures and smallholdings. Smallholdings reached 318 ha by 1980 but decreased by 2.78% to 266 ha by 2013. Irrigated pastures increased from 130 ha (1.36%) in 1980 to 137 ha (1.43%) in 2013. Some small earth farm dams (2 ha) became established with the increase in agriculture but the percentage remained small (0.02%). Degradation and/or clearing of the natural Outeniqua Plateau fynbos occurred to make way for smallholdings and pastures, shown by the decrease in area from 1980-2013.
The Outeniqua Plateau fynbos occurred along a portion of the lower Duiwe River catchment (Fig. 2b) and intact pockets remained between agricultural and indigenous forest areas. Much of the coastal plateau landscape was dominated by agricultural areas with 1 202 ha (36%) covered by irrigated pastures in 1980 and 200 ha (6%) covered by vegetable farming.
As agriculture intensified, more water was required to support agricultural activities so the number of farm dams increased, from 32 ha to 53 ha (0.9% to 1.6%), by 2006. The increase in farming prompted an increase in human settlement, which equated to an increase in the establishment of smallholdings, from 3% in 1980 to 4% in 2013. The Knysna Afromontane forests increased in the Touws by 2013 and remained approximately the same in the Duiwe catchment. However, some of this increase in the Touws catchment was also due to invasions by exotic Black Wattle.
A substantial shift in agriculture occurred after 1980 with the introduction of centre pivot irrigation systems. By 2010 the amount of area under centre pivots had increased (5% to 7%) but there was little change in the agricultural areas. In the Touws catchment, the Outeniqua Plateau fynbos made way for a formal low-cost housing project, Touwsranten, which was initiated in 1996. The housing project expanded to reach its current extent (from 15 ha in 2006 to 31 ha in 2013) mainly occurring in the Touws River catchment.
Surface water quality, flows and rainfall
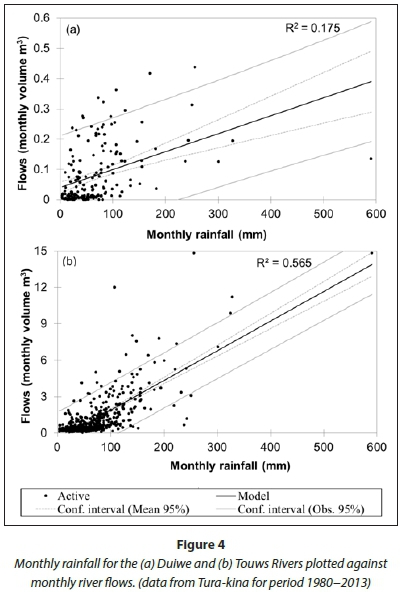
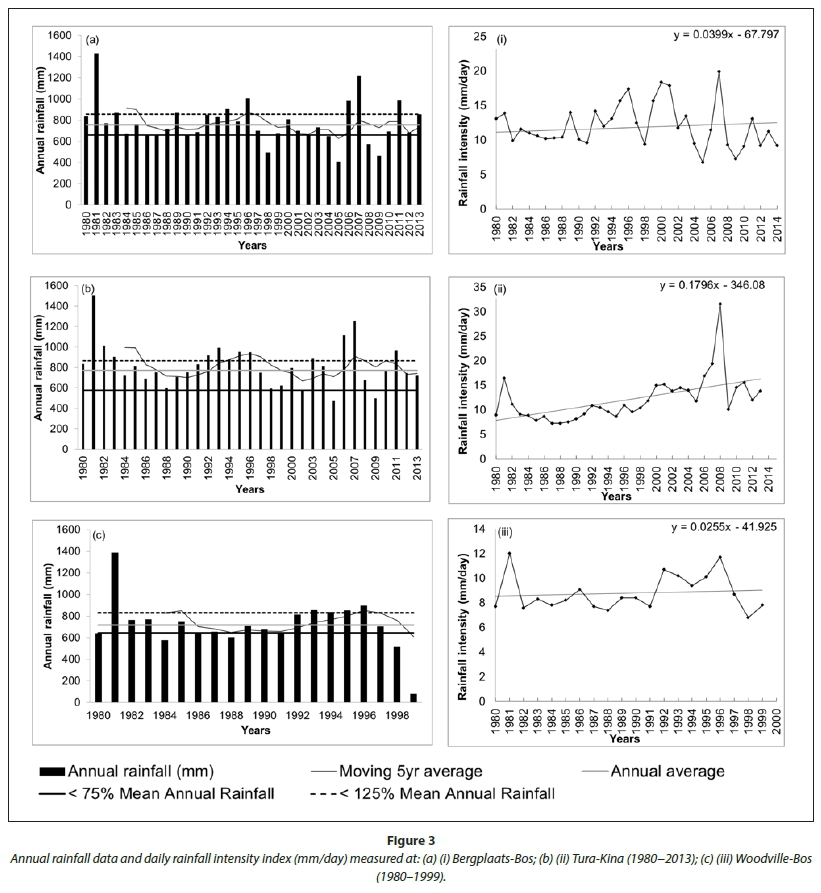
The rain stations showed the same trends with very wet and very dry periods occurring in the same years, which were linked to the occurrences of floods and droughts (Table 4). The coefficient of variation between the rain stations was very similar and analysis of the number of rainy days showed a decreasing trend for all stations, but the rain intensity at each station overall showed an increasing trend (Fig. 3). The daily flow data for the Duiwe River indicated that periods of zero flows often occur. Overall flow records for the Duiwe River showed a decreasing trend (Tau = -0.095; p = < 0.0001) while the trend increased in the Touws River (Tau = 0.079; p = < 0.0001). Rainfall showed a better correlation to the flow data in the Touws River (R2 = .565) than in the Duiwe (R2 = 0.175), but in both catchments river flows increased when rainfall increased (Fig. 4) so that both were responsive during particularly wet years (Table 4). However, the rainfall effects on the river discharge in the Duiwe River are reduced due to increased anthropogenic activities in the catchment related to dams and run-of-river abstractions. The location of the rain station that was used was also further upstream in the catchment compared to where flows were recorded in the Duiwe River.
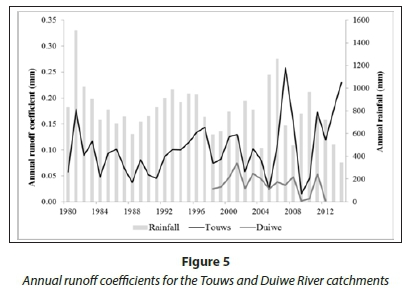
The annual runoff coefficients showed high variability throughout the years but generally increased for the Touws River and decreased for the Duiwe River (Fig. 5).
By the time flow and water quality monitoring commenced (1998) in the Duiwe catchment, agriculture was well established with grass pastures dominating the land cover. No pre-development runoff data are available for these catchments, so a dataset of mean annual runoff, which was estimated from mean annual rainfall using regional rainfall-runoff relationships developed for water resource studies (see Scott et al., 1998a, and updated by Nel et al., 2013) was used to estimate the pre-development mean annual runoff for each study catchment (Table 5). The Touws River accounted for more than half the runoff volume. The gauged mean annual runoff (MAR) from the Touws catchment is approximately 14.1 million m3, which was based on the flow record for 1980-2013 from DWS, which was relatively close to the estimated pre-development mean annual runoff. For runoff from the Duiwe catchment it was only 0.96 million m3 per year compared with an estimated 6.6 million m3 per year prior to development.

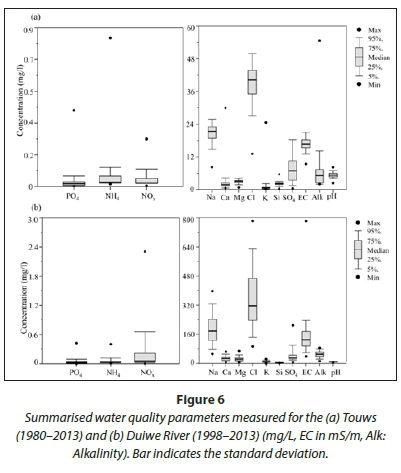
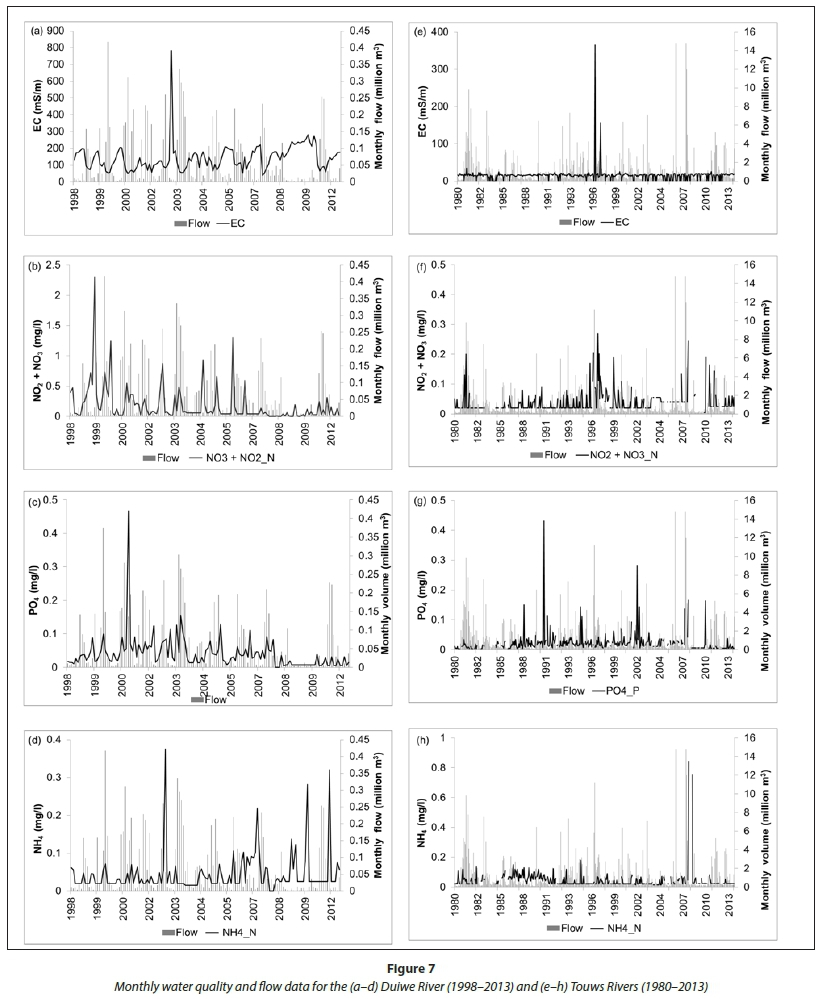
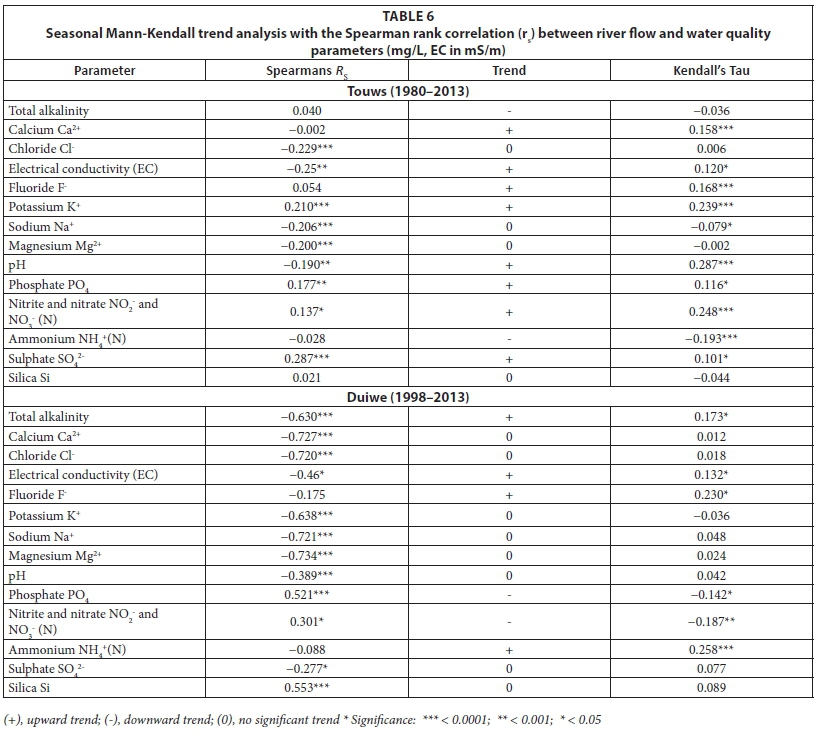
Water chemistry of the Touws River can be characterised as acidic (mean pH: 4.3) and low in dissolved substances, shown by EC concentrations with a mean of 17 mS/m (Fig. 6). The Duiwe River is more alkaline (mean pH: 7.5) and had a mean EC concentration of 134 mS/m. In the Duiwe River EC followed the trends of the rainfall and flows (Fig. 7) recorded in the catchment, resulting in a negative correlation with river flows (rs= -0.46, p < 0.05) (Table 6).
The NOx concentrations in the Duiwe River showed increased levels during or just after flood events, which were especially evident during 1999-2000 (0.87 to 2.3 mg/L) and 2003-2006 (0.59 to 1.29 mg/L). Runoff also increased during these years. The NOx concentration showed a decreasing trend over time (Tau = -0.187) (Table 6). Ammonium (NH4+) levels spiked after increased river flows, with an increasing trend in concentrations especially after 2007. The PO4 concentrations were strongly positively correlated to flows (rs= 0.521) with a significant decreasing trend evident (Tau = -0.142; p = < 0.05). In the Duiwe PO4 levels were below 0.15 mg/L during the recorded period, with the exception of 2001 to 2003 and 2005, which coincided with increased river flows (Fig. 7).
All major ions were significantly negatively correlated with river flows (i.e. as river flow increases, variable concentration decreases) (Table 6). Drought periods also showed increases in solutes illustrated by EC concentrations in Fig. 7. The NOx, PO4 and Si were the exception as concentrations increased with river inflows and were positively correlated to flows.
In the Touws River EC concentrations were negatively correlated to flows (rs = -0.25, p = 0.001). Small increases coincided with very low river flow years (monthly flows of 0-0.5 million m3) and exceptions to this occurred during the period 1996-1997 when the highest level reached was 365 mS/m. Increased levels of NOx occurred during increased river flows (rs = 0.137) and were lower than those recorded in the Duiwe River. The NH4+ levels showed a decreasing trend but increases in concentrations occurred following high rainfall, especially after 2007 when levels were the highest on record (0.84 mg/L). Table 7 shows the periods in the Touws and Duiwe Rivers when concentrations were increased and exceeded the Target Water Quality Range (TWQR) thresholds. Most solutes were negatively correlated to river flow with periods when concentrations for all solutes were above the TWQR thresholds. In most cases, with the exception of NOx the Touws concentrations also exceeded those recorded in the Duiwe River.
Links between land cover and surface water quality
In the buffer zone (riparian and adjacent land) for the Touws catchment (Fig. 8a), degraded Outeniqua plateau fynbos and Goukamma dune thicket showed a positive correlation to K+ and pH. Plantations were positively correlated to Si and alkalinity while Knysna Afromontane forests and smallholdings were closely associated to NH4+ Si and alkalinity. Grasslands were positively correlated to Na+, Si and alkalinity. Shrubland fynbos, thicket and dense bush showed a positive correlation to Si and alkalinity and woodland to Na+. In the Duiwe buffer shrubland fynbos was positively correlated to NH4+ and F- (Fig. b). Natural Outeniqua fynbos showed a negative correlation to NOx. Degraded Outeniqua Plateau fynbos, which was invaded by Black Wattle, was positively correlated to NOx. Plantations were positively correlated to EC, Cl-, and SO42- whereas thicket and dense bush was closely associated with PO4.
DISCUSSION
The Duiwe catchment became anthropogenically influenced with agricultural pressures in terms of dairy and vegetable farming, irrigation, abstraction changing flow volumes and fertilizer application altering water quality. Kapp et al. (1995) estimated that the mean annual pre-development runoff of 6.6 million m3 per year in the Duiwe River has been reduced by 48.5% due to agricultural abstractions whereas our estimate suggests a reduction closer to 80%. Farmers in the area made use of in-channel dams on the Duiwe River and tributaries on both the Touws and Duiwe Rivers. There is limited use of borehole water (DWAF, 2004) since the quartzitic sandstones of the TMG, such as in the Touws and upper Duiwe catchments, are highly fractured and faulted, limiting the storage of groundwater (Lin et l., 2014). The changing land use to pastures in the lower Duiwe catchment coupled with gentler slopes also decrease runoff (Singh et al., 2014). The rainfall data (Fig. 3) shows a downward trend in the number of rainy days but an increase in the rainfall intensity. Interviews with farmers by De Lange and Mahumani (2013) indicated that the average rainfall per year (790-800 mm) is insufficient for optimal production of pasture areas as an average of 1 000 mm per year is required (De Lange and Mahumani, 2013). Changes in rainfall patterns and associated evaporation rates (Hoffman et al., 2011) are directly influencing farming activities so that irrigation scheduling has changed and the amount of pasture presently being irrigated has been reduced (De Lange and Mahumani, 2013).
The changing land use in the Duiwe River catchment illustrated by the extensive mapped agricultural areas and changing irrigation systems (Fig. 2) reduced river flows, shown by the decreasing trend in flow data, which was at zero flow at times. This had a cumulative impact on water quality in the Duiwe River , which also negatively impacts the lake it feeds (Russell, 2013). The reductions in flows in the river significantly altered the balance of the flows into the lake system, whereby through flows in the lakes were reduced causing the Wilderness estuary, naturally a temporary open/closed system, to remain closed for longer periods. The biophysical and chemical properties of the lakes are therefore changing since water is retained without any significant level rise (Russell, 2013).
On average the nutrients NOx and PO4 were higher in the Duiwe River with mean concentrations of 0.24 mg/L and 0.04 mg/L, respectively. Both followed the trend of increasing with increasing flows with the highest concentrations for NOx recorded at 2.3 mg/L (1999) and 0.42 mg/L (2001) for PO4 after increased stream flows. This trend was also observed by Monaghan et al. (2007) where nitrogen accumulated in the top soil during the dry season and was transported with runoff to streams during the wet season. De Lange and Mahumani (2013) reported that farmers indicated increased bank erosion during high-intensity storms and floods, evidenced by siltation of their instream storage dams. Much of the Duiwe River catchment consist of sandy topsoil that overlays clayey subsoil (Table 1). Nitrogen in its soluble form (NO3-) is readily transported but can accumulate in soil, and phosphorus (PO4-3), with its affinity to mineral surfaces, will readily attach to soil particles, especially fines such as clay (Makarova et al., 2004). This can lead to a build-up in soils on land and in farm dams so that movement will depend on remobilisation of soils by erosion (Stanley and Doyle, 2002; Chattopadhyay et al., 2005). The pastures are covered with perennial grasses throughout the year reducing sediment loss, while vegetables (with fertilizers applied) are grown as row crops with limited or no vegetation stabilising sediment between them (De Lange and Mahumani, 2013). The increase in nutrients in both systems after high rainfall and flow events implies that the supply may be via runoff and erosion from the land and flushing from sediments trapped by dams in the catchment. The high density of farm dams in the Duiwe River was likely to have a cumulative impact in this regard as well as in reducing base flows, as also shown by Mantel et al. (2010).
After 2006 levels decreased, with mean concentrations for NO at 0.09 mg/L. Concentrations still spiked with increased flows but were considerably lower (Fig. 7). The decreasing trend observed in nutrients after 2006 was most likely due to reduced or more efficient use of the amounts of fertilisers applied by farmers, in an effort to contain costs. This was noted during interviews by De Lange and Mahumani (2013). Farmers use minimum tillage in the pasture management and wastewater produced by dairy farms containing cow manure is used from settling pans to spread directly onto pastures. This practice significantly reduced the nitrogen requirements for the pastures where application was reduced from 500 kg to 179 kg per hectare per application (De Lange and Mahumani, 2013).
PCA analysis showed that degraded Outeniqua Plateau fynbos and thicket and dense bush were associated with PO4 and shrubland fynbos was associated with NH4+, indicating that both alien and indigenous vegetation supply nutrients to the Duiwe River. Plantations were associated with EC, Cl-, and SO 2-concentrations, which have been shown to increase in rivers with clearfelling practices (Lesch, 1995). The land use change from natural to alien vegetation probably resulted in changes in the nutrient concentrations observed. Leguminous invasive species such as Acacias are efficient nitrogen fixers (Tye and Drake, 2012) and are known to contribute nitrogen via soil and groundwater due to leaching, adding to nutrient loads in the rivers, especially if these species are cleared. Jovanovic et al. (2009) found that NO was quickly released into groundwater after clearing Acacia saligna from plots, due to high residual nitrogen reserves in the rooting zone, decreased evapotranspiration due to plant removal and increased groundwater recharge. This may also explain the increases in NOx concentrations in the rivers related to clearing of vegetation, as farming areas or smallholdings were established during the expansion of agricultural practices in the area, or in later years (after 1995) with the initiation of the Working for Water Programme when invasive plants were cleared (Binns et al., 2001). Alien vegetation is known to impact water quality and quantity and has replaced a large percentage of natural vegetation in the Duiwe River catchment, with the river and tributaries invaded by A. mearnsii, A. melanoxylon and Eucalyptus species (GRI, 2008).
Much of the exotic vegetation in the Touws catchment is linked to afforestation (Le Maitre, 2000) with species such as Hakea and Pinus, as well as Acacia mearnsii, being introduced for the production of timber, fuelwood or tan-bark in the form of plantations. Pine plantations are known to reduce river flows in South Africa by using more water than indigenous vegetation (Scott et al., 1998b; Le Maitre et al., 2004) and Kapp et al. (1995) estimated that the mean annual pre-development runoff at 18 million m3 per year in the Touws catchment was reduced by approximately 21.7% due to pine plantations in the upper catchment. The results of DWS flow data showed an increasing trend in the Touws River catchment. When a percentage of the plantations were removed by one of the largest wildfires on record in 1996, no replanting occurred and the area was partly rehabilitated as part of the exit strategy of the MTO Forestry company, where land phased out is either used for conservation or agriculture (Pauw, 2009). The removal of this section of pine plantation, coupled with low storage capacity of the catchment, is likely responsible for the increasing trend.
The PCA analysis showed an association between smallholdings and NH4+ and Si. No large-scale farming practices occur on smallholdings but some do have livestock present, with subsistence farming of crops or tourism cottages offering accommodation located close to or on riverbanks and dams (WLSDF, 2015). These activities explain the increases in nutrient supply. Silica concentrations are linked to soil and bedrock from a catchment and these land uses are associated with clearing of vegetation, exposing soil to rainfall and runoff thereby increasing concentrations in rivers (Lesch, 1995). Average levels of NH4+ were around 0.03 mg/L, and although analysis showed a decreasing trend, levels spiked with flow increases. The highest concentrations were at 0.84 mg/L and 0.75 mg/L in 2008, which coincided with the expansion of the Touwsranten settlement. Wastewater discharge may reach the Touws River from this low-cost housing development, adding to increased NH4+ concentrations. The population has grown since 1996 to the extent that informal settlements developed on the fringe areas which are not connected to the waterborne sewage system (i.e. water being the transport medium for solid waste removal) (WLSDF, 2015). Table 7 shows that the period 1996-1997 had the highest concentrations of most solutes and nutrients in the Touws River. The wildfire that occurred during this period resulted in all solutes, except NOx exceeding the TWQR for domestic and irrigation use. The years in which fire occurred also coincided with periods of increased rainfall, which contributed to the increased solutes recorded. Other studies such as Smith et al. (2011) and Bergh and Compton (2015) also showed increased concentrations of nutrients in rivers after fires.
During 1996 rainfall above the 75th percentile (896 mm to 1007 mm) was recorded at all rain gauges. The concentrations of NOx and PO4 for the Touws River increased during wet years and more so during wet and fire years (Tables 4 and 7). Fire intensity in alien vegetation is greater than in fynbos due to a greater fuel load, causing water repellency of soils which promotes increased runoff (Le Maitre et al., 2004). PCA analysis in the Touws shows that plantations, grasslands, shrubland fynbos and thicket/dense bush were positively correlated to Si, Na+ and alkalinity. Natural Afromontane forests were positively correlated to NH4+. Large percentages of these vegetation types were removed with the fire, exposing soil to runoff. Lesch (1995) found that total phosphorus, total nitrogen and the same variables assessed in the current study increased in concentrations after fires, which included plantations and indigenous fynbos vegetation.
Increased runoff and reduced infiltration and soil water storage were also found by Scott (1997) and Scott et al. (1998b) in other areas of the southwestern Cape with similar land use and catchment characteristics to the Touws. Le Maitre et al. (2014) showed that simulation of clear-felling of pines and degrees of water repellency of soils after fires in invaded Acacia areas in a neighbouring catchment to the Touws River produced the same hydrological response. The increases in concentrations in the Touws River were short-lived and levels returned to a more constant state with natural variation within a few months. This was also observed in the study by Bergh and Compton (2015).
CONCLUSION
The study demonstrates the link between land cover/use and water quality and the role of temporal (historical data analysis) and spatial scales (buffer areas) in understanding the influence of land cover and management of land use activities on water quality. The databases used showed that when the spatial heterogeneity of the catchment was altered, either by human influences such as agriculture or by natural events such as fires, it was reflected in changes in the water quality and quantity available as stream flow. Changes in land management could have a substantial impact in water quality improvement, especially relevant where cost-efficient solutions to water quality impairment are a requirement. This could include more efficient use of fertilizers in agricultural land management by reducing quantities of fertilizer applied or maintaining and/or establishing riparian buffer areas to mitigate the impacts to streams from the land-based activities. Vegetation (indigenous or exotic) as riparian buffers can also influence water quality and a proper understanding of that role is necessary for effective land and water management.
ACKNOWLEDGEMENTS
The authors acknowledge financial support from the CSIR and the National Research Foundation (NRF). Thanks also to Dr Paul Oberholster and colleagues at the CSIR for valuable comments and to landowners in the Wilderness area for their support.
REFERENCES
ARC (2005) Land Type Survey Staff. 1972 - 2005. Land Types of South Africa: Digital map (1:250 000 scale) and soil inventory databases. ARC-Institute for Soil, Climate and Water, Pretoria. [ Links ]
BARBIER EB, HACKER SD, KENNEDY C, KOCH EW, STIER AC and SILLIMAN BR (2011) The value of estuarine and coastal ecosystem services. Ecol. Monogr. 81 (2) 169-193. https://doi.org/10.1890/10-1510.1 [ Links ]
BERGH EW and COMPTON JS (2015) A one-year post-fire record of macronutrient cycling in a mountain sandstone fynbos ecosystem, South Africa. S. Afr. J. Bot. 97 48-58. https://doi.org/10.1016/j.sajb.2014.11.010 [ Links ]
BINNS JA, ILLGNER PM and NEL EL (2001) Water shortage, deforestation and development: South Africa's Working for Water Programme. Land Degrad. Dev. 12 341-355. https://doi.org/10.1002/ldr.455 [ Links ]
BRUMMER TJ, BYROM AE, SULLIVAN JJ and HULME PE (2016) A quantitative framework to derive robust characterization of hydrological gradients. River Res. Appl. doi: 10.1002/rra.3001. https://doi.org/10.1002/rra.3001 [ Links ]
CAPE (2011) CapeNature fire management. URL: http://bgis.sanbi.org/cape/fire.asp (Accessed July 2015). [ Links ]
CHATTOPADHYAY S, RANI LA and SANGEETHA PV (2005) Water quality variations as linked to landuse pattern: a case study in Chalakudy river basin, Kerala. Curr. Sci. 89 (12) 2163-2189. [ Links ]
DE LANGE WJ and MAHUMANI BK (2013) Report on the agricultural economic significance of deteriorating water quality in the Hoekwil study area. CSIR/NRE/GES/IR/2013/0088/A. CSIR, Stellenbosch. [ Links ]
DING J, YUAN J, LAN F, QI L, QIUZHI P and MUYI K (2015) Impacts of land use on surface water quality in a subtropical river basin: A case study of the Dongjiang River Basin, Southeastern China. Water 7 (8) 4427-4445. https://doi.org/10.3390/w7084427 [ Links ]
DU TOIT JCO and O'CONNOR TG (2014) Changes in rainfall pattern in the eastern Karoo, South Africa, over the past 123 years. Water SA 40 (3) 453-460. https://doi.org/10.4314/wsa.v40i3.8 [ Links ]
DWA (Department of Water Affairs, South Africa) (2009) Resource Quality Services methods manual: Inorganic chemistry laboratory. Method 5001.5, 5001.7, and 5001.11. Department of Water Affairs, Pretoria. [ Links ]
DWAF (Department of Water Affairs and Forestry, South Africa) (2004) Gouritz Water Management Area: Internal Strategic Perspective. Prepared by Ninham Shand (Pty) Ltd in association with Jakoet and Associates and Umvoto Africa, on behalf of the Directorate: National Water Resource Planning. DWAF Report No P WMA16/000/00/0304. [ Links ]
DWS (Department of Water and Sanitation, South Africa) (2015a) Hydrological services - surface water (data, dams, floods and flows). URL: www.dwaf.gov.za/Hydrology/hymain.aspx (Accessed July 2015). [ Links ]
DWS (Department of Water and Sanitation, South Africa) (2015b) Resource Quality Services water quality monitoring sites grouped by water management area. URL: www.dwaf.gov.za/iwqs/wms/data/WMS_pri_txt.asp (Accessed July 2015). [ Links ]
GORDON ND, MCMAHON TA, FINLAYSON BL, GIPPEL CJ and NATHAN RJ (2004) Stream Hydrology: An Introduction for Ecologists. John Wiley and Sons, Ltd, Chichester. [ Links ]
GRI (Garden Route Initiative) (2008) Land cover mapping for the Garden Route Initiative, Cape Action for People and Environment. Data supplied by Mr A Brown, then GRI coordinator, South African National Parks, Knysna. [ Links ]
HARDISON E, C, O'DRISCOLL MA, DELOATCH JP, HOWARD RJ and BRINSON MM (2009) Urban land use , channel incision, and water table decline along coastal plain streams, North Carolina. J. Am. Water Resour. Assoc. 45 (4) 1032-1045. https://doi.org/10.1111/j.1752-1688.2009.00345.x [ Links ]
HOFFMAN MT, CRAMER MD, GILLSON L and WALLACE M (2011) Pan evaporation and wind run decline in the Cape Floristic Region of South Africa (1974-2005): implications for vegetation responses to climate change. Climatic Change 109 437-452. https://doi.org/10.1007/s10584-011-0030-z [ Links ]
HOFFMAN MT and ROHDE RF (2007) From pastoralism to tourism: The historical impact of changing land use practices in Namaqualand. J. Arid Environ. 70 641-658. https://doi.org/10.1016/j.jaridenv.2006.05.014 [ Links ]
IERODIACONOU D, LAURENSON L, LEBLANC M, STAGNITTI F, DUFF G, SALZMAN S and VERSACE V (2005) The consequences of land use change on nutrient exports: a regional scale assessment in south-west Victoria, Australia. J. Environ. Manage. 74 (4) 305-316. https://doi.org/10.1016/j.jenvman.2004.09.010 [ Links ]
JOVANOVIC NZ, ISRAEL S, TREDOUX G, SOLTAU L, LE MAITRE D, RUSINGA F, ROZANOV A and VAN DER MERWE N (2009) Nitrogen dynamics in land cleared of alien vegetation (Acacia saligna) and impacts on groundwater at Riverlands Nature Reserve (Western Cape, South Africa). Water SA 35 (1) 37-44. [ Links ]
KAPP J, FIJEN APM and VAN ZYL F (1995) Towards a Water Management Strategy for an environmentally sensitive and popular tourist region. Water Sci. Technol. 32 245-254. https://doi.org/10.1016/0273-1223(95)00669-9 [ Links ]
KUCHAY NA and BHAT MS (2013) Automated drainage characterization of Dudganga watershed in western Himalayas. Eur. Sci. J. 9 (35) 126-138. [ Links ]
LE MAITRE DC (2000) Pines in cultivation: A global review. In: Richardson DM (ed.) Ecology and Biogeography of Pinus. Cambridge University Press, Cambridge UK. [ Links ]
LE MAITRE DC, KOTZEE IM and O'FARRELL PJ (2014) Impacts of land-cover change on the water flow regulation ecosystem service: Invasive alien plants, fire and their policy implications. Land Use Polic. 36 171-181. https://doi.org/10.1016/j.landusepol.2013.07.007 [ Links ]
LE MAITRE DC, VERSFELD DB and CHAPMAN RA (2004) The impact of invading alien plants on surface water resources in South Africa: A preliminary assessment. Water SA 26 (3) 397-408. [ Links ]
LEMLEY DA, TALJAARD S, ADAMS JB and STRYDOM N (2014) Nutrient characterisation of river inflow into the estuaries of the Gouritz Water Management Area, South Africa. Water SA 40 (4) 687-698. https://doi.org/10.4314/wsa.v40i4.14 [ Links ]
LESCH W (1995) The development of guidelines for the design of streamwater quality monitoring strategies in the forestry industry. WRC Report No. 524/1/95. Water Research Commission, Pretoria. [ Links ]
LIN L, LIN H and XU Y (2014) Characterisation of fracture network and groundwater preferential flow path in the Table Mountain Group (TMG) sandstones, South Africa. Water SA 40 263-272. https://doi.org/10.4314/wsa.v40i2.8 [ Links ]
MAHERRY AM, HORAN MJC, SMITH-ADAO LB, VAN DEVENTER H, NEL JL, SCHULZE RE and KUNZ RP (2013) Delineating river network quinary catchments for South Africa and allocating associated daily hydrological information. WRC Report No. 2020/1/12. Water Research Commission, Pretoria. 46 pp. [ Links ]
MAKAROVA MI, HAUMAIERB L, ZECHB W and MALYSHEVAA TI (2004) Organic phosphorus compounds in particle-size fractions of mountain soils in the northwestern Caucasus. Geoderma 118 101-114. https://doi.org/10.1016/S0016-7061(03)00187-3 [ Links ]
MANTEL SK, HUGHES DA and MULLER NW (2010) Ecological impacts of small dams on South African rivers. Part 1: drivers of change - water quantity and quality. Water SA 36 351-360. [ Links ]
MEHDI B, LEHNERA B, GOMBAULTA C, MICHAUDB A, BEAUDINB I, SOTTILEC M-F and BLONDLOTC A (2015) Simulated impacts of climate change and agricultural land use change on surface water quality with and without adaptation management strategies. Agric. Ecosyst. Environ. 213 (25) 47-60. https://doi.org/10.1016/j.agee.2015.07.019 [ Links ]
MONAGHAN RM, WILCOCK RJ, SMITH LC, TIKKISETTY B, THORROLD BS and COSTALL D (2007) Linkages between land management activities and water quality in an intensively farmed catchment in southern New Zealand. Agric. Ecosyst. Environ. 118 (1-4) 211-222. https://doi.org/10.1016/j.agee.2006.05.016 [ Links ]
MUCINA L and RUTHERFORD MC (2006) The Vegetation of South Africa, Lesotho and Swaziland. Strelitzia 19. South African National Biodiversity Institute, Pretoria. [ Links ]
NEL J, COLVIN C, LE MAITRE D and SMITH J (2013) Strategic water source areas. CSIR/NRE/ECOS/ER/2013/0031/A. Natural Resources and the Environment, CSIR, Stellenbosch. 25 pp. [ Links ]
NEL JL, DRIVER AL, STRYDOM WF, MAHERRY A, PETERSEN C, HILL L, ROUX DJ, NIENABER S, VAN DEVENTER H, SWARTZ ER and SMITH-ADAO LB (2011) Atlas of Freshwater Ecosystem Priority Areas in South Africa: Maps to support sustainable development of water resources. CSIR, Pretoria. 60 pp. [ Links ]
NOSETTO MD, JOBBÁGY EG, BRIZUELA AB and JACKSON RB (2012) The hydrologic consequences of land cover change in central Argentina. Agric. Ecosyst. Environ. 154 2-11. https://doi.org/10.1016/j.agee.2011.01.008 [ Links ]
PARSONS H and GILVEAR D (2002) Valley floor landscape change following almost 100 years of flood embankment abandonment on a wandering gravel-bed river. River Res. Appl. 18 (5) 461-479. https://doi.org/10.1002/rra.684 [ Links ]
PAUW J (2009) Challenges to sustainability in the Garden Route:Water, land and economy. George, South Africa. Nelson Mandela Metropolitan University, Port Elizabeth. 48 pp. [ Links ]
ROYALL D (2013) 13.3 Land-use impacts on the hydrogeomorphology of small watersheds. In: Shroder JF (ed.) Treatise on Geomorphology. Academic Press, San Diego. https://doi.org/10.1016/B978-0-12-374739-6.00341-9 [ Links ]
RUSSELL IA (2013) Spatio-temporal variability of surface water quality parameters in a South African estuarine lake system. Afr. J. Aquat. Sci. 38 (1) 53-66. https://doi.org/10.2989/16085914.2012.742006 [ Links ]
SCHULTZE RE (1997) South African Atlas of Climatology and Agrohydrology. WRC Report No. TT82/96 Water Research Commission, Pretoria. [ Links ]
SCOTT DF (1997) The contrasting effects of wildfire and clearfelling on the hydrology of a small catchment. Hydrol. Process. 11 (6) 543-555. https://doi.org/10.1002/(SICI)1099-1085(199705)11:6<543::AID-HYP474>3.0.CO;2-J [ Links ]
SCOTT DF, LE MAITRE DC and FAIRBANKS DHK (1998a) Forestry and streamflow reductions in South Africa: A reference system for assessing extent and distribution. Water SA 24 187-199. [ Links ]
SCOTT DF, VERSFELD DB and LESCH W (1998b) Eosion and sediment yield in relation to afforestation and fire in the mountains of the Western Cape Province, South Africa. S. Afr. Geogr. J. 80 (1) 52-59. https://doi.org/10.1080/03736245.1998.9713644 [ Links ]
SINGH P, GUPTA A and SINGH M (2014) Hydrological inferences from watershed analysis for water resource management using remote sensing and GIS techniques. Egypt. J. Remote Sens. Space Sci. 17 111-121. https://doi.org/10.1016/j.ejrs.2014.09.003 [ Links ]
SMITH HG, SHERIDAN GJ, LANE PNJ, NYMAN P and HAYDON S (2011) Wildfire effects on water quality in forest catchments: A review with implications for water supply. J. Hydrol. 396 (1-2) 170-192. https://doi.org/10.1016/j.jhydrol.2010.10.043 [ Links ]
SPINK A, HILLMAN M, FRYIRS K, BRIERLEY G and LLOYD K (2010) Has river rehabilitation begun? Social perspectives from the Upper Hunter catchment, New South Wales, Australia. Geoforum 41 (3) 399-409. https://doi.org/10.1016/j.geoforum.2009.12.003 [ Links ]
STANLEY EH and DOYLE MW (2002) A geomorphic perspective on nutrient retention following dam removal: Geomorphic models provide a means of predicting ecosystem responses to dam removal. BioScience 52 (8) 693-701. https://doi.org/10.1641/0006-3568(2002)052[0693:AGPONR]2.0.CO;2 [ Links ]
TONG STY and CHEN W (2002) Modeling the relationship between land use and surface water quality. J. Environ. Manage. 66 377-393. https://doi.org/10.1006/jema.2002.0593 [ Links ]
TYE DRC and DRAKE DC (2012) An exotic Australian Acacia fixes more N than a coexisting indigenous Acacia in a South African riparian zone. Plant Ecol. 213 251-257. https://doi.org/10.1007/s11258-011-9971-6 [ Links ]
VAN WILGEN BW, FORSYTH GG, DE KLERK H, DAS S, KHULUSE S and SCHMITZ P (2010) Fire management in Mediterranean-climate shrublands: a case study from the Cape fynbos, South Africa. J. Appl. Ecol. 47 (3) 631-638. https://doi.org/10.1111/j.1365-2664.2010.01800.x [ Links ]
WLSDF (2015) Local spatial development framework for Wilderness, the Lakes, Hoekwil and the adjacent agricultural areas. Department of Human Settlements, Land Affairs and Planning, George, South Africa. [ Links ]
YU B, JOO M and CAROLL C (2013) Land use and water quality trends of the Fitzroy River, Australia. In: Arheimer B; Collins A (eds.) Understanding Freshwater Quality Problems in a Changing World Proceedings of H04, IAHS-IAPSO-IASPEI Assembly. International Association for Hydrological Sciences, Walliford, Oxfordshire, U.K. 1-8. [ Links ]
ZHANG X and YANG F (2004) Rclimdex (1.0): User Manual. Climate Research Branch of Meteorological Service, Ontario, Canada. [ Links ]
Received 14 June 2016
Accepted in revised form 5 January 2017
* To whom all correspondence should be addressed. Tel.: +27 21 866 2660; Fax: +27 21 866 2682. e-mail: crpetersen@csir.co.za

