


Services on Demand
Article
 English (pdf)
 Article in xml format
 Article references
Indicators

Related links
-
 Cited by Google
 -
 Similars in Google
Share

 Permalink
Water SA
On-line version ISSN 1816-7950
Print version ISSN 0378-4738
Water SA vol.43 n.1 Pretoria Jan. 2017
http://dx.doi.org/10.4314/wsa.v43i1.15
Hydrogeological modelling of the Atlantis aquifer for management support to the Atlantis Water Supply Scheme
Nebo JovanovicI, *; Richard DH BuganI; Gideon TredouxI; Sumaya IsraelI; Rodney BishopII; Vernon MarinusII
ICSIR, Natural Resources and Environment, PO Box 320, 7599 Stellenbosch, South Africa
IICity of Cape Town, PO Box 1694, Cape Town 8000, South Africa
ABSTRACT
The Atlantis Water Supply Scheme (AWSS, Western Cape, South Africa) has been in operation for about 40 years as a means to supply and augment drinking water to the town of Atlantis via managed aquifer recharge (MAR). In this study, the numerical model MODFLOW for groundwater flow and contaminant transport was used in support of the management of the AWSS. The aims were: (i) to calibrate the MODFLOW model for the MAR site at Atlantis; (ii) to run realistic scenarios that cannot be replicated through experiments; and (iii) to make recommendations in support of efficient and sustainable management of the aquifer. MODFLOW was calibrated through comparison of observed and simulated groundwater levels (R2 between 0.663 and 0.995). Scenario simulations indicated possible drawdowns between < 5 m (low groundwater abstraction and low artificial recharge of groundwater through infiltration basins) and > 20 m (high abstraction and high artificial recharge) at localized areas of the Witzand wellfield. At Silwerstroom, large drawdown levels were not predicted to occur, so this wellfield could be exploited more without affecting the sustainability of the groundwater resource. Groundwater moves from the infiltration basins towards the Witzand wellfield at a rate of 120-150 m-a-1. The modelling results supported recommendations for balancing groundwater abstraction and artificial recharge volumes, monitoring the water balance components of the system, the potential risks of groundwater contamination and the delineation of groundwater protection zones.
Keywords: Groundwater abstraction; managed aquifer recharge; MODFLOW; particle tracking; scenario modelling
INTRODUCTION
Managed aquifer recharge (MAR) or artificial recharge of groundwater is the intentional storage of water underground to reduce evaporative losses and utilize the porous aquifer media for water conservation and decontamination (Dillon, 2005). Surplus water is transferred into aquifers through injection via boreholes or through surface ponding and infiltration. This technology is viewed as promising to reduce water losses and recycle water, in particular in arid and semi-arid regions, but is under-utilized in South Africa. Between 2007 and 2010, the South African Department of Water Affairs and Forestry rolled out an artificial recharge strategy with the aims of increasing awareness of MAR, incorporating MAR into their water resources planning and developing demonstration sites (DWAF, 007). Although attempts were made to establish MAR systems in different towns, the technology was successfully applied for a prolonged period only in the Atlantis Water Supply Scheme (AWSS, Western Cape, South Africa).
The AWSS has been in operation for about 40 years as a means to supply and augment drinking water to the town of Atlantis. It collects the town's stormwater runoff and treated domestic wastewater from wastewater treatment works through a system of basins and channels. This water is infiltrated into the alluvial aquifer via two infiltration basins. Groundwater is then abstracted and treated to drinking water quality standard (SANS 241:1, 2011). The detailed operation of the system is described by Bugan et al. (2016). The management of groundwater, in particular the volumes and quality of artificial recharge and abstraction, are of utmost importance for the correct functioning of the system. For sound management of the system, it was essential to gain knowledge on and be able to predict groundwater flow paths and velocity through the aquifer. Groundwater numerical modelling is seen as a useful tool to predict groundwater flow and contaminant transport, and to simulate conditions that cannot be replicated through experiments or for which outcomes need to be known a priori. The outputs of numerical modelling can then be translated into recommendations in support of sound decision-making.
Applications of groundwater numerical modelling are not uncommon for various MAR purposes. In previous work, Rahman et al. (2013) used a combination of spatial multi-criteria decision analysis and numerical modelling (MODFLOW, Harbaugh et al., 2000) to determine the most suitable sites for MAR. Hollander et al. (2009) used MODFLOW to determine the effects of infiltration and withdrawals, and the maximum volume of water which could be stored through MAR to mitigate the negative impacts due to over-exploitation of groundwater in Eastern India. Toze and Bekele (2009) used MODFLOW-MODPATH to estimate the minimum residence time of contaminants for a MAR system in the coastal plains of Western Australia. MODFLOW was also used to predict groundwater levels, flows, storage capacity, potential artificial recharge and recovery locations for mitigating droughts in the Lower Murrumbidgee Groundwater Area of Australia (Khan et l., 2008).
Vandenbohede and Van Houtte (2012) used SEAWAT version 4, a model coupling MODFLOW with the multi-species transport model MT3DMS (Zheng and Wang, 1999), to determine the influence of temperature (seasonality) on MAR surface ponds infiltration, where heat was used as a tracer and temperature as a solute species by analogy of heat and solute transport in porous media. MODFLOW and MT3DMS were also used in a MAR experiment in Greece to investigate the fate and behaviour of 26 organic pollutants (Nham et al., 2015). Zhang et al. (2015) used field data, laboratory experiments and the TOUGHREACT model (Xu et al., 2006) to evaluate transport and transformation of multi-component solutes in groundwater during artificial recharge in a deep confined aquifer in northern Shanghai, South-East China. The reactive transport model PHREEQC (Parkhurst and Appelo, 1999) was used by Pettenati et al. (2014) to quantify water-rock interactions and impacts on groundwater quality during MAR in Indian crystalline basement aquifers, and by Karlsen et al. (2012) to predict groundwater quality following artificial recharge from the river Rhine in the Amsterdam Water Supply Dunes.
In general, previous literature indicated the suitability of using numerical modelling in support of MAR, in particular with MODFLOW and compatible packages. However, it also highlighted the need to set up and calibrate models for specific sites with intrinsic parameters, as findings could not easily be extrapolated to different sites. Given that groundwater numerical modelling is a critical component for sustainable and long-term management of the aquifer in the AWSS, a modelling study was undertaken. Amongst the saturated flow and transport models available, MODFLOW was considered suitable for application in this study because of its ability to simulate groundwater flow in unconfined aquifers and external water and contaminant sources/sinks, such as groundwater abstraction, pollution sources and spatially distributed recharge. The aims of this study were: (i) to calibrate the MODFLOW model for the MAR site at Atlantis under the historic abstraction/recharge conditions using local hydrogeological characteristics; (ii) to run realistic scenario simulations with the calibrated model for hypothetical abstraction/recharge conditions and contaminant travel times; and (iii) to make recommendations in support of efficient and sustainable management of the aquifer.
MATERIALS AND METHODS
Description of the study area
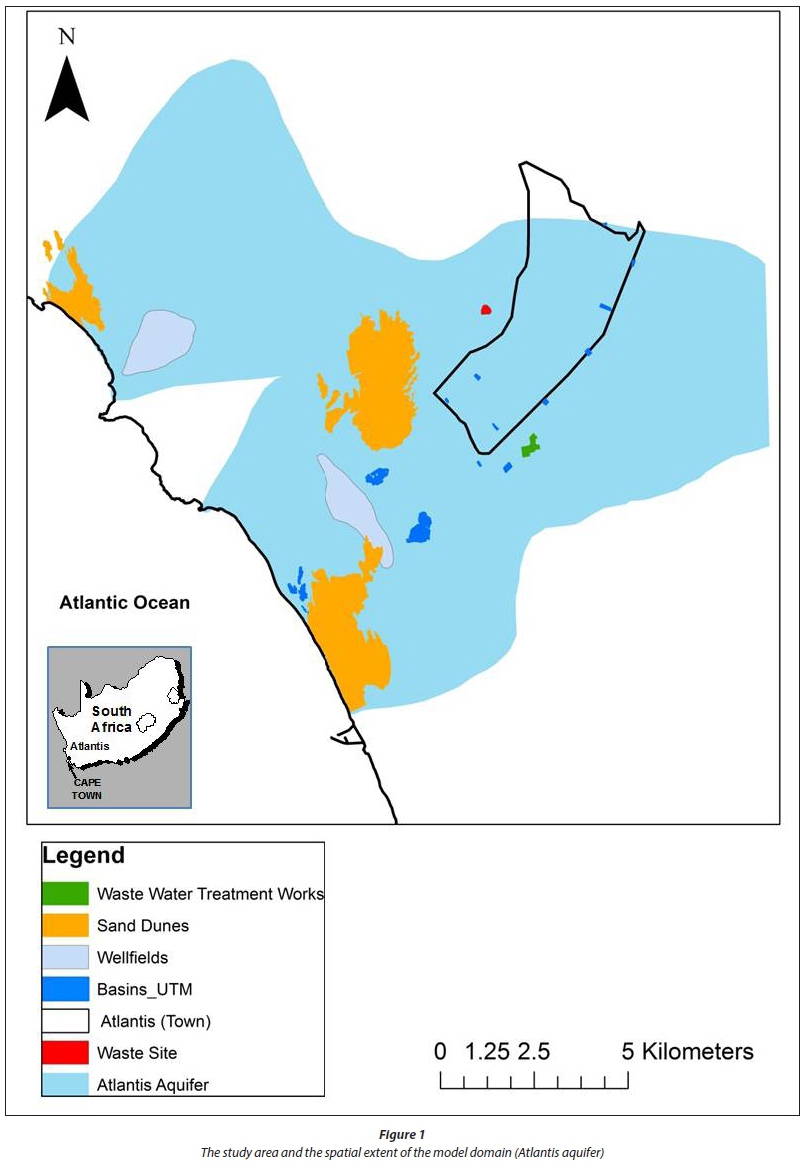
The industrial town of Atlantis is situated approximately 50 km north of the Cape Town city centre, along the dry west coast of South Africa (Fig. 1). The town of Atlantis is strongly dependent on groundwater for its water supply. Treated wastewater and stormwater is diverted to large recharge basins where it infiltrates into a sandy aquifer from where it is abstracted through wellfields and reused for municipal supplies (Fig. 1). The AWSS comprises several components, i.e., stormwater retention basins (in Atlantis town), domestic and industrial wastewater treatment works (WWTWs), recharge basins (middle of Fig. 1), coastal recharge basins (CRBs along the coast), production boreholes and a water softening plant. The full description of the AWSS can be found in Bugan et al. (2016).
On average, approximately 7 500 m3·d-1 of stormwater and wastewater is currently recharged, thereby augmenting the water supply by more than 2.7 x 10⁶ m3·a-1, which means approximately 30% of Atlantis' groundwater supply is augmented through artificial recharge (DWA, 2010). Abstraction from the Atlantis aquifer mainly occurs from the two wellfields shown in Fig. 1, i.e., the Witzand wellfield (South) and the Silwerstroom wellfield (North). The Witzand wellfield is the main wellfield, yielding the majority of the abstraction (15.93 x 10⁶ m3 in the period 20032013) compared to Silwerstroom wellfield (1.70 x 06 m3). A distinct decrease in abstraction occurred after 1999 with the introduction of reticulated surface water supplies, via the Melkbos pipeline. Detailed abstraction data from both wellfields for the period 1993-2012 were reported by Bugan et al. 2016).
The primary coastal aquifer system in the Atlantis area is formed of unconsolidated sediments of Tertiary to Quaternary age, overlying Malmesbury Group bedrock consisting of greywacke and phyllitic shale, and with granite pluton intrusions. The total sand cover reaches a thickness of 60 m with an average of 25 m. The Atlantis aquifer covers an area of about 130 km2 (Fig. 1). The thin aquifer slopes steeply in a south-westerly direction from a maximum elevation of about 160 m in the north-east down to sea level in the west. The granite outcrops of Dassenberg, Kanonkop and at Mamre are the highest points in the area, ranging between 210 m to 410 m amsl (Van der Merwe, 1983).
Atlantis experiences a Mediterranean climate. Annual rainfall measured at the Wesfleur WWTWs (Station 0020/846 Atlantis WWTW) during the period 1980-2012 ranged between 269 mm (2000) and 573 mm (1987), averaging 450 mm. Rainfall mainly occurs between May and September. Due to the sandy surface over most of the area, surface drainage features do not occur and groundwater recharge percentages of 15 to 30% of the annual rainfall are generally experienced, with the higher recharge occurring in the unvegetated sand dune area (Fig. 1).
Groundwater flow model set-up and input data
Groundwater modelling of the Atlantis aquifer was undertaken using Visual MODFLOW Classic Version 2011.1 (VMOD 2011.1, Waterloo Hydrogeologic, 2015). In this modelling exercise, we used the groundwater flow numerical engine MODFLOW-2005 (Harbaugh, 2005) and the standard package for forward and reverse particle tracking MODPATH (SWS, 013).
VMOD 2011.1 was used to build the groundwater model on the densest allowable grid that resulted in grid cells of about 40 m x 40 m. Model domains were (252874.104; 6268184.172) and (272327.811; 6289474.549) in Transverse Mercator LO19 WGS84. Grid cells outside the study area were inactivated to reduce somewhat the computational time and mitigate border effects. No groundwater flow was assumed at the boundary between inactive and active cells. The boundary to the west of the study area was represented by the coastline. The groundwater head was set at 0 along this boundary with the General Head Boundary function of the model.
The groundwater model made use of the following sources of information: ground elevation, geological information (stratigraphy, layer thickness), borehole construction data, groundwater level, groundwater abstraction and groundwater chemistry data, as well as evapotranspiration and hydrogeological data (groundwater recharge, hydraulic conductivity, specific storage, porosity, specific yield). The main sources of information were: the CSIR archives (groundwater abstraction, levels, chemistry and hydraulic properties); production borehole sheets (Bulkwater Branch, City of Cape Town); data and insight from previous studies (Muller and Botha, 1986; Cavé, 1997; Tredoux et al., 1998; Zhang et al., 2001; Bugan et al., 2014; Israel and Tredoux, 2014; Jovanovic et al. 2014).
The model consisted of a one-layer system, i.e., an unconfined sandy aquifer overlaying an impermeable base (Malmesbury Shale). In order to build this spatial layer, two files of point elevation data were imported into VMOD 2011.1, i.e., ground elevation and the elevation of the impermeable base. A 20 m digital elevation model (DEM) was developed from 20 m topographic contour data and spot heights (University of Stellenbosch, Department of Geography and Environmental Studies). The elevation of the impermeable base was derived by subtracting the sand thickness (Muller and Botha, 1986, as modified by Zhang et al., 2001) from the interpolated (inverse distance weighting) ground elevation. The topography of the study area is presented in Fig. 2. The ground elevation ranges from 0 m amsl in the south-west to 220 m amsl in the northeast. The western portion of the Atlantis aquifer is represented by coastal plains and exhibits an elevation of between 20 and 60 m amsl. This is consistent with values reported by Zhang et al. (2001). The interpolated surface elevation is also consistent with surveyed ground elevations at boreholes (Cavé, 1997). The elevation of the basement rock (Malmesbury Shale) varies from 0 m amsl in the west to 160 m amsl in the north/north-west.
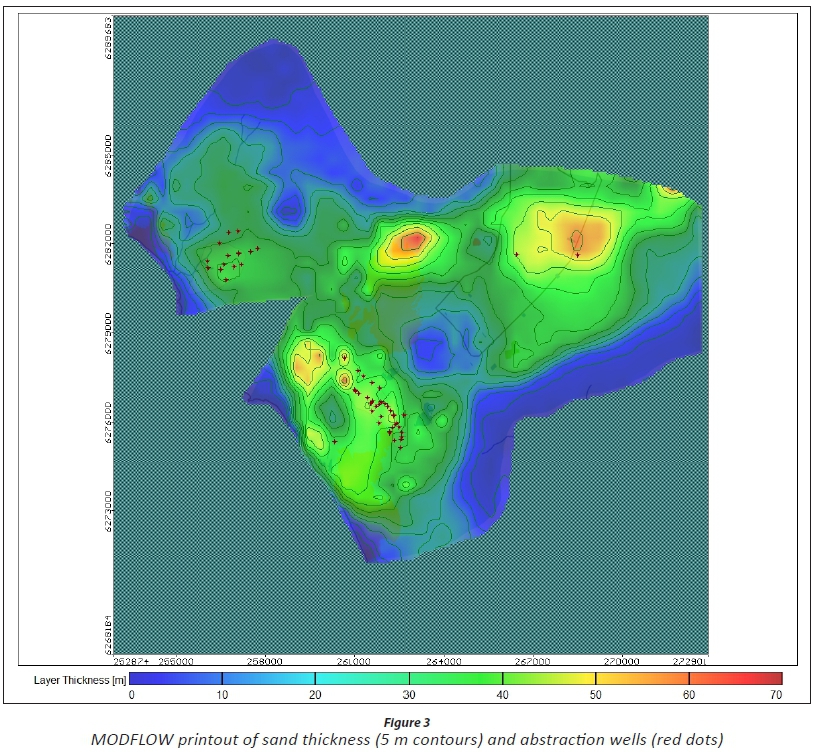
The sand thickness data (difference between ground and basement elevation) are presented in Fig. 3. The thickness of the sediments is variable over the study area (generally between 0 m to 50 m). The sand thickness in the area delineated by the Witzand wellfield (light green area to the south-west) ranges between 30 m and 50 m. This is consistent with data presented by Cavé (1997), who reported that the sand thickness in the Witzand wellfield ranges between 15 m and 46 m, averaging 37 m. The sand thickness in the area delineated by the Silwerstroom wellfield (light green area to the North-West) generally ranges between 20 m and 30 m. Cavé (1997) reported the sand thickness in the Silwerstroom Wellfield to range between 19 m and 54 m, averaging 36 m. The interpolated sand thickness of 40 m to 50 m in the central town area is consistent with observations made by Tredoux et al. (1998), who identified a zone of high exploitation potential in the town centre (around Avondale, Robinvale and Protea Park) where sands were observed to be 40-50 m thick. Fleischer and Hön (1991) reported that the sand in the vicinity of the Atlantis Foundries (immediately south-west of the WWTW, Fig. 1) is approximately 20 m thick, which is within the same order of magnitude (10 m to 30 m) as that presented in Fig. 3.
VMOD 2011.1 requires a fairly accurate measure or estimate of hydraulic properties of the aquifer, as these are key parameters in the simulation of groundwater flow and mass transport. The hydraulic properties required as inputs are: hydraulic conductivity in the horizontal x, y plane and in the vertical zdirection, specific storage, specific yield, effective and total porosity. An extensive literature search was carried out in order to find values for hydraulic properties that were measured or estimated in previous studies (Parsons, 1991; Bredenkamp and Vandoolaeghe, 1982; Du Toit, 1995; Fleischer, 1990; Zhang et al., 2001). Hydraulic properties were delineated for different aquifer zones during the calibration process, as described in the next section.
Besides aquifer hydraulic properties, aquifer recharge is a key factor determining groundwater flow and mass transport. As in the case of hydraulic conductivity, aquifer recharge values were determined during the calibration process for different recharge zones. The evapotranspiration was assigned a value of 350 mm-a-1 (about 80% of mean annual rainfall) in the model domain and the extinction depth for evapotranspiration was 1.5 m based on previous research on groundwater recharge done in the west coast area of the Western Cape (Jovanovic et al., 2012). Groundwater recharge and evapotranspiration were entered in the model in mm-a-1 for the whole simulation period as steady fluxes.
VMOD 2011.1 requires groundwater level observations in wells, which are used to assess the model performance, i.e., a comparison of simulated and observed groundwater levels. There are more than 500 boreholes and wellpoints, which are located in the study area. The observation wells are shown in Fig. 2. Groundwater level measurements were entered on days when the measurements were taken. The pumping wells which contributed to abstraction during the modelling period are shown in Fig. 3. Monthly historic inputs of groundwater abstraction were entered. Abstraction also occurred from 2 boreholes located in the town area, mainly for irrigation purposes.
Model calibration
For calibration purposes, VMOD 2011.1 was set up to run from January 1993 to December 2011, i.e., Day of Simulation 1 was 1 January 1993 and the total length of simulation was 6 939 days (31 December 2011). This initial date was chosen because monthly abstraction data were only available from this time and the spatial distribution of groundwater level data during January 1993 was sufficient to compute an adequate initial head layer for the model. A good initial set of data for the starting heads of the simulation can reduce the required run time significantly. The initial head values are also used to calculate the drawdown values, as measured by the difference between the starting head and the calculated head. The total number of points used in the interpolation of initial heads was 241, corresponding to the head measurements available for the period 1-14 January 1993. The model was set up to run at a daily time step and in transient mode.
In order to obtain reliable model simulations of water balance and mass transport (e.g. movement of chemicals), it is essential to simulate groundwater flow and heads with accuracy. This is because the bulk of chemical movement in porous media is likely due to convective transport together with water flow. In hydrogeological modelling, it is well-known that groundwater flow and mass transport are particularly sensitive to hydraulic conductivity. Particular attention was therefore dedicated to parameterize the model for hydraulic conductivity in different aquifer zones. This was done through model calibration. The model of Zhang et al. (2001) was used as a starting point to define the aquifer properties, recharge and hydraulic conductivity zones. Zhang et al. (2001) used the automatic parameter estimation programme WinPest as part of the MODFLOW package to parameterize aquifer properties. Hydraulic conductivities and other aquifer properties/input parameters were modified in different zones, the model was run, and the simulated groundwater levels were compared to the measured data. This process was repeated by 'trial and error' until the best match was achieved between simulated and observed groundwater levels. The statistical indicators used in VMOD 2011.1 to evaluate the fit between simulated and observed groundwater levels and thereby model performance were residuals, standard and root mean square errors, and the correlation coefficient.
Hydraulic conductivity tended to be lower in the higher elevation parts of the model domain (e.g. Atlantis town) and increased towards the coastline (Fig. 4). It was particularly high in the area of the Witzand wellfield (1.9 m-d-1) and Silwerstroom wellfield (2.5 m·d-1). Recharge Basins 7 and 12 were assigned a high value of hydraulic conductivity (20 m-d-1) due to saturated and positive pressure conditions. Low conductivity was assigned along the coastline, where fine sand occurs. Relatively high hydraulic conductivities (0.6-1.7 m·d-1) were also assigned to the sand dunes in the middle of the study area (Fig. 4). Hydraulic conductivity in the three dimensions was assumed to be the same. The estimated values after calibration were in the range of those reported by Zhang et al. (2001). The calibrated hydraulic conductivities in Fig. 4 represent values applicable to the domain of the regional aquifer. In reality, hydraulic conductivity is variable in space. Localized hydraulic conductivities reported in the literature generally refer to pumping test-derived values calculated with different methods. For example, data of transmissivity and aquifer thickness reported by Cavé (1997) were used to estimate hydraulic conductivities. These ranged from 1.2 to 57.6 m-d-1 with an average of 14.6 ± 14.9 m-d-1 at different locations in the Witzand and Silwerstroom wellfields, and town area. Parsons (1991) recommended hydraulic conductivity values of 25 m·d-1 for the Witzand wellfield and 13 m·d-1 (vertical) for the Silwerstroom wellfield. Other estimates of hydraulic conductivity were 1.5-1.8 m-d-1 in the industrial area (GCS, 2000). It is clear from these data that there is a large spatial variability and that the model-calibrated hydraulic conductivities (Fig. 4) were in the lower range of those derived from pumping tests.
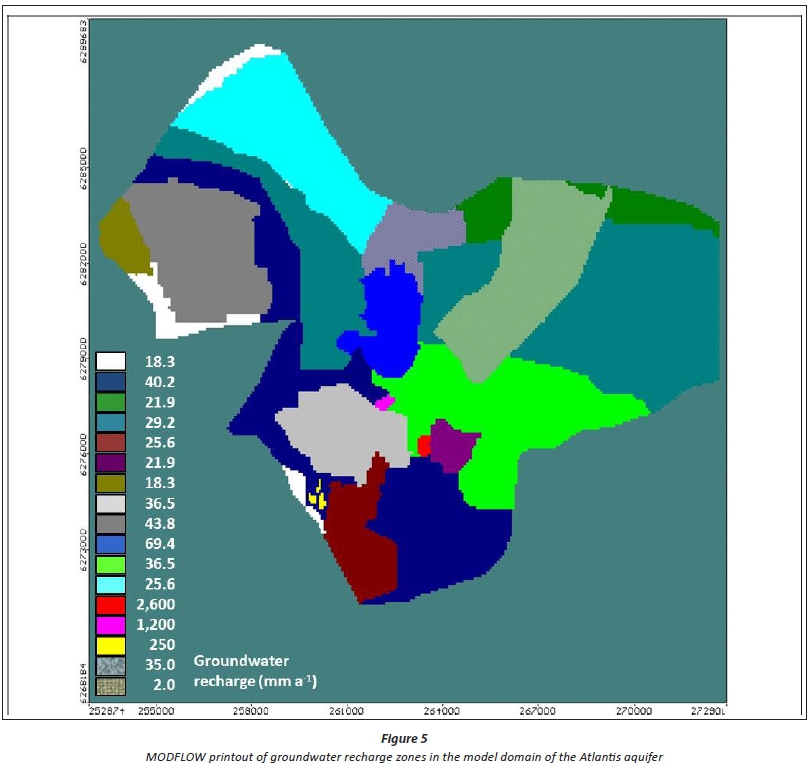
As in the case of hydraulic conductivity, aquifer recharge values were determined by calibration ('trial and error') for different groundwater recharge zones (Fig. 5), until a good fit was obtained between simulated and observed values of groundwater level. Natural recharge varied between 10 mm-a-1 and 69.4 mm·a-1 (sand dunes), corresponding to 2% and 15% of rainfall, respectively. A low recharge value was assigned to the urban area of Atlantis (2 mm·a-1). The estimated values after calibration did not differ much from those of Zhang et al. (2001). Recharge values reported in the literature varied in the range 13-30.3% of rainfall with the hydrograph method, 42% in sand dunes and 25% in vegetated dunes (Fleischer and Eskes, 1992 cited in Zhang et al., 2001), 9-44 mm·a-1 (Du Toit, 1997 cited in Zhang et al., 2001) and 10-30% of rainfall with an average of 16% (Fleischer, 1990 cited in Parsons, 1991).
Model outputs were not found to be particularly sensitive to other aquifer properties, namely, specific storage, specific yield, effective and total porosity. Specific storage used in the model was between 0.06 and 0.2 m-1, specific yield was set at 0.17, effective porosity was 0.15 and total porosity was 0.23, after Zhang et al. (2001). Values of specific yield reported in the literature were 0.085-0.18 (Fleischer and Eskes, 1992 cited in Zhang et al., 2001), 0.11-0.17 (Du Toit, 1997 cited in Zhang et al., 2001) and 0.25 in the upper part of the aquifer (Fleischer, 1990 cited in Parsons, 1991). A porosity of 23% was estimated by Fleischer (1990 cited in Parsons, 1991).
Particular attention was dedicated to the artificial aquifer recharge through the recharge basins (Fig. 5). Due to a lack of historic measurement of inflow into the recharge basins, the volumes of artificial aquifer recharge were estimated from the water balance of the system (Bugan et al., 2014, 2016) and by model calibration ('trial and error'). Table 1 shows the characteristics of the recharge basins and the aquifer artificial recharge volumes. The wide range of annual artificial recharge was due to historic fluctuations (the historic artificial recharge for the 20-year period was not as high as the values calculated for the last 10 years). The assumption was that all artificial recharge water was distributed over the whole basin area, i.e., Basin 7, Basin 12 and the CRBs, with equal daily volumes over the whole year. In reality, all of the basin areas are not constantly filled with water. The lower ranges of artificial recharge were obtained by model calibration, while the higher ranges were estimated from the water balance of the system (Bugan et al., 2014, 2016). The calibration exercise reiterated the need to measure accurately the inflow of water into the basins.
Scenario simulations
In order to support management of the AWSS, three scenarios were constructed and run with VMOD 2011.1. The groundwater heads obtained at the end of the calibration simulations were imported into the model as initial heads for the scenario simulations. The model was set up to simulate 10 years (3 652 days) with the conditions summarized in Table 2 (all other input data were the same as in the calibration runs).
Scenario 1 was the best-case scenario in terms of contaminant transport (Table 2). Artificial recharge amounts were obtained from model calibration to represent a scenario of low recharge into Basins 7 and 12. The pumping rates represent a scenario of relatively low abstraction due to borehole clogging and water transfers from the Berg River (Bugan et al., 2014, 2016). Scenario 2 represented the worst-case scenario in terms of contaminant transport (Table 2). It used high artificial recharge amounts estimated in the water balance assessment, whilst the potential groundwater abstraction corresponded to estimated optimal pumping rates for which the system was initially designed (Bugan et al., 2014, 20156). In this way, two extreme case scenarios were considered. The MODPATH application (standard package for forward and reverse particle tracking) of VMOD 2011.1 was run for tracking of particles released at Basins 7 and 12, representing the pathway for potential contaminants entering the system through artificial recharge.
Scenario 3 was simulated to track forward particles (potential contaminants) released from the landfill at Atlantis (waste site in Fig. 1), the maturation ponds of the WWTWs (Fig. 1), and the industrial area in the south-west of Atlantis, as well as to track backward particles from the wellfields. The purpose was to determine the travel time through the aquifer and adjust the contours of the existing groundwater protection zones. Although the landfill is located in an upstream area that is not directly affected by artificial recharge and wellfield abstraction (Scenarios 1 and 2), it may represent a potential contamination risk to the Witzand wellfield in the long run. The WWTWs and the industrial area in the south-west of Atlantis may represent a risk given their proximity to the Witzand wellfield. In order to simulate a worst-case Scenario 3 in terms of pollution risk, groundwater recharge was assumed to be 400 mm·a-1 in the area of the landfill, WWTWs and industrial area. This condition represents a hypothetical scenario of poor management, where most of the rainfall washes off non-reactive contaminants from the surface and vadose zone, and percolates to groundwater through preferential flow paths.
RESULTS AND DISCUSSION
Model calibration
After setting up the model and entering the input data as described in the previous section, model simulations were run for the period from 1993 to 2011. Figure 6a represents the comparison of calculated and observed groundwater levels for all boreholes. The statistical analysis in Fig. 6a gives an indication of the performance of the model. The closer the data points are to the 1:1 line, the better the prediction and performance of the model. The lower the statistical indicators are in the bottom of the graph (residuals, standard and root mean square errors), the better the prediction and performance of the model. The correlation coefficient (bottom of the graph) is an indication of the fit between the simulated and observed values. The closer the correlation coefficient is to 1, the better the fit. In general, the model performed well in terms of predicting groundwater levels.

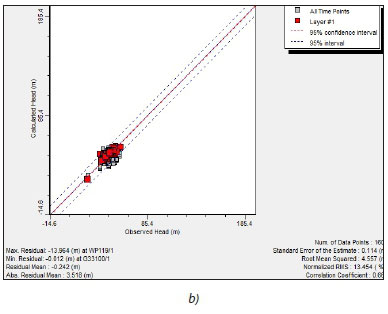

Although the absolute mean residual may seem high (average error in the estimate of groundwater level is 2.78 m), this should not be considered as a large error for an aquifer area of about 130 km2. A large part of this error is attributed to individual boreholes that were not directly affected by abstraction, or were too far from the abstraction and water supply operations (e.g. boreholes in the vicinity of the coastline and boreholes in town that are subject to additional recharge pathways due to the stormwater system). Numerous interpolations during the model set-up (e.g. interpolated topographical elevations, initial groundwater levels, etc.) may affect initial groundwater levels in certain areas. In addition, groundwater recharge and evapotranspiration were expressed as steady fluxes and thus the model was not set up to replicate the seasonal fluctuations in groundwater levels. For this reason, the mean residual was much lower (0.344 m) compared to the absolute mean residual. The high correlation coefficient (0.995) also indicated that the trends in groundwater levels were simulated well by the model.
From the Atlantis water supply management perspective, the key areas are the Silwerstroom and Witzand wellfields, as well as the artificial recharge basins in the vicinity of the Witzand wellfield (Fig. 1). Figure 6b represents the calibration graph (comparison of measured and simulated groundwater levels) for the boreholes in the Witzand wellfield. Figure 6c shows the comparison for the Silwerstroom wellfield. Model simulations for these two wellfields were generally satisfactory. Model performance was better for the Witzand wellfield in terms of the residual mean, but worse in terms of the absolute residual mean compared to the Silwerstroom wellfield. The relatively low correlation coefficient calculated for the Witzand wellfield (0.663) was due to the clustering of data points around a certain value of groundwater level, higher abstraction and stronger fluctuations in groundwater levels when compared to the Silwerstroom wellfield and the effects of the adjacent recharge basins. The simulated and observed groundwater levels in the Silwerstroom wellfield were more spread along the 1:1 line. The model was not set up to simulate seasonal fluctuations of groundwater levels as steady natural and artificial recharge fluxes were assumed and entered in the model. For some boreholes, large errors were observed in the beginning of the simulations, but this evened up over time as flows tended to equilibrate.
Scenario simulations
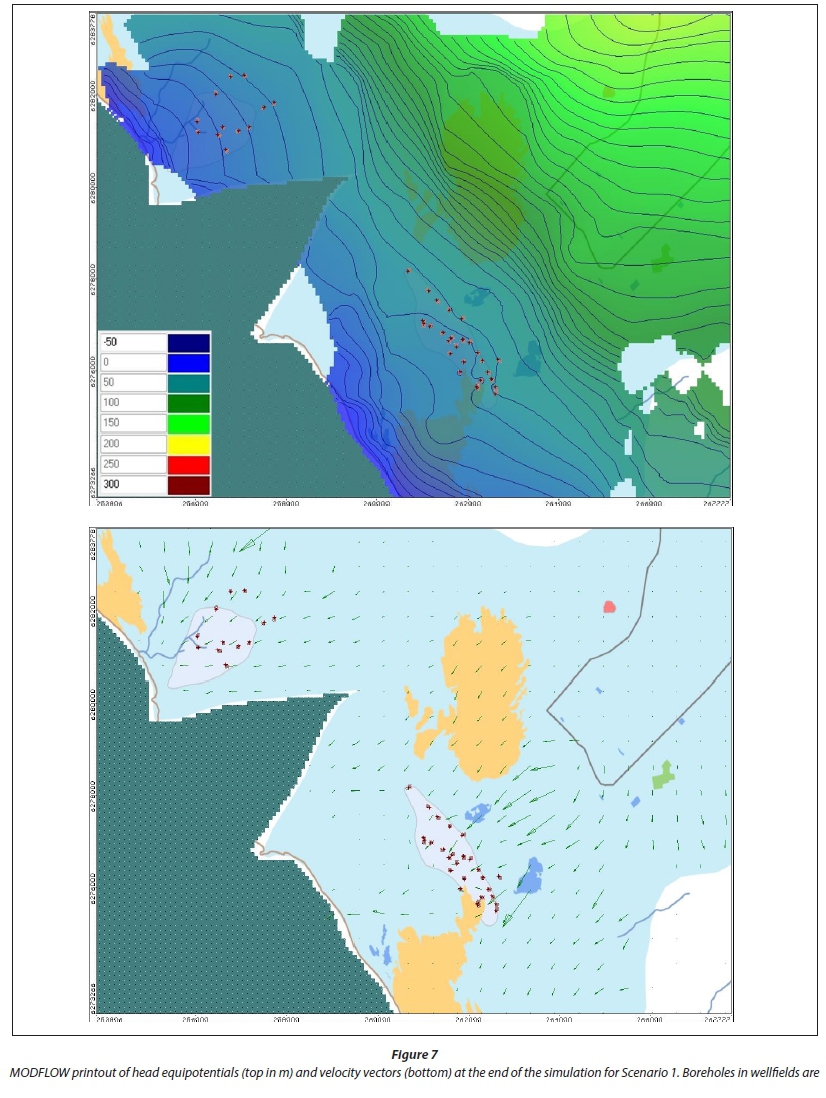
Once confidence was gained in the performance of the model, scenario simulations were run in order to draw feasible recommendations for the aquifer management in the AWSS. For Scenario 1 (low artificial groundwater recharge and low groundwater abstraction, Table 2), head equipotentials and velocities are shown in Fig. 7, whilst drawdown and particle tracking from Recharge Basins 7 and 12 are shown in Fig. 8.
After 10 years, head equipotentials in the Witzand wellfield had a lower gradient and the heads tended to be lower compared to the initial conditions due to low abstraction and low artificial recharge. For the Silwerstroom wellfield, heads tended to be higher than initial conditions indicating some natural recharge of the aquifer occurred. The velocity vectors (depicted as arrows in Fig. 7) are an indication of the direction and intensity of groundwater flow in the system. From Fig. 7, it is evident that the dominant groundwater flow direction occurs from the north-east to the south-west towards the coast, across head equipotential lines. The intensity of groundwater flow is particularly high around the wellfields, where aquifer hydraulic conductivities are higher. The highest groundwater flow rate occurs in the vicinity of the recharge basins towards the coastline. It was also evident that the intensity of groundwater flow reduces over time as the system tended to approach energy equilibrium.
Drawdown was predominantly < 5 m in certain areas in the Witzand wellfield, and very localized in the Silwerstroom wellfield (Fig. 8). The particle pathlines from Basins 7 and 12 are shown in the zoomed-in map in Fig. 8. The scale interval of the axes in the map is 600 m, so the particles travelled about 1.2 km in 10 years, at a rate of more than 100 m per year, reaching most boreholes in the wellfield. Travel time was shorter from Basin 7 than from Basin 12. Water withdrawal occurred evenly from the boreholes indicated on the map. Basin 7 was always recharged more than Basin 12.
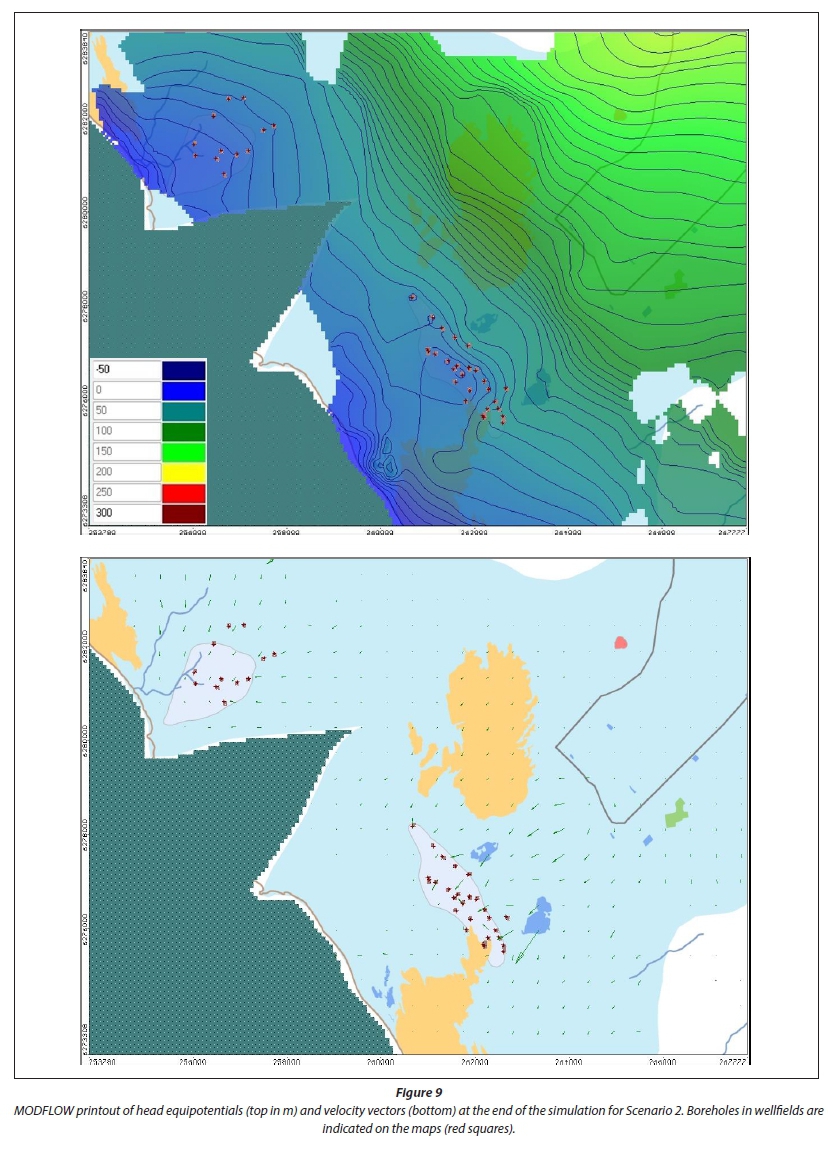
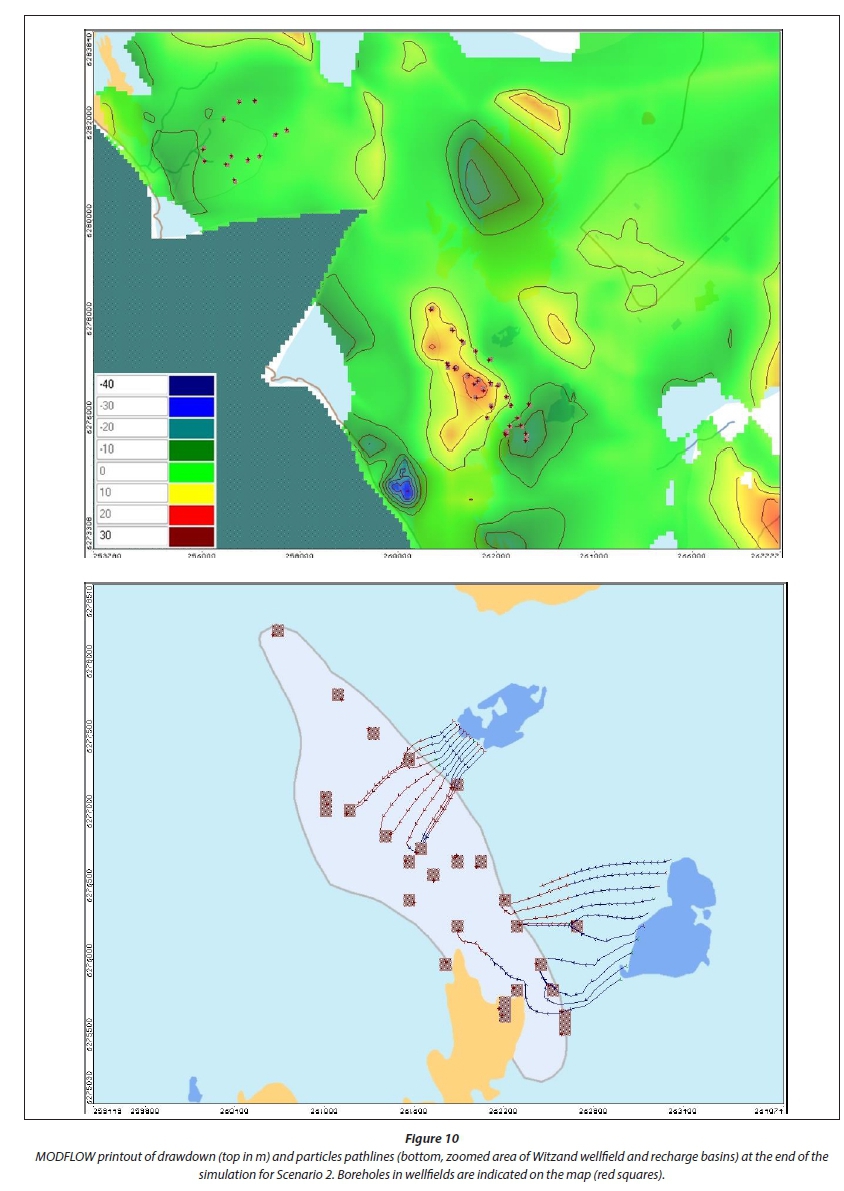
For Scenario 2 (high artificial groundwater recharge and high groundwater abstraction, Table 2), head equipotentials and velocities are shown in Fig. 9, whilst drawdown and particle tracking from Recharge Basins 7 and 12 are shown in Fig. 10. Head equipotentials in the Witzand wellfield dropped after 10 years, while they stayed relatively unchanged in the Silwerstroom wellfield when compared to initial conditions (Fig. 9). The intensity of velocity vectors was generally higher compared to Scenario 1 (Fig. 7). Drawdown was large in the Witzand wellfield (predominantly about 5 m with higher peaks at > 20 m in localized areas). It was localized in the Silwerstroom wellfield. Particle pathlines covered longer distances compared to Scenario 1, given the higher water pressure exercised by the high artificial recharge at the basins and the high groundwater abstraction. This was especially evident for Basin 7, from where particles covered distances > 1.5 km in 10 years (Fig. 10).
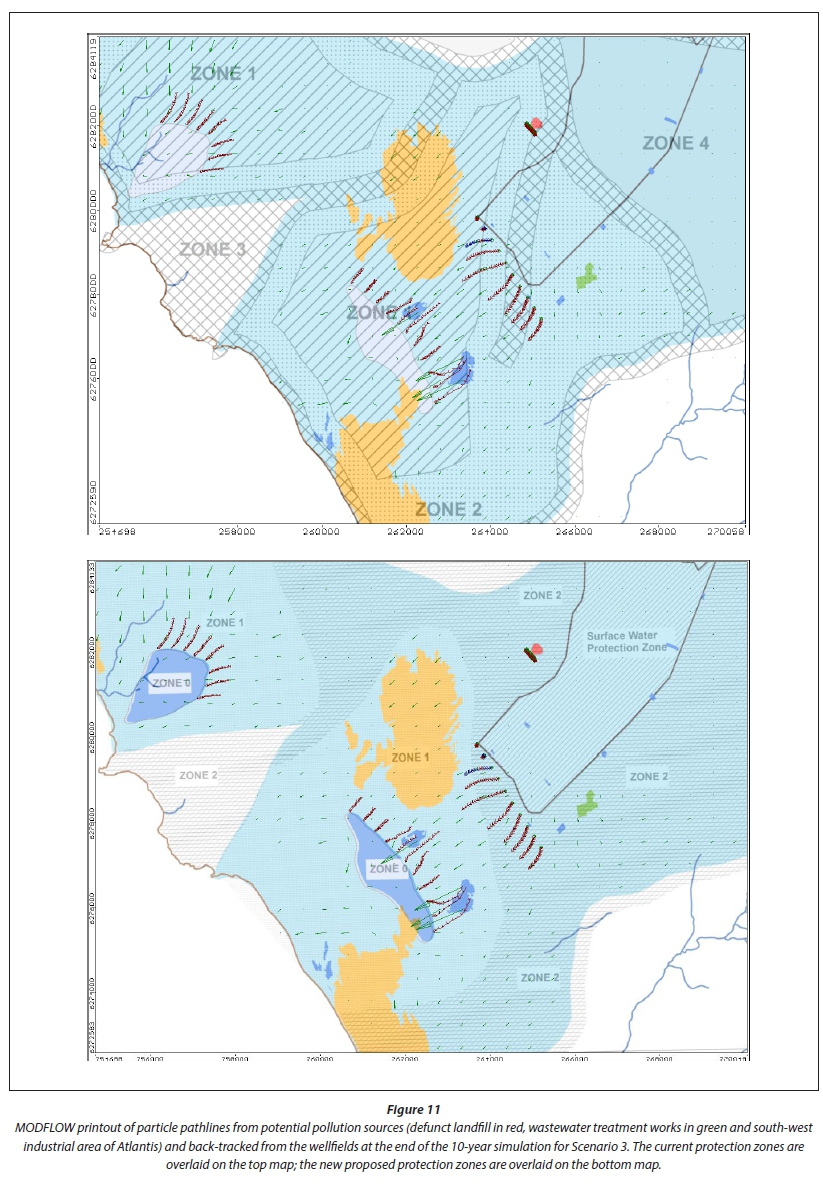
Scenario 3 was investigated to determine the pathlines from potential pollution sources, namely the defunct landfill close to the town of Atlantis, the WWTWs and the industrial area in the south-west of Atlantis. Due to the location of the pollution sources (upstream of the AWSS), the volumes of artificial recharge and groundwater abstraction did not have a large effect. However, any contamination originating from these sources could affect the water quality in the scheme. Figure 11 presents the results of particle tracking from the pollution sources. The scale interval is 2 km. The current groundwater protection zones are also overlaid on the top map in Fig. 11. Particles released at the landfill covered < 100 m in 10 years. These travel times are very slow due to the low hydraulic conductivity in this area of the aquifer. It is likely that contaminants would only reach the monitoring boreholes in the proximity of the landfill 10 years after release. This is consistent with data observed during consulting work done for the closure permit of the waste site (Tredoux et al., 2013). Particles released at the south-west industrial site and WWTWs are likely to travel at a speed of about 1 km per 10 years in this scenario. Backward particle tracking from the wellfields predicted similar travel times.
In previous work, the need for a protection zone plan associated with each production borehole and the wider associated aquifer recharge area was apparent from flow vector plots derived from the earlier MODFLOW study (Zhang et al., 2001) as well as Surfer software calibrated with the monitored groundwater levels. The main areas of concern from a groundwater pollution point of view were the nearby landfill sites for mixed domestic and builders refuse and spent casting sand, as well as the dry weather stormwater recharge entering Recharge Basin 7. Consequently, an initial layout of groundwater protection zones was drafted (Fig. 11, top map). A software program, WHAEM2000, based on the analytic element method (Kraemer et al., 2007) was used, which modelled homogenous soil parameter values and inhomogeneity areas of reduced permeability to define basement topography and surface watersheds. This model was used to generate particle traces and the capture zones of various production boreholes. Very plausible agreements in flow directions and particle traces were obtained and these compared well with the MODFLOW (Zhang et al., 2001) and Surfer flow vectors. This was used to define Zones 0, 1, 2, 3 and 4. Production Zones (Zone 0) are overlapping circles with 150 m radius surrounding each production borehole, where every precaution must be taken to prevent surface pollution and harmful land use. The primary protection zones (Zone 1) surround Zone 0 and have strict land use criteria to restrict development and promote controlled land use, causing a natural environment to predominate and promote natural or artificial recharge. Zone 2 is a secondary protection zone and Zone 3 coincides with an area of elevated basement that is thought to compartmentalize aquifers (Van der Merwe, 1983), at least during dry periods when groundwater levels are low. Both Zones 2 and 3 represent buffer areas to the inner zones, Zones 1 and 0, with land use controls. Zone 4 represents the surface watershed. An additional Zone 5 has land use criteria aimed to prevent inadvertent surface pollution crossing the watershed into the aquifer, whilst Zone 6 represents the areas not expected to influence the aquifer (not on map). However, it was recognised that on-going monitoring information and further modelling was needed to more accurately define and understand the designated aquifer protection zones as well as to inform possible spatial and land use amendments. Scenario 3 (Table 2) was therefore used in this study to verify and adjust the groundwater protection zones.
A new delineation of groundwater protection zones was proposed, as outlined in the bottom map of Fig. 11. Zones 0 and 1 remained with the same description, where strict environmental criteria are applied to promote natural or artificial recharge. Zone 0 coincides with the wellfields, and the primary protection zones, Zone 1, surround Zone 0. The remaining zones from the top map in Fig. 11 were clumped into secondary protection zones, Zone 2, with an additional Surface Water Protection Zone delineated to coincide with the Atlantis town boundaries, where stormwater runoff is regulated via the stormwater system. The boundaries between Zone 1 and Zone 2 (bottom map in Fig. 11) were delineated according to the following criteria: (i) they lie between existing land use activities, and wellfields and recharge areas (sand dunes); (ii) existing land uses that need to be controlled as potential sources of pollution fall in Zone 2; (iii) areas with intense groundwater flow vectors in the direction of the wellfields fall in Zone 1. The eastern and northern boundaries between Zone 1 and Zone 2 follow the areas of elevated basement. The groundwater protection zone, Zone 2, to the west is characterized by elevated basement and negligible groundwater reserve.
CONCLUSIONS AND RECOMMENDATIONS
A one-layer model of the Atlantis aquifer was constructed using the software package VMOD 2011.1. Overall, the model performance was satisfactory, including the key management areas of the Witzand and Silwerstroom wellfields. Ten-year scenario simulations indicated that good management of the system is the key factor in sustainable utilization of groundwater. Managing the volumes of artificial recharge through Basins 7 and 12 is perhaps even more important than abstraction volumes in terms of sustainability. Under conditions of high recharge and low abstraction, a negative drawdown may occur in particular around Basin 7. The high artificial recharge can be compensated through higher abstraction rates. However, conditions of high artificial recharge and high groundwater abstraction are the most conducive to fast transport of potential contaminants and they represent the highest risk in terms of impacts on groundwater quality and human health.
The model predicted that particles released at Basins 7 and 12 moved at a rate between 1.2 km per 10 years (conditions of low artificial recharge and low abstraction) and > 1.5 km per 10 years (conditions of high artificial recharge and high abstraction) in the directions of the closest production boreholes in the Witzand wellfield. Particles travelled faster from Basin 7 than from Basin 12. It should be noted that the inflow into Basins 7 and 12 is regulated with a passive weir splitter. Basin 7 receives low flows (largely treated effluent from the WWTWs), while Basin 12 is intended mainly for recharge by peak-flow stormwater (usually of good quality).
The scenario with particle tracking from pollution sources indicated that particles move at a speed of about 100 m per 10 years from the old landfill, due to the low hydraulic conductivity in that zone of the aquifer. The effects of any contaminant release from the waste site would likely take a very long time to manifest at the Witzand wellfield. In the south-west industrial area of Atlantis and in proximity of the WWTWs, particles move at a speed of about 1 km per 10 years, due to higher aquifer hydraulic conductivities. This necessitated the extension of the groundwater protection zones and the inclusion of a Surface Water Protection Zone in the town of Atlantis as the stormwater is routed to Basins 7 and 12.
The calibration exercise highlighted some limitations of the model and the need to measure/determine accurately certain parameters and variables in the system. Two main uncertainties in the input data were the hydraulic conductivity values and the inflow of water into the artificial recharge basins. The model was calibrated and run using hydraulic conductivity values applicable to the domain of the regional aquifer. These hydraulic conductivities were in the lower range of those derived from pumping tests and reported in the literature. A more detailed calibration using pumping test-derived hydraulic conductivities will be required for the localized areas of the Witzand and Silwerstroom wellfields. The inflow of water into the artificial recharge basins was not measured in the past and it had to be estimated from the water balance of the system. As the water inflow into the recharge basins is a fundamental component of the Atlantis MAR system, it will be highly beneficial to initiate monitoring of this variable.
Recorded monthly pumping rates were used in the calibration simulation and constant pumping rates in the scenario simulations. Natural recharge and artificial recharge were assumed to be steady, both in the calibration simulations (1993-2011) and the 10-year scenario simulations. In this way, the model predicted long-term trends in groundwater levels well; however, it was not set up to predict seasonal fluctuations and the effects of short time-scale variations in recharge and abstraction (e.g. intermittent pumping of different boreholes). In particular, natural recharge was estimated as a percentage of average rainfall, while a more mechanistic estimate is required in order to predict seasonal fluctuations of groundwater levels, based on actual rainfall intensity and distribution. For this purpose, the model will have to be set up differently, for example, by using monthly recharge values and evapotranspiration to describe seasonal fluctuations in groundwater levels. This finer time-scale calibration can be done at intensive monitoring sites/recharge zones around the wellfields by establishing, for example, a monitoring programme with data loggers to record continuously groundwater levels.
In summary, the AWSS has been running for many decades during which the understanding of the functioning of the system and its management requirements has improved. Various methods have been used to refine our understanding of the protection of the water resource and its management. To some extent, the correspondence between monitored data, the Hazard Analysis and Critical Control Points (HACCP) included in the risk management plan (Bugan et al., 2014 and 2016), the protection zones outlined with Surfer and WHAEM2000, and MODFLOW outputs gives us confidence in our understanding of the system. It also shows up shortcomings and the need for localized calibration of groundwater flow that can be addressed in future work, given that it will require substantial effort in time and resources.
Similar recommendations can be made for other managed aquifer recharge sites, in particular those established on sandy alluvial aquifers. The management of the system depends primarily on groundwater abstraction and the volume of artificial recharge of groundwater. The importance of establishing an intensive and relevant monitoring programme is also stressed. Scenario modelling with calibrated groundwater flow models is a recommended tool to support water management decisions in such systems, depending on the quality of input data.
ACKNOWLEDGMENTS
The authors thank the Utility Services, Bulk Water (Atlantis Water Supply Scheme) and Scientific Services Branches of the City of Cape Town, and the CSIR Parliamentary Grant for funding this study.
REFERENCES
BREDENKAMP DB and VANDOOGLAEGHE MAC (1982) Die ontginbare grondwater potensiaal van die Atlantisgebied. Technical Report GH 3227. Department of Environmental Affairs, Pretoria, South Africa. [ Links ]
BUGAN RDH, JOVANOVIC NZ, TREDOUX G and ISRAEL S (2014) Provision of professional services for Atlantis Water Supply Scheme: Artificial recharge scientific and operational support. Hydrogeological resource assessment and water balance. Contract No. SCMS 45/01/11 to the City of Cape Town. CSIR Natural Resources and the Environment, Stellenbosch. [ Links ]
BUGAN RDH, JOVANOVIC NZ, TREDOUX G and ISRAEL S (2016) Four decades of water recycling in Atlantis: Past, present and future. Water SA 42 (4) 577-594. https://doi.org/10.4314/wsa.v42i4.08 [ Links ]
CAVÉ L (1997) Inventory of Atlantis production boreholes. Report No. ENV-S-C 97134, CSIR Environmentek, Stellenbosch. [ Links ]
DILLON P (2005) Future management of aquifer recharge. Hydrogeol. J. 13 (1) 313-316. https://doi.org/10.1007/s10040-004-0413-6 [ Links ]
DU TOIT IM (1995) Management options in the Atlantis Aquifer. MSc thesis, University of the Free State, Bloemfontein, South Africa. [ Links ]
DWA (Department of Water Affairs, South Africa) (2010) Strategy and guideline development for national groundwater planning requirements. The Atlantis Water Resource Management Scheme: 30 years of artificial groundwater recharge. Report No. PRSA 000/00/11609/10 - Activity 17 (AR5. 1). Department of Water Affairs, Pretoria. [ Links ]
DWAF (Department of Water Affairs and Forestry, South Africa) (2007) Artificial Recharge Strategy: Version 1.3. Report to the Department of Water Affairs and Forestry, Pretoria. [ Links ]
FLEISCHER JNE (1990) Atlantis Groundwater Management Programme. The geohydrology of the Witzand Field. Report No. 2/90. CSIR Groundwater Programme, Stellenbosch. [ Links ]
FLEISCHER JNE and HON A (1991) Feasibility of marginal groundwater exploration in Atlantis. Report to WCRSC, Report No. 34/91. CSIR, Stellenbosch. [ Links ]
GCS (2000) Novel spinners. Development of groundwater supply. Groundwater Consulting Services Report No. GCS 99-W04-16, Plumstead, Cape Town, South Africa. [ Links ]
HARBAUGH AW, BANTA ER, HILL MC and McDONALD MG (2000) MODFLOW-2000, the US Geological Survey modular ground-water model - user guide to modularization concepts and the ground-water flow process. US Geological Survey Open File Report 00-92. USGS, Reston, Virginia. [ Links ]
HARBAUGH AW (2005) MODFLOW-2005, The U.S. Geological Survey modular ground-water model-the ground-water flow process. US Geological Survey Techniques and Methods 6-A16. USGS, Reston, Virginia, USA. [ Links ]
HOLLANDER HM, MULL R and PANDA SN (2009) A concept for managed aquifer recharge using ASR-wells for sustainable use of groundwater resources in an alluvial coastal aquifer in Eastern India. Phys. Chem. Earth 34 270-278. https://doi.org/10.1016/j.pce.2008.05.001 [ Links ]
ISRAEL S and TREDOUX G (2014) Provision of professional services for Atlantis Water Supply Scheme: artificial recharge scientific and operational support. water quality assessment and define protection zones. Contract No. SCMS 45/01/11 to the City of Cape Town. CSIR Natural Resources and the Environment, Stellenbosch. [ Links ]
JOVANOVIC N, BUGAN RDH, ISRAEL S, DZIKITI S, KAPANGAZIWIRI E, LE MAITRE D, ROZANOV A, STANDER M, MIKES D, MAY F, JARMAIN C and EVERSON C (2012) Reducing uncertainties of evapotranspiration and preferential flow in the estimation of groundwater recharge. WRC Report No. K5/1909. Water Research Commission, Pretoria. [ Links ]
JOVANOVIC NZ, TREDOUX G, BUGAN RDH, ISRAEL S and STEYN M (2014) Provision of professional services for Atlantis Water Supply Scheme: artificial recharge scientific and operational support. research resource expansion potential and updated numerical model. Contract No. SCMS 45/01/11 to the City of Cape Town. CSIR Natural Resources and the Environment, Stellenbosch. [ Links ]
KARLSEN RH, SMITS FJC, STUYFZAND PJ, OLSTHOORN TN and VAN BREUKELEN BM (2012) A post audit and inverse modeling in reactive transport: 50 years of artificial recharge in the Amsterdam Water Supply Dunes. J. Hydrol. 454-455 7-25. https://doi.org/10.1016/j.jhydrol.2012.05.019 [ Links ]
KHAN S, MUSHTAQ S, HANJRA M and SCHAEFFER J (2008) Estimating potential costs and gains from an aquifer storage and recovery program in Australia. Agric. Water Manage. 95 477-488. https://doi.org/10.1016/j.agwat.2007.12.002 [ Links ]
KREAMER SR, HAITJEMA HM and KELSON VM (2007) Working with WHAEM200: capture zone delineation for a city wellfield in a valley fill glacial outwash aquifer supporting wellhead protection. Report to EPA/600/R-05/151, July 2007, Office of Research and Development. US Environmental Protection Agency, Washington, DC. [ Links ]
MULLER J and BOTHA JF (1986) A preliminary investigation of modelling the Atlantis Aquifer. WRC Report No. 113/1/87. Water Research Commission, Pretoria. [ Links ]
NHAM HTT, GRESKOWIAK J, NODLER K, RAHMAN MA, SPACHOS T, RUSTEBERG B, MASSMANN G, SAUTER M and LICHA T (2015) Modeling the transport behavior of 16 emerging organic contaminants during soil aquifer treatment. Sci. Total Environ. 514 450-458. https://doi.org/10.1016/j.scitotenv.2015.01.096 [ Links ]
PARKHURST DL and APPELO CAJ (1999) User's guide to PHREEQC (version 2) - A computer program for speciation, batch-reaction, one-dimensional transport, and inverse geochemical calculations. Water-Resources Investigations Report No. 99-4259. US Geological Survey, Denver, Colorado. [ Links ]
PARSONS R (1991) Investigation of industrial effluent recharge characteristics at a test site near the Atlantis coastal recharge basins. Report No. 14/91. CSIR Groundwater Programme, Stellenbosch. [ Links ]
PETTENATI M, PICOT-COLBEAUX G, THIERY D, BOISSON A, ALAZARD M, PERRIN J, DEWANDEL B, MARECHAL J-C, AHMED S and KLOPPMANN W (2014) Water quality evolution during managed aquifer recharge (MAR) in Indian crystalline basement aquifers: reactive transport modeling in the critical zone. Procedia Earth Planet. Sci. 10 82-87. https://doi.org/10.1016/j.proeps.2014.08.016 [ Links ]
RAHMAN MA, RUSTEBERG B, UDDIN MS, LUTZ A, SAADA MA and SAUTER M (2013) An integrated study of spatial multicriteria analysis and mathematical modelling for managed aquifer recharge site suitability mapping and site ranking at Northern Gaza coastal aquifer. J. Environ. Manage. 124 25-39. https://doi.org/10.1016/j.jenvman.2013.03.023 [ Links ]
SABS (South African Bureau of Standards) (2011) SANS241:1 South African National Standard, Drinking water, microbial, physical, aesthetic and chemical determinants. SABS, South Africa. ISBN: 978-0-626-26115-3. [ Links ]
SWS (2013) Visual Modflow Flex. URL: https://www.swstechnology.com/groundwater-modeling-software/visual-modflow-flex (Accessed 15 March 2013). [ Links ]
TOZE S and BEKELE E (2009) Determining requirements for managed aquifer recharge in Western Australia. Water for a Healthy Country National Research Flagship. CSIRO, Canberra. [ Links ]
TREDOUX G, WEAVER JMC, HON A, ENGELBRECHT JFP, CONRAD J and DE WET G (1998) Atlantis Water Conservation Programme: Watering systems. Phase 1: Source identification and policy development. Report No. ENV/S-C 98043, CSIR Environmentek, Stellenbosch. [ Links ]
TREDOUX G, BUGAN R AND ISRAEL S (2013) Decomissioning of the Atlantis historic landfill: geohydrological report. Report No. ECHS025-1. CSIR Natural Resources and Environment, Stellenbosch, South Africa. [ Links ]
VANDENBOHEDE A and VAN HOUTTE E (2012) Heat transport and temperature distribution during managed artificial recharge with surface ponds. J. Hydrol. 472-473 77-89. https://doi.org/10.1016/j.jhydrol.2012.09.028 [ Links ]
VAN DER MERWE AJ (1983) Exploration, exploitation and evaluation of groundwater in the sand deposits in the Atlantis area for water supply to the Atlantis Growth Point (in Afrikaans). MSc thesis, University of the Free State, Bloemfontein. [ Links ]
WATERLOO HYDROGEOLOGIC (2015) Visual MODFLOW 2011.1 User's Manual. URL: http://trials.swstechnology.com/software/Visual_MODFLOW/2011/Manuals_and_Guides/VMOD-2011.1_Manual.pdf (Accessed 1 December 2015). [ Links ]
XU T, SONNENTHAL EL, SPYCHER N and PRUESS K (2006) TOUGHREACT - a simulation program for non-isothermal multiphase reactive geochemical transport in variably saturated geologic media: applications to geothermal injectivity and CO2 geological sequestration. Comput. Geosci. 32 (2) 145-165. https://doi.org/10.1016/j.cageo.2005.06.014 [ Links ]
ZHANG W, HUAN Y, YU X, LIU D and ZHOU J (2015) Multi-component transport and transformation in deep confined aquifer during groundwater artificial recharge. J. Environ. Manage. 152 109-119. https://doi.org/10.1016/j.jenvman.2015.01.027 [ Links ]
ZHANG J, VAN DER VOORT I, WEAVER J and TREDOUX G (2001) Numerical models for the Atlantis Aquifer. Report No. ENV-S-I 2001-10/. CSIR Environmentek, Stellenbosch. [ Links ]
ZHENG C and WANG PP (1999) MT3DMS: A modular three-dimensional multi-species model for simulation of advection, dispersion and chemical reactions of contaminants in groundwater systems: Documentation and user's guide. SERDP-99-1. US Army Engineer Research and Development Centre, Vicksburg, MS. [ Links ]
Received: 31 January 2016
Accepted in revised form: 5 January 2017
* To whom all correspondence should be addressed. Tel: +27 21 888 2506; Fax: +27 21 888 2682; e-mail: njovanovic@csir.co.za

