


Services on Demand
Article
 English (pdf)
 Article in xml format
 Article references
Indicators

Related links
-
 Cited by Google
 -
 Similars in Google
Share

 Permalink
Water SA
On-line version ISSN 1816-7950
Print version ISSN 0378-4738
Water SA vol.43 n.1 Pretoria Jan. 2017
http://dx.doi.org/10.4314/wsa.v43i1.10
The occurrence and removal of algae (including cyanobacteria) and their related organic compounds from source water in Vaalkop Dam with conventional and advanced drinking water treatment processes
A SwanepoelI, *; HH Du PreezI, II; N CloeteII, III
IRand Water, Analytical Services, Vereeniging, 1930, South Africa
IIDept of Zoology, University of Johannesburg, Auckland Park, 2006, South Africa
IIIScientific Aquatic Services, 91 Geldenhuis Road, Malvern East Ext 1, 2007, South Africa
ABSTRACT
Cyanobacterial bloom formation in freshwaters, such as rivers, lakes and dams, is known to occur throughout the world. The Vaalkop Dam, which serves as source to the Vaalkop drinking water treatment works (DWTW), is no exception. Blooms of cyanobacteria occur annually in Vaalkop Dam as well as in dams from which Vaalkop is replenished during low-rainfall periods. These blooms during the summer months are associated with the production of cyanotoxins and taste and odour compounds such as geosmin and MIB. The Vaalkop DWTW uses a combination of conventional and advanced water treatment processes to deal with the cyanobacteria and their related organic compounds in the source water. The overall objectives of this study were to: (i) investigate the occurrence of algae (including cyanobacteria) and cyanotoxins in the Vaalkop Dam; (ii) establish which environmental variables are responsible for the development and onset of algae, and (iii) determine whether the Vaalkop DWTW is able to eliminate the influence that algae (including cyanobacteria) may have on the drinking water. Multivariate statistical analyses revealed seasonal variation in algal assemblages in the raw water. The risk of cyanobacteria bloom formation proved to be especially high during the summer months as the nutrients needed for cyanobacterial growth are available and the temperature range is optimal, causing the production of geosmin, MIB and microcystin. The presence of Ceratium hirundinella (O.F. Müller) Dujardin, in the source water appears to exacerbate the negative effect that cyanobacteria have on the drinking water treatment process. When Ceratium hirundinella is present, floc formation is inhibited, causing more of the problematic algae to penetrate into the drinking water. Even though advanced treatment options such as ozone and granular activated carbon filters are used at Vaalkop DWTW, the effects of the organic compounds produced by cyanobacteria are not entirely eliminated during the treatment process.
Keywords: potable water treatment, geosmin, MIB (2-methylisoborneol), microcystin, granular activated carbon (GAC), ozone
INTRODUCTION
Human influences due to anthropogenic activities (which include agricultural, social and economic activities) have increased the rate of eutrophication of source waters due for drinking water treatment (Strydom and King, 2009). Nutrient enrichment (e.g. by ammonia, nitrates and phosphates) of water bodies results in the stimulation of changes such as the increased production of algae (including cyanobacteria), aquatic macro-phytes, deterioration of water quality and other undesirable factors which render the water bodies unsuitable for use in drinking water treatment (Hart, 2006). Extensive growth of cyanobacteria in reservoirs or dams used as sources for potable water production can create severe problems such as ineffective coagulation, flocculation and sedimentation (Ewerts et al., 2013), clogging of sand filters (Steynberg et al., 1998), penetration of algae into the final treated water (Swanepoel, 2015), increase of organic loading in water (Ferreira and Du Preez, 2012) and the production and release of cyanotoxins as well as taste and odour compounds (Oberholster et al., 2005; Du Preez and Van Baalen, 2006; Du Preez et al., 2007; Swanepoel, 2015). These problems in the purification process may then lead to undesirable cyanotoxins as well as taste and odour compounds in the drinking water. The cyanotoxins produced by certain cyanobacteria, such as Microcystis aeruginosa ((Kützing) Kützingand), Cylindrospermopsis racibor-skii ((Woloszynska) Seenayya & Subba Raju), Oscillatoria sim-plicissima (Gomont) and Anabaena circinalis (Dolichospermum sigmoideum (Nygaard) Wacklin, L.Hoffmann & Komárek), are a human health risk (WHO, 1999) and therefore the removal capacity for these cyanobacteria and especially the cyanotoxins produced by them is of utmost importance to the consumers of drinking water.
Cyanobacteria and cyanobacterial blooms are known to occur widely in South Africa. Cylindrospermopsis sp. was identified as the causing of one of the major bloom events to have occurred in the Orange River (Van Ginkel and Conradie, 2001). Microcystis aeruginosa blooms are a regular occurrence in the Hartbeespoort Dam (Van Ginkel, 2008), which also supplies water to the Vaalkop Dam via the Roodekopjes Dam. The Vaalkop Dam also receives water from the Bospoort Dam which, prior to 2005, was known to be the greenest dam in its region (Van der Walt et al., 2006). Since cyanobacteria require light for growth, they are more likely to be found in surface waters, but they may also be transported into groundwater (Falconer, 2005).
Cyanobacteria produce numerous types of cyanotoxins. The cyanotoxins are produced and contained within growing cyanobacterial cells. Generally, the release of cyanotoxins occurs during cell death and lysis; however, some types of cyanobac-teria release cyanotoxins during growth phases. Research into the frequency and effects of these toxins is ongoing. However, it is generally thought that microcystin-LR is the most frequent and probably most toxic of the microcystins (Du Preez et al., 2007; Kankeu et al., 2008). Due to the human health effects of these toxins, and the possible exposure of humans via potable water, concentration standards or guideline levels for the detection of microcystins have been incorporated in the drinking water regulations in Australia, New Zealand, Brazil, Canada and the European Union, to name but a few. In South Africa, water quality criteria are stipulated by the South African National Standard: Drinking Water (SANS 241, 2015), which also stipulates the guideline limits for cyanotoxin (total microcystins) in potable water.
Cyanobacteria not only produce cyanotoxins but also taste and odour compounds such as geosmin and 2-methylisobor-neol (MIB). The following cyanobacteria genera are known to produce taste and odour compounds as well as cyanotoxins: Anabaena sp., Aphanizomenon sp., Lyngbya sp., Microcystis sp., Oscillatoria sp. and Phormidium sp. (WHO, 1999).
The ideal treatment for cyanobacteria would be the removal of cyanobacterial cells without causing the release of toxins and other organic compounds. Once toxins (especially neurotoxins) are released, advanced treatment options are needed to remove soluble toxins from the water (AWWA, 2004). Studies have been done on the removal capabilities of various treatment processes. Some of these processes are effective at removing the cyanobacteria, but not the extracellular cyanotoxins. Two of the typical advanced treatment processes that are used are activated carbon [powdered activated carbon (PAC) and/or granular activated carbon (GAC)]; and ozone (Hitzfeld et al., 2000; Westrick, 2008).
Drinking water authorities are frequently faced with the challenge of treating contaminated water. In many instances, drinking water treatment works (DWTW) do not have skilled personnel able to develop monitoring programmes and protocols for cyanobacteria toxin levels in order to avoid exposure of consumers (Van Ginkel, 2004; Newcombe et al., 2010). In view of this skills challenge, and to assist the producers of potable water, a management framework or guideline document has been developed for drinking water suppliers in South Africa, describing how to pro-actively deal with cyanobacteria and their toxins in water sources. This guideline document uses an alert level framework to ensure safe drinking water for consumers in South Africa and elsewhere (DWAF, 2005; Du Preez et al., 2007).
The water abstracted from the Vaalkop Dam is treated at the Vaalkop DWTW to produce drinking water. Especially during summer, the water abstracted from the Vaalkop Dam contains high concentrations of cyanobacteria as well as cyanotoxins that need to be removed or treated by the DWTW during drinking water purification.
The objectives of this study were to: (i) investigate the occurrence of algae (including cyanobacteria) and cyanotoxins in the Vaalkop Dam at the point where the source water is abstracted for drinking water purification; (ii) establish which environmental variables play a role in the development and onset of algal (including cyanobacterial) blooms in Vaalkop Dam, and (iii) determine whether the Vaalkop DWTW, with its advanced treatment processes, is able to eliminate the influence that algae (including cyanobacteria) may have on the drinking water.
MATERIALS AND METHODS
Study area
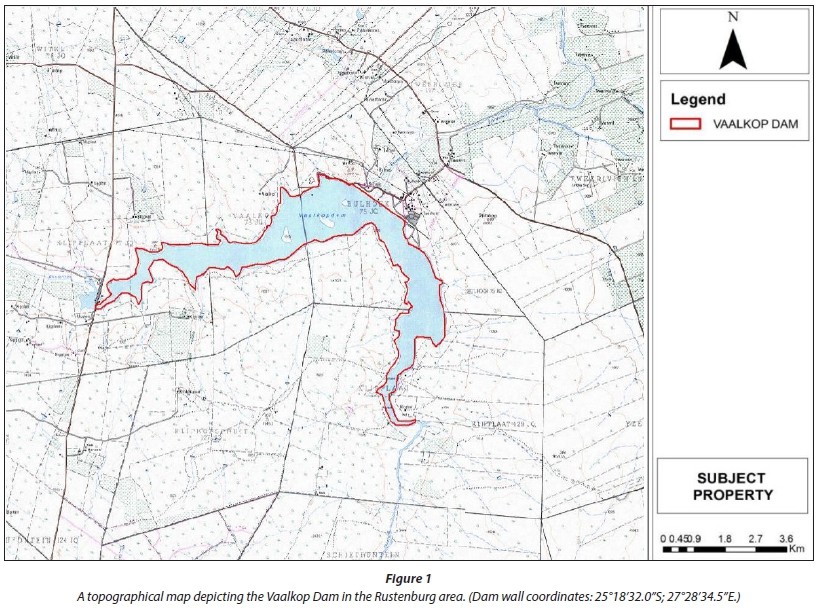
The Vaalkop Dam is situated between Brits and Pilanesberg in the North West Province of South Africa. The Vaalkop Dam is located in Bushveld Basin Aquatic Ecoregion and lies on the Elands River and Hex River, forming part of the Crocodile River basin. It forms part of a nature reserve and, at full capacity, has a surface area of approximately 1 110 ha and a depth of 11.4 m at the dam wall (Vaalkop Dam, 2012).
The dam is an attractive site for angling, boating and bird watching. However, commercial farming is practised in the vicinity of Vaalkop Dam and fertilizers may contribute to eutrophication and the formation of algal blooms. Furthermore, pesticides used by farmers in the vicinity of the dam may act as endocrine disruptors (Venter, 2009). According to the Vaalkop Dam: Species Diversity Report (Venter, 2009), the water quality in the Hex River side of the dam is poor. The inflow of chemically-enriched water through the channel from Roodekopjes Dam also contributes to poor water quality in the Vaalkop Dam. In South Africa there are practically no freshwater lakes, but the high demand for water, and the erratic flow of most South African rivers, has led to the creation of artificial lakes and dams on all of the major rivers, in order to stabilise flow and therefore guarantee year-round water supply. Exploitable water supplies in South Africa include rivers, artificial lakes and dams, as well as groundwater. Vaalkop Dam is used as source for the Vaalkop DWTW located on the banks of the dam (Fig. 1).
Sampling at Vaalkop DWTW
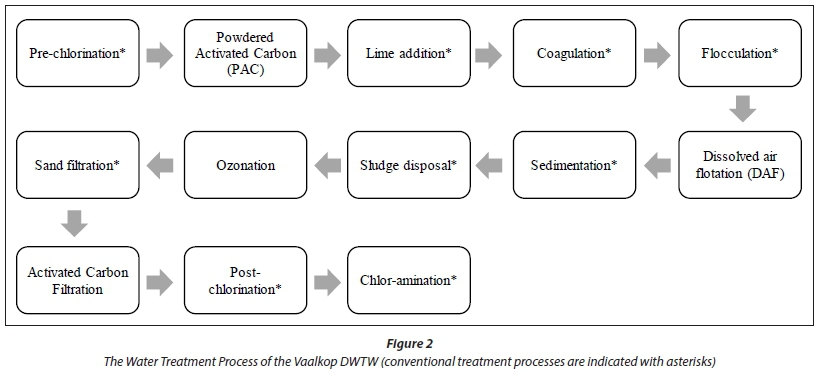
Water purification at the Vaalkop DWTW involves the processes as indicated in Fig. 2 (Magalies Water, 2009). All conventional drinking water treatment processes are indicated with an asterisk (*).
Source water (raw water) samples were collected from the Vaalkop Dam intake (which is 11.4 m deep at 100% capacity) at 30 cm below the surface (GPS coordinates 25°18'32.0"S, 27°28'34.5"E) and potable water samples were collected from the Vaalkop DWTW after purification at a tap specially installed for sampling (GPS coordinates: 25°18'33.74", S 27°29'10.56"E).
Physical, chemical and biological analyses of water samples
Sampling at the two selected sampling sites was undertaken twice a month from October 2005 to June 2011. The analyses (physical, chemical and biological) were performed in the laboratories of Rand Water Analytical Services (Laboratory number: T0046), which is a laboratory accredited by SANAS (South African National Accreditation System). The data used in this study were all generated by SANAS-accredited methods. Metals were all determined simultaneously with the multi-element ICPMS (inductively coupled plasma mass spectrometry) method, according to Standard Methods (APHA, 2013). The anions NO2- and NO3- (both measured as mg-L-1 N) were determined by ion chromatography by means of the Metrohm 761 Compact IC-System according to Standard Methods (APHA, 2013).
Ammonium (NH4+, measured as mg-L-1 N) and orthophosphate (PO43-, measured as mg-L-1 P) were determined by an Aquakem automated colorimetric analysis system, according to Standard Methods (APHA, 2013). Alkalinity was determined by means of titration according to Standard Methods (APHA, 2013). Chlorophyll-665 (total photosynthetic pigments concentration) was determined spectrophotometrically according to Swanepoel et al. (2008). Due to the fact that the chlorophyll-a (Chl-a) concentration in drinking water is too low to determine accurately (Swanepoel et al., 2008), the chlorophyll-665 method is usually performed at DWTW to determine the extent of algal penetration into drinking water. The chlorophyll-665 method, originally described by Steynberg (1986), has a linear relationship of 'Chl-665 = Chl-a * 1.24 (R2 = 0.75; P < 0.0001; r = 0.86)' to chlorophyll-α (Swanepoel, 2015). Phytoplankton samples were preserved with Lugols solution and pressure deflated using a specially designed mechanical hammer that exerts a pressure of 49.5 kPa on the sample (Walsby 1971, 1994). The sample was then homogenised at 13 000 r-min-1 for ± 15 s, after which 3 mL of sample was pipetted into a sedimentation chamber. The sedimentation chambers were then centrifuged for 10 min at 3 500 r-min-1 to allow algal cells to settle to the bottom. After settling, all algal cells were identified (using identification keys provided by Prescott, 1951 and Ling and Tyler, 2000) and enumerated with an inverted light microscope using the technique described by Lund et al. (1958) and adapted for Rand Water by Swanepoel et al. (2008). One of the eyepieces of the microscope contains a Whipple grid to delineate the counting area (called a 'field'). The glass bottoms of the sedimentation chambers were examined in 'fields' covering most parts of the sedimentation chamber, while counting all algal cells inside the 'field'. The original sub-sample volume that was transferred to the sedimentation chamber, the area of the sedimentation chamber, and the area of a 'field' as well as the number of 'fields' counted were used to calculate the concentration of individual algae genera as cells per millilitre (cells-mL-1). Geosmin and 2-methylisoborneol (MIB) were extracted using solid phase extraction and quantified by means of the gas chromatography-mass spectrometry (GCMS) method based on Standard Methods (APHA, 2013) and adapted for the laboratory according to Swanepoel et al. (2008). The concentration of the cyanotoxin, microcystin (total microcystin), was determined by means of the enzyme linked immuno sorbent assay (ELISA) technique, also described by Swanepoel et al., (2008), using Envirologix ELISA kits (Envirologix, 2013).
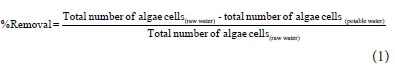
Percentage removal of algae cells during drinking water treatment
The percentage removal of algae during the drinking water treatment process at Vaalkop during the study period was determined using the following formula:
Statistical analysis
The results from the analyses were used in different multivariate analyses, by making use of the software package CANOCO version 4.55 for Windows. To determine the main environmental drivers of cyanobacteria in the Vaalkop Dam, 5 years of physical, chemical and biological data from Vaalkop Dam were used. Data represents samples taken twice a month from October 2005 to June 2011 at the Vaalkop intake tower.
Two principal component analyses (PCAs) were performed with the raw water data. Firstly, all of the data were included in the PCA, which enabled the identification of principal components (representative of each corresponding group of variables). Principal components were used and the rest of the variables omitted in subsequent multivariate analyses, to reduce the inflationary effect that variables have upon each other. Although geosmin, microcystin and chlorophyll-665 cannot be regarded as environmental variables, they were included in the PCA to determine their positions on the ordination diagram and to illus trate the effect of all of the environmental variables on the total algae and their related organic compounds.
CCA's (canonical correspondence analyses) were performed on the environmental variables together with the log-transformed algae data. Log transformation was done to obtain the appropriate gradient length of the algae classes in the environmental space. Two CCAs were performed to reflect (i) the relationship between the major algal classes and environmental variables and (ii) between the major algal genera and environmental variables found in the raw water at Vaalkop during the study period. This multivariate analysis method (CCA) was used because of the great variation found in the algal genera and classes data (Ter Braak and Prentice, 1988). The ordinations of the PCAs and CCAs were graphically illustrated in CanoDraw 4.1.4 for Windows (Ter Braak and Smilauer, 2002).
RESULTS AND DISCUSSION
Assessment of the raw water from the Vaalkop Dam
The Cyanophyceae occurring from the highest to the lowest concentrations (total number of cells-mL-1 during the study period) were Cylindrospermopsis raciborskii, Oscillatoria simplicissima, Microcystis aeruginosa, Anabaena circinalis and Pseudanabaena sp. The Dinophyceae mostly consisted of Ceratium hirundinella (O.F. Müller) Dujardin. The Bacillariophyceae mostly consisted of the filamentous Aulacoseira granulata ((Ehrenberg) Simonsen), the centric diatom, Cyclotella meneghiniana (Kützing), as well as a variety of pennate diatoms. The Chlorophyceae was the richest in species diversity and consisted of (from the highest to the lowest total number of cells-mL-1 during the study period) Pediastrum simplex (Meyen), Scenedesmus opoliensis (P.G.Richter), Pediastrum duplex (Meyen), Scenedesmus acuminatus ((Lagerheim) Chodat), Chlamydomonas incerta (Pascher), Pandorina morum ((O.F. Müller) Bory), Scenedesmus quadricauda ((Turpin) Brébisson), Coelastrum pseudomicroporum (Korshikov), Monoraphidium circinale ((Nygaard) Nygaard), Oocystis lacustris (Chodat), Monoraphidium arcuatum ((Korshikov) Hindák), Coccomonas sp., Pediastrum tetras ((Ehrenberg) Ralfs), Sphaerocystis sp. and Tetraedron mediocris (Hindák).
The Cryptophyceae mostly consisted of Cryptomonas spp., and the Euglenophyceae, Trachelomonas and Euglena spp. Chrysophyceae (mostly only Mallomonas sp.) occurred very infrequently and in low concentrations.
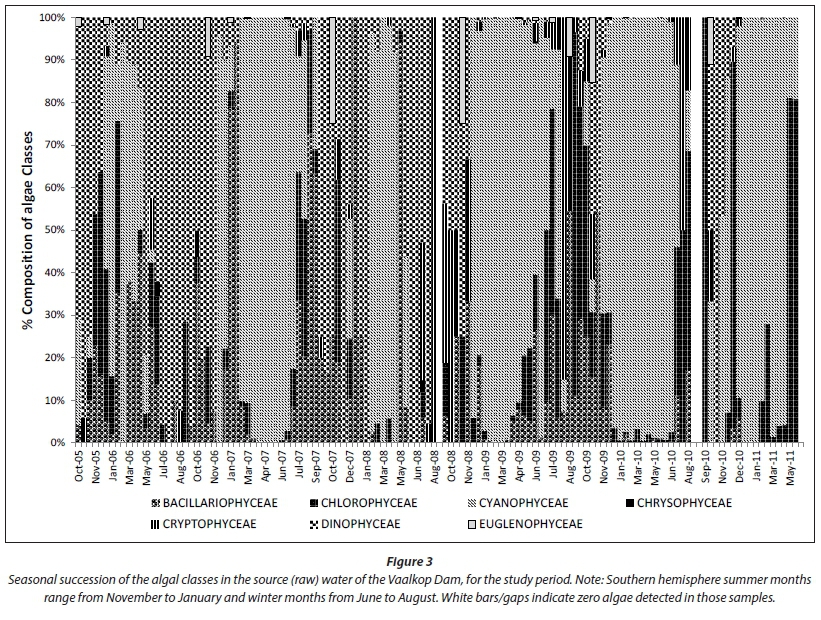
The percentage composition of algal classes in the source (raw) water (Fig. 3) shows a distinctive seasonal trend, as was expected. As in the case of other studies (Palmer, 1980; Janse van Vuuren and Pieterse, 2005; Du Preez and Van Baalen, 2006; Swanepoel, 2015), Cyanophyceae is dominant during the warmer summer and autumn months (November to May) and alternated with dinoflagellates and diatoms and to a lesser extent Cryptophyceae during the colder winter months (June to August).
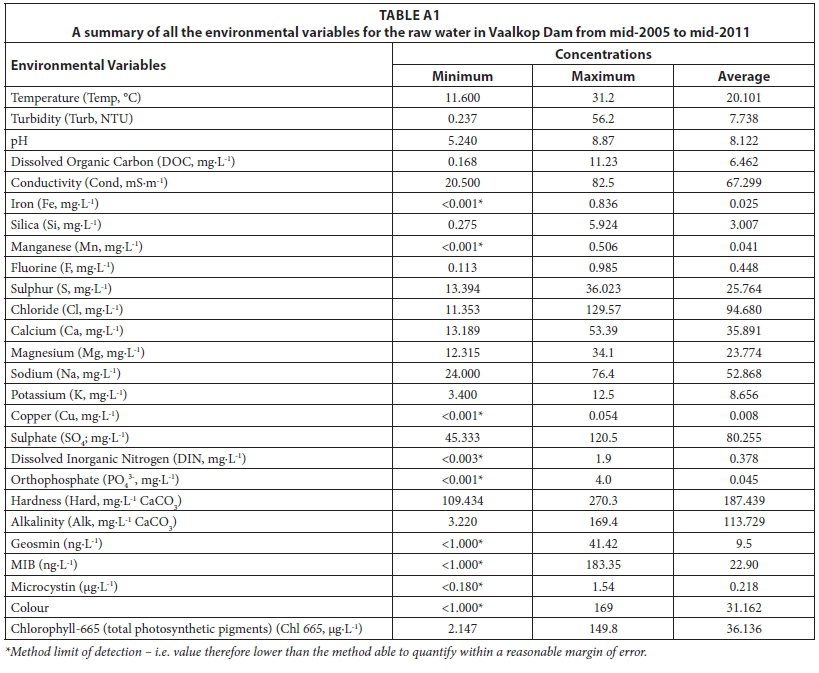
In the Appendix, a summary of the concentrations of all of the environmental variables in the raw water that were used during the data analysis is summarised in Table A1. The minimum, maximum and average concentrations were determined to give an overview of the ranges over which variables occur in Vaalkop Dam.
The final principal components analysis (PCA) (after the inflating veriables were removed, as described in the materials and methods section) is displayed in Fig. 4.

In the PCA ordination of the principal components of the RAW_VAALKOP data (Fig. 4), 35% of the variance in environmental components could be explained on the first two canonical axes (Table 1).

A negative relationship exists between microcystin and pH. Microcystin is the most common cyanobacterial toxin found in blooms from fresh and brackish water. Microcystin correlated positively with DIN, indicating that the production of algal toxins is stimulated with high concentrations of DIN (NO2- + NO3- + NH4+). It is also possible that the positive correlation between microcystin and DIN indicates that toxin-producing cyanobacteria strains are favoured to develop during times of high DIN concentrations. Nitrogen can occur in several forms in surface water, namely, ammonium, nitrite, nitrate, urea and nitrogen gas (Herrero et al., 2001). Most of the algae can utilise the first four forms of nitrogen, but nitrogen gas can only be utilised by certain species of cyanobacteria such as Anabaena sp. (Walmsley, 2000). Nitrogen plays a secondary role to phosphate in terms of sustaining cyanobacteria, but occurs at high levels of eutrophication when nitrogen-fixing cyanobacteria such as Anabaena sp. and Cylindrospermopsis sp. grow more vigorously than other algal species (Korselman and Meuleman, 1996). Thus high concentrations of nitrates will favour algae blooms during eutrophication.
The PCA of the raw water samples from the Vaalkop Dam (Fig. 4) indicated that during periods of high temperatures the phosphate, manganese and geosmin concentrations are high. Cyanobacteria can be controlled by controlling the phosphate levels in the water. Thus, should the phosphate levels increase, the magnitude of cyanobacterial blooms is likely to be greater (Chorus and Bartram, 1999). Other sources of phosphate can include agricultural fertilisers which, due to erosion from heavy rainfall, are released from the sediments into surface water. It can also be concluded from Fig. 4 that geosmin production, an organic compound produced by cyanobacteria, is stimulated with high temperatures and high phosphate concentrations but has a negative correlation with chlorophyll-665. This indicates that high chlorophyll concentrations are most probably due to algal species not producing geosmin, such as the large-celled dinoflagellate, Ceratium hirundinella.
Table 2 indicates that although the first two canonical axes (represented in Fig. 5) explained only a total of 13% of the variance within the algal data itself, it explained 89% of the variance in the algae-environment relationship.


The most important environmental variables influencing the growth of algae are light, temperature and nutrient availability (Janse van Vuuren and Pieterse, 2005). A positive relationship was found between temperature, turbidity, conductivity and Cyanophyceae, indicating that these organisms were favoured by warm water conditions. It is known from many studies (e.g. Palmer, 1980; Janse van Vuuren and Pieterse, 2005; Du Preez and Van Baalen, 2006; Swanepoel, 2015) that Cyanophyceae usually form blooms during periods of high temperature. According to Janse van Vuuren and Pieterse (2005), Cyanophyceae tend to separate from other algal classes by preferring high water temperatures (higher than 20°C) (Harding and Paxton, 2001) and high turbidity. The Crysophyceae, Dinophyceae and Bacillariophyceae (diatoms), on the other hand, tend to reach higher concentrations in water with lower temperatures (less than 15°C) (Pieterse and Janse van Vuuren, 1997), as they correlate negatively with temperature (Fig. 5).
The positive relationship found between diatoms and silica indicate that Bacillariophyceae (diatoms) will be stimulated during high silica concentrations. Since Pieterse and Janse van Vuuren (1997), found a negative relationship between silica and diatoms, and attributed it to diatom utlisation, this positive correlation between Bacillariophyceae and silica possibly indicates an over-abundance of silica for the utilisation by Bacillariophyceae in Vaalkop Dam.
Bacillariophyceae, Chlorophyceae, Cryptophyceae and Euglenophyceae were usually present during high DIN and high sulphate concentrations, and seem to result in low chlorophyll concentrations. From Table 3 it is evident that the CCA analysis was not statistically significant as judged on the basis of the Monte Carlo Permutation test (499 random permutations).
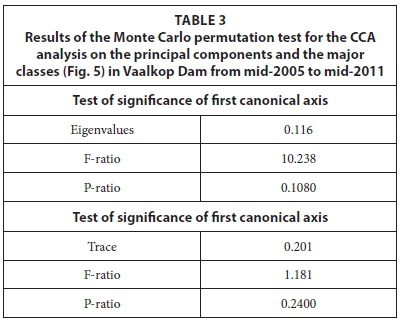
Therefore the second CCA (Fig. 6) was performed to reflect the relationship between the algal species and environmental data found at sampling point RAW_VAALKOP from mid 2005 to mid 2011.

The first two canonical axes, represented in Fig. 6, explained a total of 15% of the variance within the algal data, and a total of 71% of the variance in the algae-environmental relationship (Table 4).

From Fig. 6, a positive correlation was found between temperature, silica and the algae species Anabaena sp., Ceratium sp., Pediastrum duplex, Pediastrum simplex and Oscillatoria sp. These algal species seem to be related to low pH and low alkalinity events. Cylindrospermopsis sp. showed a positive correlation with high phosphates. Cylindrospermopsis may occur with other cyanobacterium species, like Microcystis and Anabaena, when they produce microcystin. Most of the algae species identified showed a negative correlation with turbidity. Turbidity indicates the clarity of water and is mainly influenced by different concentrations of particulate material such as silt or algae in the water. During summer, the rainy season contributes to an increase in particulate material in runoff into the river and turbidity increases. High turbidity values will often suppress algal growth by limiting underwater light availability (Pieterse and Janse van Vuuren, 1997).
From Table 5, it is evident that this CCA analysis (Fig. 6) was statistically significant (P < 0.05) as judged on the basis of the Monte Carlo permutation test (499 random permutations). Thus, there is a statistically significant relationship between the environmental components and the algal species.

Assessment of the potable water from the Vaalkop Water Treatment Plant
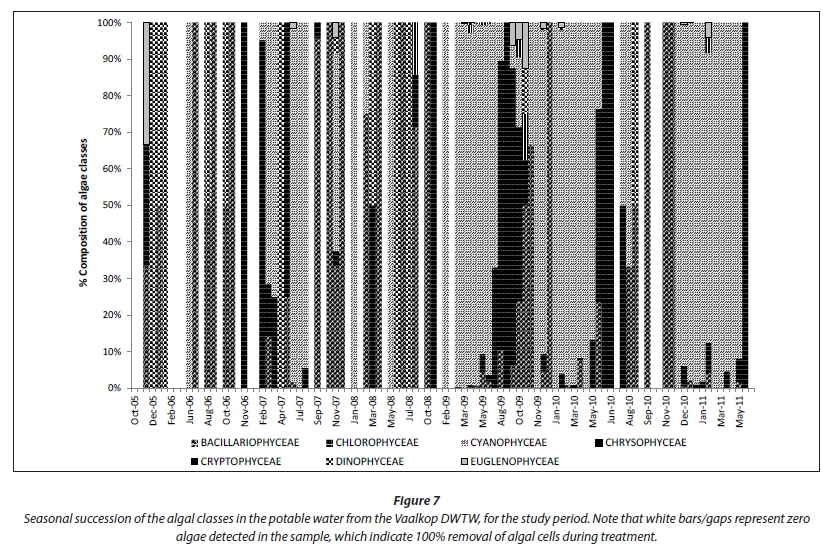
The number of algal cells in the Vaalkop Dam was reduced from an average of 30 324 cells-mL-1 in the raw water, to an average of 222 cells-mL-1 in the potable water (Fig. 7) after treatment at the Vaalkop DWTW.
The composition of algae in the potable water still reflects the composition of algae groups in the raw water to a certain extent (Fig. 7), where Cyanophyceae is still dominant in the potable water during the warmer summer months with dinoflagellates (Dinophyceae), diatoms (Bacillariophyceae) and green algae (Chlorophyceae) dominant during the cooler seasons (refer also to Fig. 3). Cryptophyceae and Chrysophyceae seem to have been removed very well during the drinking water treatment process, since they are practically absent in the drinking water, even though they were present in low concentrations in the source water.
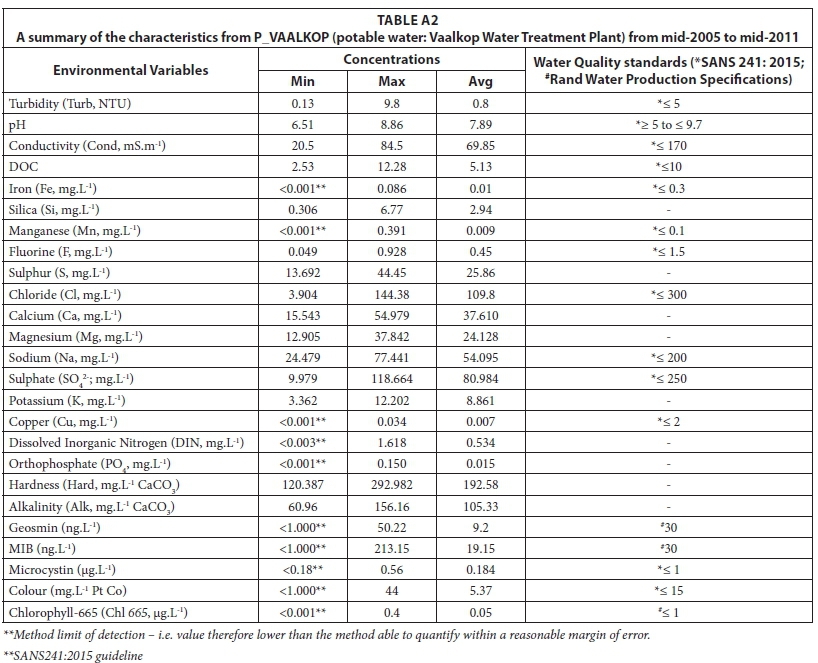
Table A2 (Appendix) provides a summary (minimum, maximum and average) of the concentrations of all of the variables in the potable water after treatment at the Vaalkop DWTW
The maximum turbidity (9.8 NTU) was higher that the recommended guideline (< 5 NTU). Relatively high values occurred within the summer and early autumn months (January - April). The maximum manganese levels in the potable water were also higher than the standards, where a chronic health level was reached at the start of a period of high temperatures leading into the mid-summer months, most probably due to mining activity in the vicinity of the Vaalkop Dam. The measurements for colour also exceeded the maximum allowable limit of < 15 mg-L-1 Pt Co. The rest of the variables all fell within the desired ranges of the SANS 241 (2015) standards.
Figure 8 displays the percentage removal of algae from the raw water to the potable water. The percentage removal at the Vaalkop DWTW ranged from 56% to 100% removal. It is evident that the presence of Ceratium hirundinella was the main cause of poor removal (< 80%) during potable water treatment (Fig. 8). This ineffective removal of algae cells when high concentrations of Ceratium hirundinella cells occur in the source water has also been observed by Ewerts et al., (2013). The large and motile Ceratium hirundinella is known to interfere with coagulation and flocculation by disrupting the attraction forces at work during coagulation, (Ewerts et al., 2014), causing the flocs to become unstable and ultimately facilitating that more algae and particu-late matter avoid the sedimentation process. Although Ceratium hirundinella is mostly dominant in the raw water during incidents of poor percentage removal, it is usually not dominant in the potable water (Fig. 8), indicating that Ceratium cells are removed effectively but are the cause of smaller cells (e.g. centric diatoms, Cylindrospermopsis raciborskii, Merismopedia sp., Staurastrum tetracerum and others) penetrating into the potable water (Figs 8 and 9).
The total number of algal cells in the raw and potable water during the study period are displayed in Fig. 9. Note that the potable water is displayed on the secondary Y-axis, at much lower concentrations than in the raw water. High algal concentrations in the raw water (> 100 000 cells-mL-1), usually result in high algal concentrations (> 1 000 cells-mL-1) penetrating into the potable water (Fig. 9). Algal concentrations in excess of 100 000 cells-mL-1 are usually due to Cylindrospermopsis raciborskii in the raw water at Vaalkop. When high concentrations of Cylindrospermopsis raciborskii occur in the source water this leads to high concentrations of Cylindrospermopsis raciborskii penetrating into the drinking water. This is cause for concern since Cylindrospermopsis raciborskii is known to produce cyano-toxins (Du Preez and Van Baalen, 2007). Fortunately the Vaalkop DWTW employs a variety of treatment options for the removal and oxidation of cyanotoxins (Fig. 2), such as oxidation by ozone (AWWA, 2004) and chlorine (Chorus and Bartram, 1999), as well as adsorption by granular activated carbon filters (AWWA, 2004). The small-celled Merismopedia sp. (Fig. 9) also seem to be penetrating when present in the source water, due to their very small cells that enable them to avoid removal during drinking water treatment.
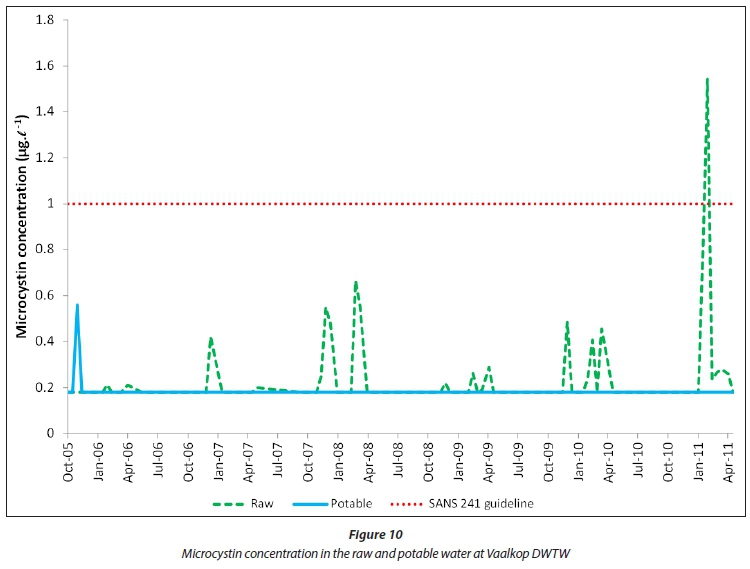
The microcystin concentration (Fig. 10) in Vaalkop raw water was mostly below 1 μg-L1 with the exception of 31 January 2011. During this instance, not only high concentrations of Cylindrospermosis raciborskii were detected, but also high concentrations of Oscillatoria simplicissima, known to produce microcystins (Du Preez and Van Baalen, 2006). Microcystin (Fig. 10) seems to be removed or oxidised during the drinking water treatment process at Vaalkop DWTW, most probably due to oxidation by chlorine during the final disinfection stage (Chorus and Bartram, 1999). All microcystin concentrations in the potable water from Vaalkop Dam were below the allowable 1 μg·L-1 level as prescribed by SANS 241 (2015).
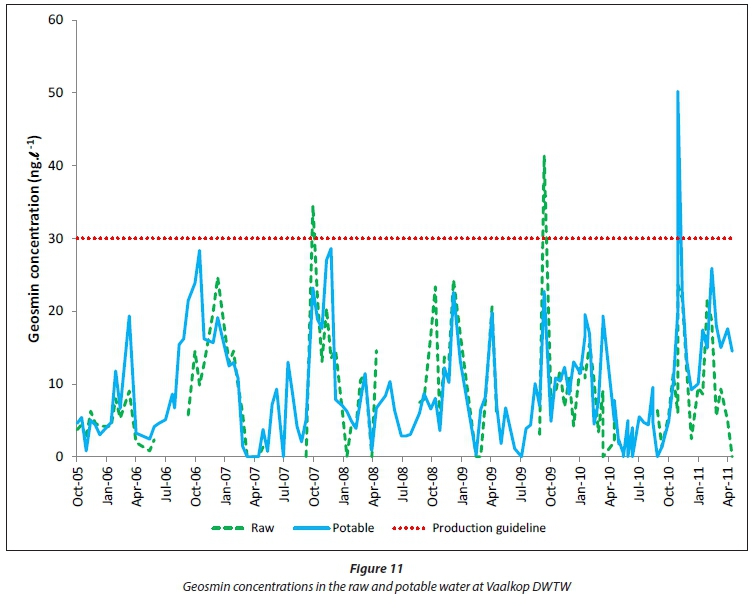
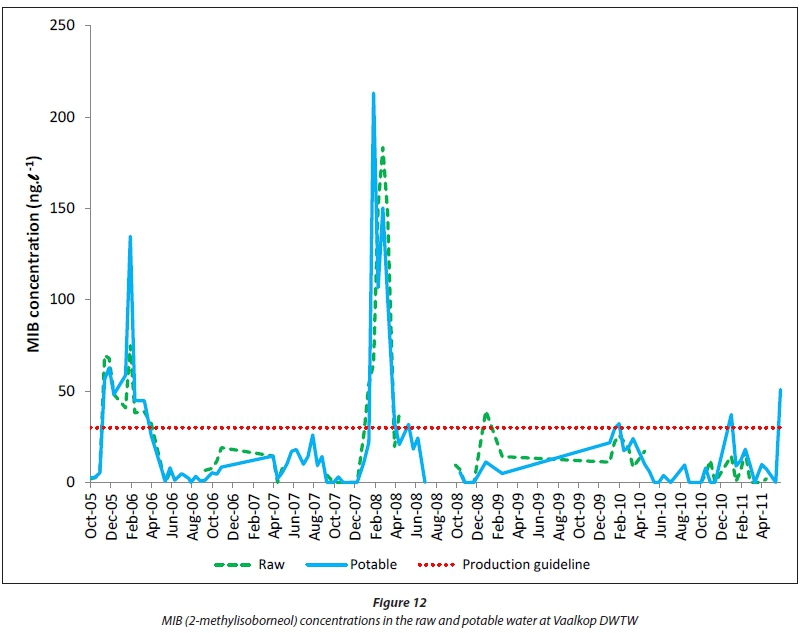
The taste and odour compounds, geosmin and MIB (2-meth-ylisoborneol) (Figs 11 and 12) are not removed or oxidised effectively, not even with all of the different drinking water treatment processes employed at Vaalkop DWTW (Fig. 2). In some instances the potable water shows concentrations of geosmin and MIB higher than in the raw water, most probably due to the lyses of cyanobacterial cells during the treatment process, causing the release of these organic compounds into the drinking water and also because of re-circulation of filter backwash water concentrating organic compounds in the drinking water. Although geosmin and MIB are not at all harmful to the health of consumers, they are notorious for decreasing consumer confidence in tap water (Zoschke et al., 2011), and in the drinking water treatment industry may receive even more attention than cyanotoxins (Swanepoel, 2015).
Geosmin was mostly below the Rand Water production guideline of 30 ng-L-1 (Fig. 11), while MIB (Fig. 12) sporadically exceeded this guideline in the raw and potable water during the study period. Periodic occurrences of geosmin and MIB can be observed in the Vaalkop Dam, where geosmin mostly occured during the period September to December, while MIB mostly occurred during the period December to March. This is most probably due to the succession of cyanobacteria species producing the different organic compounds. In the case of the Vaalkop Dam, geosmin seems to be produced mostly by Anabaena circi-nalis, while the production of MIB is ascribed to the presence of Oscillatoria simplicissima.
CONCLUSIONS
The seasonal variation data from the raw and potable water samples at Vaalkop showed that Cyanophyceae occurred most frequently during summer, and extending into the early autumn months. A positive relationship was found between temperature and Cyanophyceae, indicating that these organisms were favoured by warm water conditions. Cyanophyceae tend to separate from other algal classes by preferring high water temperatures and becoming dominant in the raw and drinking waters at Vaalkop DWTW during summer. Bacillariophyceae (diatoms), on the other hand, tend to reach higher concentrations in water with lower temperatures or winter to early spring months (< 15°C). During winter months a variety of phytoplankton (other than Cyanophyceae) were found to be dominant in the Vaalkop Dam. During 2005-2008, Dinophyceae comprised the largest percentage of these phytoplankton classes during winter. During 2009-2010 Chlorophyceae and Bacillariophyceae comprised the largest percentage in the raw water samples and Chlorophyceae comprised the largest percentage of these phytoplankton classes during winter in the potable water samples.
The most important environmental variables influencing the growth of algae in Vaalkop Dam are light, temperature and nutrient availability. The PCA of the raw water samples from the Vaalkop Dam indicated that during periods of high temperatures, the phosphate, manganese and geosmin concentrations are high. Microcystin correlated positively with DIN, indicating that the production of algal toxins is stimulated with high concentrations of DIN (NO2-, NO3- and NH4+). It is also possible that the positive correlation between microcystin and DIN indicates that toxin-producing cyanobacteria strains are favoured to develop during times of high DIN concentration.
When the results for the potable water were compared to those for the raw water samples, it can be concluded that Cyanophyceae still dominated in the potable water as in the case of the raw water during the summer to early autumn months. When high concentrations of Cyanophyceae (> 100 000 cells-mL-1) occur in the raw water, > 2 000 cells-mL-1 of the same or smaller Cyanophyceae species (e.g. Cylindrospermopsis raciborskii and Merismopedia sp.) penetrate into the drinking water.
The DWTW at Vaalkop was effective in removing algae although it was not 100% at all times. The Vaalkop DWTW was removing most algal cells during periods of moderate to low algal biomass in the raw water; however the % removal was significantly inhibited when Ceratium hirundinella was dominant in the source water. As found by other researchers, Ceratium hirundinella seem to interfere with the coagulation and flocculation unit processes, causing smaller-celled algae to penetrate into the drinking water.
Microcystin, produced by some of the Cyanophyceae species occurring in Vaalkop, such as Microcystis aeruginosa, Anabaena circinalis and Oscillatoria simplicissima, are satisfactorily removed or oxidized during the drinking water treatment process. Geosmin and MIB, on the other hand, are not removed during the drinking water treatment process at Vaalkop and even seem to be increasing in the drinking water due to cell lyses and re-circulation of filter backwash water.
RECOMMENDATIONS
The study indicated that high cyanobacteria concentrations and continuing blooms could be expected in Vaalkop Dam when favourable environmental conditions (nutrient loading and temperature regime) occur. The risk of cyanobacteria bloom formation is especially high during the summer months as the nutrients for cyanobacteria are available and the temperature range is optimal. Geosmin, MIB and microcystin are also produced during the summer months and therefore the management of the Vaalkop DWTW should implement the necessary actions and precautions to ensure that source water with high cyanobacteria concentrations can effectively be treated to reduce the risk of producing drinking water not complying with the potable water quality guidelines and standards.
These actions and precautions may include:
• Manipulating the abstraction level from the Vaalkop Dam (deeper abstraction reduces the cyanobacteria load entering the DWTW)
• Avoiding pre-chlorination during periods of high cyanobac-teria concentrations in the source water, since pre-chlorin-ation is known to lyse cyanobacterial cells resulting in the release of organic compounds into the water
• Avoiding the recirculation of the filter backwash water to head of works
• Optimizing the coagulation and flocculation unit processes by regularly performing jar test experiments (changing the coagulant chemical or the dose concentration)
• Avoiding the use of organic coagulants, as these are usually not as effective as inorganic coagulants (such as lime or lime-silica) in removing algae and cyanobacteria
• Optimizing the DAF process to ensure that algae and cyano-bacterial cells are removed intact before cell lysis occurs and organic compounds are released into the surrounding water
• Removal of scums during DAF frequently and effectively
• Removal of sedimentation sludge frequently and effectively
• Optimizing of ozonation to ensure the effective oxidation of cyanotoxins and taste and odour compounds
• Optimizing the sand filtration process by regularly monitoring turbidity levels in the filter backwash water and adjusting the filtration process accordingly
• Optimizing the filter backwash regime (changing to a double instead of a single backwash cycle) to remove more algae and organic material from the filter beds
• Keeping doors to the filterhouse closed at all times and reducing the illumination to ensure that algae and cyanobac-teria cannot grow in the filters
• Ensuring that the activated carbon in the GAC filters is activated and functioning properly
• Ensuring that the final chlorination step is monitored carefully and executed with precision since microcystins can be oxidised by chlorine
ACKOWLEDGEMENT
SThe authors would like to thank Magalies Water and Rand Water for their continued support of the project.
REFERENCES
AWWA (American Water Works Association) (2004) Algae Detection and Removal Strategies for Drinking Water Treatment Plants. Report number: 90971. AWWA Research Foundation, Denver. 466 pp. [ Links ]
APHA (American Public Health Association) (2013) Standard Methods for the Examination of Water and Waste Water (22nd edn). APHA, Washington DC. 733 pp. [ Links ]
CHORUS I and BARTRAM J (1999) Toxic Cyanobacteria in Water: A guide to their Public Health Consequences, Monitoring and Management. E and FN Spon (on behalf of the World Health Organisation), London. [ Links ]
DWAF (Department of Water Affairs and Forestry, South Africa) (2005) Drinking Water Quality Framework for South Africa. Government Printer, Pretoria. [ Links ]
DU PREEZ HH and VAN BAALEN L (2006) Generic incident management framework for toxic blue-green algal blooms, for application by potable water suppliers. WRC Report No. TT 263/06. Water Research Commission, Pretoria. [ Links ]
DU PREEZ HH, SWANEPOEL A, VAN BAALEN L and OLDEWAGE A (2007) Cyanobacterial incident management frameworks (CIMFS) for application by drinking water suppliers. Water SA 33 643-652. [ Links ]
ENVIROLOGIX QUANTIPLATE KIT FOR MICROCYSTINS (2013) Catalog No.: EP 022, 500 Riverside Industrial Parkway, Portland, ME 04103-1486, USA. 7 pp. [ Links ]
EWERTS H, SWANEPOEL A and DU PREEZ HH (2013) Efficacy of conventional drinking water treatment processes in removing problem-causing phytoplankton and associated organic compounds. Water SA 39 739-749. https://doi.org/10.4314/wsa.v39i5.19 [ Links ]
EWERTS H, BARNARD S, SWANEPOEL A, DU PREEZ HH and JANSE VAN VUUREN S (2014) Strategies of coagulant optimization to improve the removal of turbidity and Ceratium hirundinella cells during conventional drinking water purification. Water Sci. Technol. Water Supply 14 (5) 820-828. https://doi.org/10.2166/ws.2014.038 [ Links ]
FALCONER IR (2005) Cyanobacterial Toxins of Drinking Water Supplies, Cylindrospermopsin and Microcystins. CRC Press, Boca Raton. 296 pp. [ Links ]
FERREIRA L and DU PREEZ HH (2012) Investigation into the occurrence of aquatic invertebrates throughout drinking water purification plants. Water Sci. Technol. Water Supply 12 (2) 250-257. https://doi.org/10.2166/ws.2012.136 [ Links ]
HARDING WR, and PAXTON BR (2001) Cyanobacteria in South Africa: A review. WRC Report No. TT 153/01. Water Research Commission, Pretoria. [ Links ]
HART RC (2006) Food web (bio-)manipulation of South Africa reservoirs - viable eutrophication management prospect or illusory pipe dream? A reflective commentary and position paper. Water SA 32 567-575. [ Links ]
HERRERO A, MURO-PASTOR AM and ENRIQUE F (2001) Nitrogen control in cyanobacteria. J. Bact. 183 (2) 411-425. https://doi.org/10.1128/JB.183.2.411-425.2001 [ Links ]
HITZFELD BC, HOGER SJ and DIETRICH DR (2000) Cyanobacterial toxins: Removal during drinking water treatment and human risk assessment. Environ. Health Perspect. Suppl. 108 (1) 1-17. [ Links ]
JANSE VAN VUUREN S and PIETERSE AJH (2005) The influence of downstream changes in water quality on phytoplankton composition in the Vaal River, South Africa. Afr. J. Aquat. Sci. 30 (1) 11-16. https://doi.org/10.2989/16085910509503829 [ Links ]
KANKEU EF, JAGALS P and DU PREEZ HH (2008) Exposure of rural households to toxic cyanobacteria in container-stored water. Water SA 35 (5) 631-636. [ Links ]
KORSELMAN W, and MEULEMAN AFM (1996) N:P ration and nature of nutrient limitation. J. Appl. Ecol. 33 1441-1450. https://doi.org/10.2307/2404783 [ Links ]
LING HU and TYLER PA (2000) Australian freshwater algae. Gebrüder Borntraeger, D-14129 Berling, Stuttgart. ISBN: 3-443-60032-8. 643 pp. [ Links ]
LUND JWG, KIPLING C and LE CREN ED (1958) The inverted microscope method of estimating algal numbers and the statistical basis of estimations by counting. Hydrobiologia 11 143-170. https://doi.org/10.1007/BF00007865 [ Links ]
MAGALIES WATER (2009) Water purification process. URL: http://www.magalieswater.co.za (Accessed 15 July 2012). [ Links ]
NEWCOMBE G, HOUSE J, HO L, BAKER P and BURCH M (2010) Management strategies for cyanobacteria (blue-green algae): A guide for water utilities. Report No. 74. Water Quality Research Australia Limited, Adelaide. 100 pp. [ Links ]
OBERHOLSTER PJ, BOTHA A and CLOETE TE (2005) An overview of toxic freshwater cyanobacteria in South Africa with special reference to risk, impact and detection by molecular marker tools. Biokemistri 17 (2) 57-71. [ Links ]
PALMER CM (1980) Taste and odour in algae. In: Algae and Water Pollution. Castle House Publications Ltd, Tonbridge, England. ISBN 0-7194-0052-X. 122 pp. [ Links ]
PRESCOTT GW (1951) Algae of the Western Great Lakes area. Fifth Printing (1971). WM. C. Brown Company, Dubuque, Iowa. ISBN: 0-697-04552-8. 977 pp. [ Links ]
PIETERSE AJH and JANSE VAN VUUREN S (1997) An investigation into phytoplankton blooms in the Vaal River and the Environmental variables responsible for their development and decline. WRC Report No. 359/1/97. Water Research Commission, Pretoria. [ Links ]
SOUTH AFRICAN NATIONAL STANDARDS (SANS) 241-1 (2015) Drinking Water: Part 1: Microbiological, Physical, Aesthetic and Chemical Determinands. SABS Standards Division, Pretoria. ISBN: 978-0-626-29841-8. 17 pp. [ Links ]
SOUTH AFRICAN NATIONAL STANDARDS (SANS) 241-2 (2015) Drinking Water: Part 2: Application of SANS 241-1. ISBN 978-0-62631245-9. 49 pp. [ Links ]
STEYNBERG MC (1986) Aspekte van die invloed van eutrofikasie op die Vaalrivierbarrage. Dissertation submitted as fulfilment for the degree, Magister Scientiae in the Faculty of Natural Science, Department of Botany, University of the Free State, South Africa. 52-53. [ Links ]
STEYNBERG MC, ADAM K and PIETERSE AJH (1998) An algal monitoring protocol: The strategic link between reservoir and treatment process. Water Sci. Technol. Reservoir Manage. Water Supply 37 (2) 153-159. [ Links ]
STRYDOM HA and KING ND (2009) Environmental Management in South Africa (2nd edn). Juta Legal and Academic, Cape Town. 1 142 pp. [ Links ]
SWANEPOEL A (2015) Early warning system for the prediction of algal-related impacts on drinking water purification. PhD thesis, North West University, Potchefstroom, South Africa. 152 pp. [ Links ]
SWANEPOEL A, DU PREEZ HH, SCHOEMAN C, JANSE VAN VUUREN S and SUNDRAM A (2008) Condensed laboratory methods for monitoring phytoplankton, including cyanobacteria, in South African freshwaters. WRC Report No. TT 323/08. Water Research Commission, Pretoria. [ Links ]
TER BRAAK CJF and PRENTICE IC (1988) A theory of gradient analysis. Adv. Ecol. Res. 18 271-317. https://doi.org/10.1016/S0065-2504(08)60183-X [ Links ]
TER BRAAK CJF and SMILAUER P (2002) CANOCO reference manual and Canodraw for Windows user's guide: Software for canonical commu nity ordinance (Version 4.5). Microcomputer Power, New York, USA. [ Links ]
VAALKOP DAM (2012) Dam in South Africa, Vaalkop Dam North West Province URL: http://www.ewisa.co.za/misc/DamNWVaalkop (Accessed 24 June 2012). [ Links ]
VAN DER WALT M, MARX C, FOUCHE L, PRETORIUS N and ST ARNAUD J (2006) Turning the sewage tide around - A good news case study about the Hex river catchment. In: Proc. WISA Biennial Conference 2006, 8-11 May 2006, Durban. [ Links ]
VAN GINKEL CE and CONRADIE B (2001) Potential toxic algal incident in the Orange River. Department of Water Affairs and Forestry Draft Report No. N/D801/12/DEQ/0800. Department of Water Affairs and Forestry, Pretoria. [ Links ]
VAN GINKEL CE (2004) A national survey of the incidence of cyanobacterial blooms and toxin production in major impoundments. Department of Water Affairs and Forestry Internal Report No. N/0000/00/DEQ/0503. Government Printer, Pretoria. [ Links ]
VAN GINKEL CE (2008) Investigating the applicability of ecological informatics modelling techniques for predicting harmful algal blooms in hypertrophic reservoirs of South Africa. PhD thesis, North West University, Potchefstroom, South Africa. [ Links ]
VENTER B (2009) Vaalkop Dam: species diversity report: eco-aquatic monitoring project. North West Parks and Tourism Board, Eco-Care Trust, Pretoria. 6 pp. [ Links ]
WALMSLEY RD (2000) Perspective on eutrophication of surface waters: policy and research needs in south Africa. WRC Report No. KV129/00. Water Research Commission, Pretoria. [ Links ]
WALSBY AE (1971) The pressure relationships of gas vacuoles. Proc. R. Soc. London B 178 301-326. https://doi.org/10.1098/rspb.1971.0067 [ Links ]
WALSBY AE (1994) Gas vesicles. Microbiological Reviews 58 94-144. [ Links ]
WESTRICK JA (2008) Cyanobacterial toxin removal in drinking water treatment processes and recreational water: Cyanobacterial Harmful Algal Blooms. Adv. Exp. Med. Biol. 619 275-290. https://doi.org/10.1007/978-0-387-75865-7_13 [ Links ]
WHO (World Health Organization) (1999) Cyanobacterial Toxins: Microcystin-LR, Guidelines for Drinking-Water Quality. Addendum to Volume, 95-110. WHO, Geneva. [ Links ]
ZOSCHKE K, ENGEL C, BÖRNICK H and WORCH E (2011) Adsorption of geosmin and 2methylisoborneol onto powdered activated carbon at non-equilibrium conditions: Influence of NOM and process modeling. Water Res. 45 4544-4550. https://doi.org/10.1016/j watres.2011.06.006 [ Links ]
Received 30 June 2016
Accepted in revised form 6 December 2016
* To whom all correspondence should be addressed. e-mail: aswanepo@randwater.co.za

