


Services on Demand
Article
 English (pdf)
 Article in xml format
 Article references
Indicators

Related links
-
 Cited by Google
 -
 Similars in Google
Share

 Permalink
Water SA
On-line version ISSN 1816-7950
Print version ISSN 0378-4738
Water SA vol.43 n.1 Pretoria Jan. 2017
http://dx.doi.org/10.4314/wsa.v43i1.07
The hidden hydrology of Groenvlei, a lacustrine wetland on the southern Cape coast of South Africa
RP ParsonsI, *; PD VermeulenII
IParsons and Associates Specialist Groundwater Consultants, PO Box 151, Pringle Bay, 7196, South Africa
IIInstitute for Groundwater Studies, University of the Free State, PO Box 339, Bloemfontein 9300, South Africa
ABSTRACT
Following Parsons' (2009) challenge of the hypothesis that Groenvlei is sustained by discharge from the underlying Table Mountain Group Aquifer, research was undertaken to better understand the hydrology of Groenvlei. Using a daily water balance model coupled to Darcian flow calculations it was possible to show that direct rainfall and evapotranspiration losses were the key hydrological drivers of the system, with groundwater playing an important but secondary role. It was found that Groenvlei is not endorheic and that S pan measurements are best upscaled to lake evaporation using coefficients offered by Midgley et al. (1994). The reed collar plays an important role in the functioning of the lake, but is dormant during winter. The outcome of the research demonstrated that sound conceptualisation using all available data, information and knowledge remains a critical aspect of any hydrological modelling. The improved understanding of the hydrology of Groenvlei is expected to facilitate a better understanding of the nine Ramsar wetlands located on similar, but more complicated, hydrogeological settings elsewhere on the South African coastline.
INTRODUCTION
Parsons (2009) disagreed with Roets (2008) and Roets et al. (2008a, 2008b) by asking whether Groenvlei was really fed by groundwater discharged from the Table Mountain Group (TMG) Aquifer. He found no credible scientific evidence to support Roets' hypothesis. Further research was conducted by Parsons (2014) to better understand the hydrology of Groenvlei and quantify the contributions to the wetland. This paper presents some of the findings of that research.
STUDY AREA
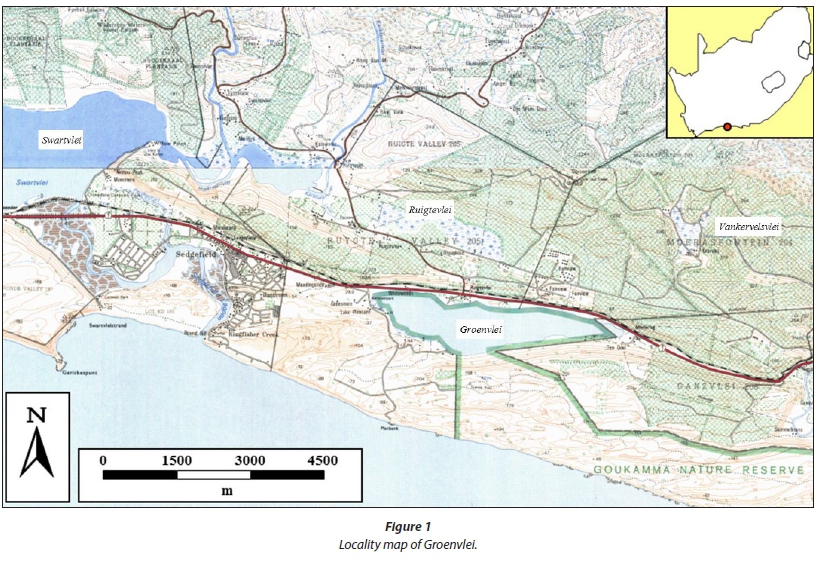
Groenvlei is located directly east of the village of Sedgefield on the southern Cape coast of South Africa (Fig. 1). It is one of a series of five brackish coastal lakes in the area, but is the only one disconnected from the sea. The wetland covers an area of 359 ha, of which 245 ha is open water and 114 ha comprise of reeds/ rushes/sedges (Phragmites, Typha and Cladium, respectively, henceforth all collectively referred to as reeds). The reed collar thus comprises 31.8% of the total area of the wetland. Most of the water body is less than 3 m deep. Groenvlei is situated between two steeply sloping west-east orientated stabilised dunes. It is somewhat unique in that it is not fed or drained by any rivers. Climatically, the southern Cape is transitional between the winter rainfall Mediterranean climate of the Western Cape and the subtropical summer rainfall characteristic of much of the rest of the country. Groenvlei experiences a mild and temperate climate. Rain falls throughout the year, with the area experiencing a mean annual rainfall of 653 mm.
The wetland is located on the Eden Primary Aquifer which comprises unconsolidated sand of unknown thickness. The aquifer is transmissive in nature and characterised by flat hydraulic gradients. Groundwater plays an important role in the water supply to Sedgefield, but abstraction is distant from the lake. Groundwater abstraction in the immediate vicinity of the lake is limited and for the sake of this assessment can be ignored.
Nine of the Ramsar-designated wetlands in South Africa are located in similar hydrogeological settings to Groenvlei. As the hydrology of Groenvlei does not have any surface water or tidal components, the hydrology is less complicated than the other systems and the role of the hydrogeological component can be better assessed. It is motivated that a better understanding of the role of groundwater in sustaining Groenvlei will facilitate a better understanding of the hydrogeological component of the nine Ramsar wetlands.
METHOD
A water balance study of the lake formed the basis of the study. This was supported by hydrogeological studies that allowed for the quantification of the groundwater flow components. Coupling of the water balance with Darcian flow equations provided a powerful tool for understanding and quantifying the hydrology of Groenvlei.
Water balance
The water balance (or water budget) is based on the conservation of mass and is widely used in hydrological studies (Ward, 1975; Winter, 1981; Healy et al. 2007). The successful application of the technique has as its foundation a sound conceptual model. In its simplest form the water balance is written as:
I - O = ∆s
where: I = input
O = output
∆s = change in storage
Expanding the equation to consider individual components of the input and output terms results in:
(P + Ri + Gi) - (E + Ro + Go + A) = ∆s
where: P = precipitation
Ri = run-off (in)
Gi = groundwater (in)
E = evapotranspiration
Ro = run-off (out)
Go = groundwater (out)
A = abstraction from the lake
The hydrology of Groenvlei does not include run-off into and out of the lake. The electrical conductivity of the wetland ranges between 350 mS/m and 450 mS/m, resulting in insignificant abstraction from the brackish water body. Consequently, the Ri, Ro and A terms can be ignored and the water balance equation rewritten as:
(Gi - Go) = E - P + ∆s
with the term (Gi - Go) being referred to as the nett groundwater contribution. Rainfall, pan evaporation and lake levels had been recorded daily for a period of 31 years, thus allowing the water balance to be used to solve for the unknown, i.e., the nett groundwater contribution. A strength of the study was the ability to check the reasonableness of the determined nett groundwater contribution by using Darcy's Law to determine the inflow and outflow of groundwater from the lake.
Climatic data
While the lake level at Station K3R001 was recorded by the Department of Water and Sanitation to a high level of accuracy, the climatic data measured between October 1981 and October 2012 at Weather Station K3E003 were problematic. On inspection of the S pan evaporation data, it was found that 17% of the data were missing and 0.2% of the data were unreasonably high. As evaporation is relatively predictable, it was possible to patch the data set using the average daily loss of each month calculated from the S pan data measured at Weather Station K3E003. The small percentage of suspect data were removed from the record and patched in the same manner. The revised annual S pan evaporation was calculated at 1 028 mm/a. This is lower than the 1 326 mm/a presented in WR90 for Weather Station K3E003 (Midgley et al., 1994), but similar to the 1 096 mm/a for the nearby, but no longer functioning, weather station at Swartvlei. The two weather stations were less than 2 km apart and 10 km west of Groenvlei.
Addressing missing rainfall data was more difficult. A comparison of rainfall measured at Weather Station K3E003 with that measured at the Sedgefield Fire Station and the water level of Groenvlei suggested that the rainfall record was at least as poor as that of the S pan data. A manual process was then undertaken to patch the rainfall record. This entailed comparing rainfall measured at K3E003 to that measured at the fire station, and noting where poor comparisons were obtained. These instances of poor correlation were then compared to the water level of Groenvlei, and the rainfall adjusted if the rainfall was not of a similar order as the change in water level in the lake. A check was made to ensure that any significant rise in water level was accompanied by a rainfall event in the rainfall record. Both approaches were based on the observation that a rise in lake level was accompanied by an equivalent depth of rainfall and an acknowledgement that errors associated with small events would be difficult to detect or correct. A total of 9 rainfall events were added to the 31-year record, after which the mean annual rainfall was calculated to be 653 mm/a.
Hydrogeological data
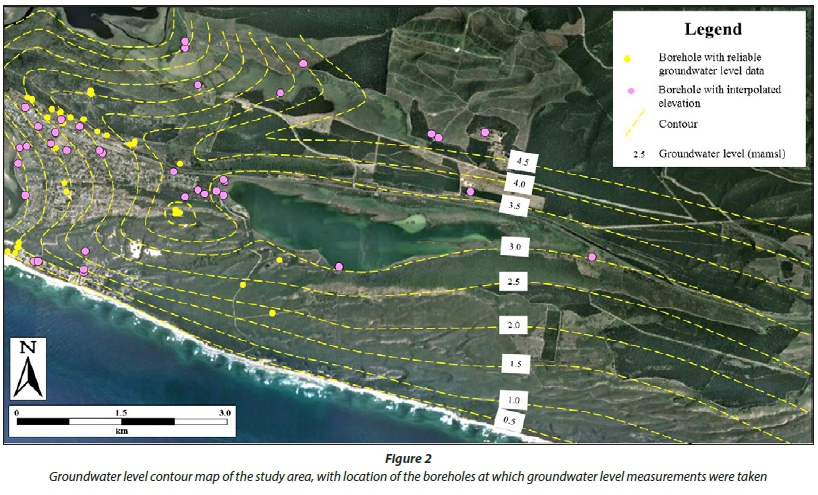
Hydrogeological data used in the research were sourced from a range of groundwater consulting studies conducted in the area between 1992 and the present (Parsons, 2014). This included the measurement and monitoring of groundwater levels, pumping tests and the use of radon isotopes. The groundwater level data allowed for a groundwater level contour map of the area to be compiled (Fig. 2), while the remaining data allowed for characterisation and conceptualisation of the groundwater system.
The volume of groundwater discharged through a cross-sectional area can be calculated using Darcy's Law. In its simplest form Darcy's Law states that:
Q = T i W
where: T = transmissivity
i = hydraulic gradient
W = width of cross-sectional area
The transmissivity of the Eden Primary Aquifer was determined from the results of pumping tests conducted in the vicinity of Sedgefield (Parsons, 2014). While the assessment of T in unconfined leaky aquifers can be problematic, absence of knowledge about the thickness of the aquifer was also limiting. The results of testing confirmed the aquifer to be highly trans-missive, and an average T of 270 m2/d was obtained from the analysis of the results of 13 constant discharge tests conducted in the area. This estimate of T is similar to the 300 m2/d used by Dennis in her numeric model of the groundwater system directly east of Groenvlei and similar to that reported in the literature for similar primary aquifers in and around Cape Town (Henzen, 1973; Fleisher and Eskes, 1992; Wright and Conrad, 1995; Vandoolaeghe, 1989).
The groundwater level contour map allowed for the direction of groundwater flow to be determined as well as the measurement of hydraulic gradients (i) and the width of the inflow and outflow boundaries of the lake (w) (Table 1). Interpretation of the map confirmed that the wetland acts as a flow-through cell.

RESULTS
Groenvlei not endorheic
Analysis of groundwater level data showed that Groenvlei is not endorheic in character (i.e., a blind or closed drainage system without any drainage outlet, in which flow remains within), with groundwater discharging into the lake along its northern shore and water discharging into the subsurface along the southern shore (Fig. 2). This interpretation was supported by salinity and isotope data (Parsons, 2014) and highlights the importance of considering an integrated hydrological cycle, as has been embedded in the National Water Act (Act No. 36 of 1998). It also points to the hidden hydrology (hydrogeology) of systems often not being appreciated.
It is noteworthy that Bayesian statistics could not be used to interpolate the direction of groundwater flow from topographic data as there is no correlation between topography and groundwater head (Fig. 3).

Surface run-off
No rivers drain into or out of Groenvlei. This visual observation was supported by an analysis of rainfall and lake level data during extreme events. It was found that the depth of rainfall during 4 extreme events (March 2003 (175 mm in 3 days), December 2004 (166 mm in 2 days), August 2006 (275 mm in 2 days) and November 2007 (257 mm in 2 days)) was equivalent to the rise of water in the lake. For example, during the November 2007 event the level of the lake rose 240 mm. The hydrogeological properties of the sand are such that the infiltration rate of the sand was greater than rainfall intensity during these events.
Evapotranspiration losses
Evaporation is a collective term covering all processes in which liquid water is transferred as a vapour to the atmosphere (McMahon et al., 2013). Direct measurement of evaporation losses from an open body of water is rarely undertaken. Clulow et al. (2012) noted that despite improvements to measurement techniques and the dominant role of evaporation in wetland water balances, there are few studies in southern Africa with actual measurements of evaporation from wetlands. A range of indirect methods are available to estimate such losses, including estimation based on measured pan evaporation data, water balance calculations, energy balance calculations, mass transfer procedures and a combination of these.
Given that evaporation was measured nearby at Weather Station K3E003 using an S pan, and from information presented in the literature (Watkins, 1993; Midgley et al., 1994; McKenzie and Craig, 1999; Blight, 2002; Clulow et al., 2012; McMahon, 2013 and others), it was decided that 3 different methods would be used to upscale the pan measurements to actual evaporation losses from Groenvlei:
• S pan data adjusted using a coefficient of 0.7
• S pan data adjusted by Midgley et al. (1994) lake evaporation coefficients
• A pan data converted from S pan measurements using the formula provided by Bosman (1990) (as quoted by Midgley et al., 1994)
Adjusting pan evaporation measurements with a coefficient is widely used in hydrological studies while the approach prescribed by Midgley et al. (1994) is included in the South African WR90 data set (now updated to WR2012). From their work in the Orange River Basin, McKenzie and Craig (1999) proposed A pan evaporation be used without correction to simulate evaporation losses from South African rivers. They found river evaporation to be higher than S pan values.
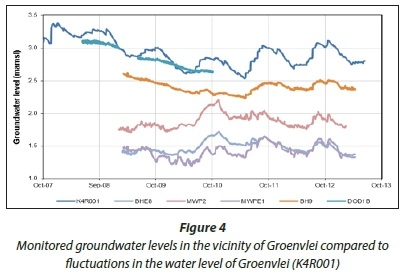
Coupling the water balance to estimates of groundwater fluxes meant it was possible to compare the results obtained using the three methods of quantifying the evaporation component of the water balance. It was found that the use of A pan data, as proposed by McKenzie and Craig (1999), yielded unsatisfactory results as the nett groundwater contribution yielded by the water balance (1.58 mm/d) was much greater than that determined using Darcy's Law (0.29 mm/d). While reasonable results were obtained by adjusting S pan data with a coefficient of 0.7 (0.68 mm/d), the best results were obtained using the lake evaporation coefficients put forward by Midgley et al. (1994) (0.37 mm/d). In this analysis it was assumed that the nett groundwater contribution remained relatively constant as trans-missivity, the length of the boundaries of the water body and hydraulic gradient all remain constant. Monitoring of groundwater levels showed that groundwater levels did not vary by more than 0.4 m over a 5-year period (including a 2-year period of drought), with high groundwater levels coinciding with elevated water levels in the lake (Fig. 4). These observations indicate that hydraulic gradients remain relatively constant over time.
Water balance
A daily water balance model was developed using an Excel spreadsheet and run for periods of a year. Input into the model included corrected daily rainfall data, patched and adjusted daily S pan data and an adjustable nett groundwater contribution term that allowed for the modelled water level of Groenvlei to be matched to the observed water level. Three versions of the daily water balance model were compiled, each using one of the methods described above to upscale the S pan data to lake evaporation losses.
When running the models using the available data record covering a period of 31 years, it was observed that the transfer from one year to the next of residual errors related to the climatic data prevented reasonable results from being obtained. It was then decided to run the models at a time step of a hydrological year, thereby preventing residual errors being passed through the model. The period between October 1981 and September 1982 is presented in this paper as an example of patterns observed in the 31-year record of the study.
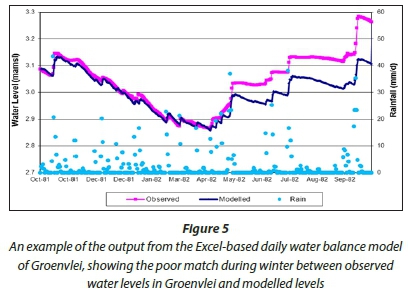
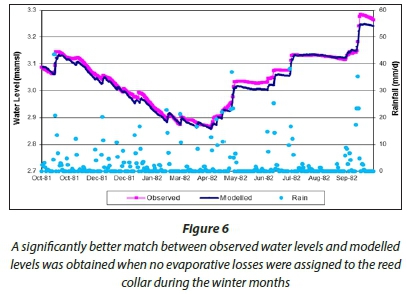
Irrespective of the method used to upscale the S pan data or the nett groundwater contribution, the model was not able to predict the water level of the wetland in the latter part of the hydrological year, i.e., April to September. An example of this is shown in Fig. 5, but this pattern was observed in each of the 31 years that were modelled. Further research of the transpiration patterns of vegetation that formed the reed collar around the wetland (Carter, 1996; Holt et al. 1998; Goulden et al., 2007 and Zhou and Zhou, 2009), as well as testing, showed significantly better results were obtained when no evaporation losses were assigned to the reed collar in the winter months (Fig. 6). As a result, the water balance model was restructured to allow for differences in evaporation during summer and winter and from the open water and the reed collar. Analysis of modelling results using the three methods to upscale the S pan data supported the hypothesis that the reeds don't transpire water during winter and that about 10% more water may be lost from the reed collar than from the open body of water during summer.
Integrating the water balance results with steady-state Darcian flow calculations indicated direct rainfall (71.6%) and groundwater inflow along the western and northern boundaries of the lake (28.4%) constituted inflow into the system. This was balanced by evaporation from open water (61.7%), transpiration from the reed collar in summer (21.4%) and groundwater outflow along the southern boundary (16.9%). The combined evaporation losses amounted to 83.1%. Clearly, direct rainfall and evapotranspiration losses are the main hydrological drivers of the system, with groundwater playing an important, but secondary role.
DISCUSSION
A review of earlier hydrological studies of Groenvlei confirmed that the conceptualisation of prevailing conditions was critical to understanding and quantifying the hydrology of the lake. The absence of surface run-off invalidates the use of the Pitman rainfall-run-off model to quantify the hydrology of Groenvlei, as done by Fijen (1995), while available groundwater level and hydrochemical data did not support the work of Roets (2008), Roets et al. (2008a, 2008b) and Vivier (2010). In any hydrologi-cal study it is paramount that conceptualisation be supported by available data, information and knowledge. The scientific method demands a convergence of all evidence.
This research has challenged earlier findings relating to the hydrology of Groenvlei. While most data support the conceptual understanding of the system, a chemical mass balance could not be computed. This technique is the same as the water balance applied during this study, but couples flow fluxes to chemical concentrations to balance chemical loads. While the electrical conductivity or Cl concentrations of groundwater inflow, rainfall, evaporation losses and subsurface discharge from the lake were either measured or assumed from scientific literature (rainfall, evaporation), the chemical mass balance could not be balanced. From the mass balance modelling it appears that salinity is prevented from leaving the lake, possibly through some sort of re-entrainment mechanism driven by the depth of the lake and wind. However, this hypothesis requires further research. Greater confidence in the Groenvlei water balance will apply once this aspect of the system is better understood.
While it might still be possible that upward flow from the TMG Aquifer discharges into the Eden Primary Aquifer, there is no scientific evidence to support the hypothesis that Groenvlei is sustained by this mechanism. Using the results of the water balance study and the depth of rainfall in the Groenvlei catchment it was calculated that only 5.7% of the rainfall in the catchment north of Groenvlei reports to the lake, the rest is either lost to evapotranspiration or discharges to the sea via the subsurface.
It is expected that the outcomes of this research will allow for a better appreciation of the role of groundwater in sustaining all wetlands located in similar hydrogeological settings, including the nine South African Ramsar-designated wetlands (Verlorenvlei, Langebaan, Rondevlei, De Mond, De Hoopvlei, Wilderness, St Lucia, Lake Sibaya and Kosi Bay). Unlike many of these systems, Groenvlei receives no surface water run-off, has no surface water discharge and no tidal exchange. Consequently, Groenvlei is a simpler system with fewer components to be computed for the water balance. In turn this resulted in fewer errors being introduced into the calculations and allowed for the role of groundwater in sustaining Groenvlei to be more accurately assessed.
CONCLUSION
Research into the hydrology of Groenvlei has demonstrated that sound conceptualisation based on available data, information and knowledge is critical to developing a better understanding of the system. Groenvlei is not endorheic and its key hydrological drivers are direct rainfall and evapotranspiration. Groundwater plays an important, but secondary role. The research showed that the reed collar plays an essential role in the functioning of the lake, with the reeds being dormant in winter. The lake evaporation coefficients put forward by Midgley et al. (1994) provide a means of upscaling pan measurements to lake evaporation losses. While almost all evidence supports the conceptualisation presented in this paper, an inability to balance the chemical mass balance indicates that further research is required before the system is fully understood.
ACKNOWLEDGEMENTS
The constructive comments and feedback from the three anonymous reviewers were received with gratitude. Any errors, however, remain those of the authors.
REFERENCES
BLIGHT GE (2002) Measuring evaporation from soil surfaces for environmental and geotechnical purposes. Water SA 28 (4) 381-394. https://doi.org/10.4314/wsa.v28i4.4911 [ Links ]
CARTER V (1996) Technical aspects of wetlands, wetland hydrology, water quality, and associated functions. In: USGS National Water Summary on Wetland Resources, Water Supply Paper 2425. United States Geological Survey, Reston. [ Links ]
CLULOW AD, EVERSON CS, MENGISTU MG, JARMAIN C, JEWITT GPW, PRICE JS and GRUNDLING P-L (2012) Measurement and modelling of evaporation from a coastal wetland in Maputaland, South Africa. Hydrol. Earth Syst. Sci. 16 3233-3247. https://doi.org/10.5194/hess-16-3233-2012 [ Links ]
DENNIS I (2010) Wastewater treatment plant at Groenvlei - numerical groundwater modelling. Draft report prepared for Groundwater Africa, Somerset West. [ Links ]
FIJEN APM (1995) Groenvlei lake catchment water management strategy - main report. Department of Water Affairs and Forestry, Pretoria. [ Links ]
FLEISHER JNE and ESKES SJT (1992) Optimization and management of the Atlantis groundwater resource. Report 33/92, submitted to Western Cape Regional Services Council by Division of Water Technology, Groundwater Programme, CSIR, Stellenbosch, November 1992. [ Links ]
GOULDEN ML, LITVAK M and MILLER SD (2007) Factors that control Typha marsh evapotranspiration. Aquat. Bot. 86 97-106. https://doi.org/10.1016/j.aquabot.2006.09.005 [ Links ]
HEALY R, WINTER TC, LABAUGH JW and FRANKE OL (2007) Water budgets: Foundations for effective water-resources and environmental management. USGS Circular 1308. U.S. Geological Survey, Reston. [ Links ]
HENZEN MR (1973) Die herwinning, opberging en onttrekking van gesuiwerde rioolwater in die Kaapse skiereiland. Report by the National Institute for Water Research, Council for Scientific and Industrial Research, Bellville. [ Links ]
HOLT TC, MAYNARD BK, JOHNSON WA and BUSHOVEN JT (1998) Winter performance of plants in treatment wetlands. Proc. Conf. Ecosystems Restoration and Creation, Hillsborough Community College, Institute of Florida Studies. [ Links ]
MCKENZIE RS and CRAIG AR (1999) Evaporation losses from South African rivers. WRC Report No. 638/1/99. Water Research Commission, Pretoria. [ Links ]
MCMAHON TA, PEEL MC, LOWE L, SRIKANTHAN R and MCVICAR TR (2013) Estimating actual, potential, reference crop and pan evaporation using standard meteorological data: a pragmatic synthesis. Hydrol. Earth Syst. Sci. 17 1331-1363. https://doi.org/10.5194/hess-17-1331-2013 [ Links ]
MIDGLEY DC, PITMAN WV and MIDDLETON B (1994) Surface water resources of South Africa 1990. WRC Report No. 298/1/94. Water Research Commission, Pretoria. [ Links ]
PARSONS RP (2009) Is Groenvlei really fed by groundwater discharged from the Table Mountain Group Aquifer? Water SA 35 (1) 657-662. https://doi.org/10.4314/wsa.v35i5.49425 [ Links ]
PARSONS RP (2014) Quantifying the role of groundwater in sustaining Groenvlei, a shallow lake in the southern Cape region of South Africa. Unpubl. PhD thesis, Institute for Groundwater Studies, University of the Free State, Bloemfontein. [ Links ]
ROETS W (2008) Groundwater dependence of aquatic ecosystems associated with the Table Mountain Group Aquifer. Unpubl. PhD thesis, University of the Western Cape, Cape Town. [ Links ]
ROETS W, XU Y, RAITT L and BRENDONCK L (2008a) Groundwater discharges to aquatic ecosystems associated with the Table Mountain Group (TMG) Aquifer: A conceptual model. Water SA 33 (1) 77-87. [ Links ]
ROETS W, XU Y, RAITT L, EL-KAHLOUN M, MEIRE P, CALITZ F, BATELAAN O, ANIBAS C, PARIDAENS K, VANDENBROUCKE T, VERHOEST NEC and BRENDONCK L (2008b) Determining discharges from the Table Mountain Group (TMG) aquifer to wetlands in the Southern Cape, South Africa. Hydrobiologia 607 175-186. https://doi.org/10.1007/s10750-008-9389-x [ Links ]
VANDOOLAEGHE MAC (1989) The Cape Flats groundwater development pilot abstraction scheme. Report GH 3655. Directorate of Geohydrology, Department of Water Affairs, Cape Town. [ Links ]
VIVIER JJP (2010) Reserve determination studies Outeniqua catchment: Ecological water requirements study. Groundwater RDM report (K10-K50, K60G). Africa Geo-Environmental Services, Pretoria. [ Links ]
WARD RC (1975) Principles of Hydrology. McGraw-Hill, London. [ Links ]
WATKINS DA (1993) The relationship between daily and monthly pan evaporation and rainfall totals in southern Africa. Unpubl. MSc thesis, Rhodes University, Grahamstown. [ Links ]
WINTER TC (1981) Uncertainties in estimating the water balances of lakes. Water Res. Bull. 17 (1) 82-115. https://doi.org/10.1111/j.1752-1688.1981.tb02593.x [ Links ]
WRIGHT A and CONRAD JE (1995) The Cape Flats aquifer current status. Report No. 11/95. Groundwater Programme, Watertek, CSIR, Stellenbosch. [ Links ]
ZHOU L AND ZHOU G (2009) Measurement and modelling of evapotranspiration over a reed (Phragmites australis) marsh in Northeast China. J. Hydrol. 372 41-47. https://doi.org/10.1016/j.jhydrol.2009.03.033 [ Links ]
Received 6 August 2015
Accepted in revised form 24 November 2016
* To whom all correspondence should be addressed. e-mail: roger@pasgc.co.za

