


Serviços Personalizados
Artigo
 Inglês (pdf)
 Artigo em XML
 Referências do artigo
Indicadores

Links relacionados
-
 Citado por Google
 -
 Similares em Google
Compartilhar

 Permalink
Water SA
versão On-line ISSN 1816-7950
versão impressa ISSN 0378-4738
Water SA vol.42 no.4 Pretoria Out. 2016
http://dx.doi.org/10.4314/wsa.v42i4.18
Estimating total evaporation at the field scale using the SEBS model and data infilling procedures
S Gokoo*; KT Chetty; GPW Jewitt; A Heeralal
School of Agriculture, Earth and Environmental Sciences, Centre for Water Resources Research, University of KwaZulu-Natal, Pietermaritzburg, South Africa
ABSTRACT
The spatial representativeness of total evaporation estimates (ET) acquired from conventional approaches is limited, as these techniques generally provide site-specific values. The use of satellite earth observation has shown a great deal of potential in capturing spatially representative hydro-meteorological flux data and therefore represents a practical alternative for estimating ET. However, one of the challenges facing ET estimation using satellite earth observation data is the effect of clouds, which reduce the number of satellite images available for use. The objectives of this paper were firstly to validate satellite-derived ET estimates against estimates acquired from a surface renewal system and, secondly, to assess the feasibility of two infilling techniques to create a daily satellite-derived ET time series. The Surface Energy Balance System (SEBS) model was used to derive daily ET using MODIS imagery. Two infilling approaches, the Kc approach and a linear interpolation approach, were evaluated by comparing their respective values against in-situ ET measurements, as well as SEBS ET estimates derived using MODIS. The results showed that SEBS ET estimates were approximately 47% higher and produced R2 and RMSE values of 0.33 and 2.19 mm-d-1, respectively, compared to in-situ ET values. The ET estimates obtained by applying the Kcapproach and the linear interpolation approach compared favourably with the in-situ ET values, producing RMSE values of 0.9 mm-d-1and 0.6 mm-d-1, respectively. However, comparisons of ET estimates acquired by applying the Kcact approach and the linear interpolation approach against the SEBS ET indicated a poor match, yielding RMSE values of 1.96 mm-d-1and 1.54 mm-d-1, respectively.
Keywords: satellite earth observation, SEBS Model, ET, infilling, surface renewal system
INTRODUCTION
Semi-arid environments such as South Africa are predominantly water-scarce (Jarmain et al., 2009; Kongo and Jewitt, 2006). Within South Africa there is a diverse community of water users, all competing for a share of the limited resource (Jarmain et al., 2009). The need to accurately estimate and understand the temporal and spatial variations of ET takes on added significance in these environments (Gowda et al., 2007).
Hydrological models and tools are often used as decision support tools to inform water resources management. However, the success of these systems can be strongly influenced by the data being incorporated into them (Van Dijk and Renzullo, 2011). Sustainable water resource management is therefore dependent on the right quantity and quality of data being available for the representative spatial and temporal scale (Van Dijk and Renzullo, 2011).
Various techniques, such as micro-meteorological approaches, have been extensively applied and shown to be invaluable for the estimation of ET. However, these conventional techniques are often complex to apply, data-intensive and generally limited to small spatial scales and homogenous land covers (Li et al., 2009). Advancements in satellite earth observation and geographic information system (GIS) technologies over the past 4 decades have provided a useful alternative to practitioners, providing useful information for the quantification of various hydrological processes (Van Dijk and Renzullo, 2011; Fern'andez-Prieto et al., 2012; Xu et al., 2014).
Satellite earth observation has shown great potential in providing information at large geographic scales. Furthermore, it allows for data to be captured in data-scarce regions and can provide time-series data fairly easily, due to the periodic updating of information (Su, 2002; Bastiaanssen and Harshadeep, 2005; Jin et al., 2005; Li et al., 2009;; Li et al., 2011; Van Dijk and Renzullo, 2011; Fern'andez-Prieto et al., 2012; Ma, 2012).
While the benefits of employing satellite-based ET estimation techniques can be invaluable in improving water resource management. One of the main challenges involves the availability of good quality imagery for the running of ET models. The revisit and repeat cycles of satellite sensors, as well as cloud, influence the number of images which can be used for a particular period of interest. This may limit the feasibility of applying a satellite-based approach for the estimation of ET in regions which experience rapid temporal changes, such as irrigated agricultural fields. Limited temporal availability of imagery can be a limiting factor to the application of satellite earth observation data for hydrological modelling applications or decision support systems, which require daily continuous data as inputs.
The spatial resolution of satellite earth observation imagery is another major limitation. Coarse spatial resolution imagery can be useful for routine monitoring and estimation of ET due to its high temporal resolution (Hong et al., 2011). However, the spatial resolution associated with these images is generally too low to provide beneficial information for hydrological applications, as pixel sizes often exceed the size of the area under observation (Bhattarai et al., 2015). While moderate and fine spatial resolution imagery can be obtained to overcome this limitation, their limited temporal resolution does not allow for operational monitoring and estimation of ET (Singh et al., 2014b).
In this study, Moderate Resolution Imaging Spectroradiometer (MODIS) Terra Level 1_B images were used as inputs to the Surface Energy Balance model (SEBS) (Su, 2002), to estimate ET for the perio d 1 December 2011 to 25 November 2012. There were a number of days in which no satellite ET estimates could be generated due to clouds.
The objective of this study was to apply the SEBS model and validate the satellite-derived ET estimates against in-situ data collected using the surface renewal system. Furthermore, the feasibility of two data-infilling approaches; the Κapproach and a linear interpolation approach, were evaluated by comparing their respective ET estimates against the in-situ values as well as SEBS ET estimates derived using MODIS.
MATERIALS AND METHODOLOGY
Study area and data sets
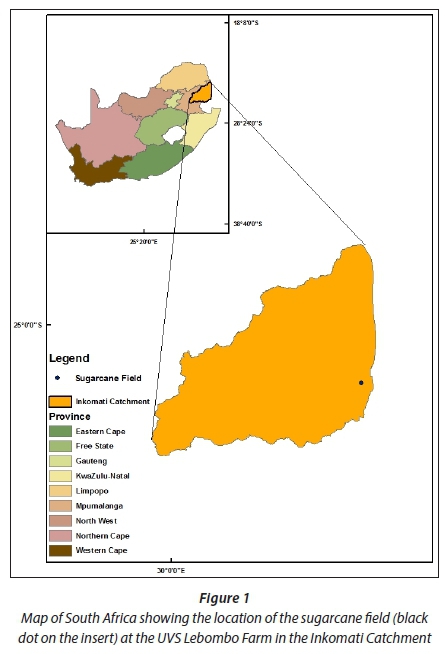
The SEBS model was applied and validated at the UVS Lebombo Farm (Field G1) in close proximity to the Komatipoort Mill; Field G1 was planted to sugarcane (Saccharum officinarum) under irrigation. The Komatipoort Mill is situated in the Inkomati Catchment in the Mpumalanga Province of South Africa (Fig. 1). The majority of the precipitation occurs during the summer months (October to March) with a mean annual precipitation ranging between 400 and 1 000 mm for the region (Basson and Rossouw, 2003). The irrigated sugarcane field was approximately 4 ha. The crop was of the N19 variety and was planted on 11 June 2011 and was scheduled for harvest on 12 June 2012. The crop was then re-established at the end of July 2012. Approximately 7 mm of water was applied to the crops daily by a surface drip irrigation system. The soils in the field possess a clay content of approximately 39% (Jarmain et al., 2013).
The study site was selected based on the availability of meteorological data and observed daily ET data obtained through a Water Research Commission-funded project (WRC K5/2079//4). Su (2002) developed and tested the SEBS Model over agricultural areas. Therefore applying this model to estimate ET over an irrigated agricultural crop was deemed to be a feasible option. The ET validation data were acquired from the abovementioned study (Jarmain et al., 2013).
A surface renewal system was installed within the sugarcane field (25.59° S; 31.89° E) (Jarmain et al., 2013), to estimate ET for the period December 2011 to December 2012. The surface renewal technique is an energy balance technique which can be used to estimate daily ET (Savage et al., 2004). According to Jarmain et al. (2013) the technique is attractive as it requires knowledge of only a few parameters and is relatively low-cost, compared to other conventional techniques. The technique is used to estimate the sensible heat flux (H). These measurements are then combined with measurements of the soil heat flux and net radiation to determine the latent heat flux as a residual of the simplified surface energy balance equation (Jarmain et al., 2013).
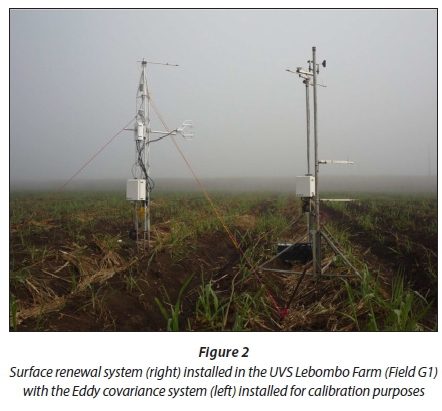
The estimation of H using the surface renewal system involved the use of two naturally-ventilated fine-wire thermocouples to measure air temperature at high frequencies (typically 2 or 10 Hz). The two fine-wire thermocouples were attached to a mast, at a placement height of 0.5 and 1.0 m above the crop. The net irradiance was measured by a net radiometer placed at 2 m above ground. Two soil heat flux plates buried at 0.08 m below the ground were used to measure soil heat flux. A set of parallel soil temperature probes buried at 0.02 and 0.06 m below the ground were used to measure the average soil temperature and then later used to compute the temporal change in soil temperature. This information was then used to determine the soil heat flux stored above the soil heat flux plates. An illustration of the surface renewal system setup in the UVS Lebombo Farm (Field G1) is provided in Fig. 2.
Information pertaining to the vegetation type, measurement height, air temperature gradient and a weighting factor are required for the application of this technique (Jarmain et al., 2013). The weighting factor is determined, a priori, for the vegetation type, thermocouple size and measurement height and then by comparing the estimated H against the H measured by an alternate technique (Jarmain et al, 2013). Nile (2010) notes that weighting factors are obtainable for a variety of vegetation types.
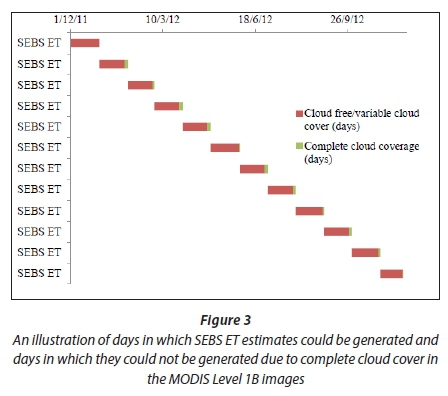
The weighting factors used by Jarmain et al. (2013) were acquired from an Eddy covariance system. The weighting factors were determined for a young short sugarcane crop during the period 24 July to 17 September 2012. The factors used for the residual period and the various sugarcane growth stages were acquired from literature and expert consultation (Jarmain et al., 2013). The weighting factors, lag times and sensor heights used by Jarmain et al. (2013) to determine the surface renewal H and ET for the study period are shown in Table 1. A weighting factor of 0.5 was used for a tall crop (1.0 m < crop height < 4.2 m) and of 0.6 was used for the calibration period (0.5 m < crop height < 1.0 m).
Satellite data collected by the MODIS sensor aboard the Terra (EOS AM) satellite launched in December 1999 was used for this study. MODIS Level 1B calibrated radiances (MOD021KM) and MODIS geo-location files (MOD03), with a spatial resolution of 1 km2 and a daily temporal resolution, were used to estimate the ET of the sugarcane field from 1 December 2011 to 25 November 2012. The aforementioned time period was selected for the acquisition of MODIS Level 1B data, so that the SEBS-derived ET estimates coincided with the surface renewal measurements.
The MODIS Level 1B data was given in an orbit-based format. Therefore, the data were projected into a standard projection and format which would be compatible with GIS software.
The MODIS re-projection Swath Tool (MRT Swath) was used to convert both the MOD021KM and MOD03 files into a geographic projection and GeoTiff format, which is supported by the Integrated Land and Water Information System (ILWIS). Thereafter, only the relevant reflectance bands required for further processing were exported into ILWIS (Su and Wang, 2013).
The procedure outlined in Su and Wang (2013) was used to derive the necessary land surface parameters from the pre-processed MODIS bands for the estimation of ET in SEBS:land surface albedo, land surface temperature, emissivity, fractional vegetation cover, leaf area index, vegetation roughness height and the normalized difference vegetation index (NDVI) (Su et al., 2001; Su 2002).
Hourly meteorological data for the study area (solar radiation and temperature) were obtained from Jarmain et al. (2013). However, this data had gaps due to power failure and equipment malfunctioning. Consequently, gap-filling data were obtained from the Agricultural Research Council-Institute for Soil, Climate and Water (ARC-ISCW) Komatipoort Amanxala weather station (25.62° S; 31.86° E; alt = 174 m). The data obtained at this station were used as surrogate input, for days, when there were no hourly data from the aforementioned study. Other ancillary meteorological data (wind speed) required for this study were obtained from the Komatipoort Amanxala weather station, and the NASA earth observatory website (i.e. water vapour and aerosol optical thickness) (NASA, 2014).
The SEBS Model
The estimation of ET as a residual of the shortened energy balance is a commonly applied technique for both operational and scientific research purposes (Senay et al., 2007; Jarmain et al., 2009; Long and Singh, 2012). Some of the commonly-applied techniques include the Surface Energy Balance Index (SEBI) (Menenti and Choudary, 1993), the Surface Energy Balance Algorithm for Land (SEBAL) (Bastiaansen et al., 1998a), SEBS (Su, 2002) and Mapping Evapotranspiration at High Resolution with Internalized Calibration (METRIC) (Allen et al., 2007).
The SEBS model was chosen because it is easily accessible and has been applied extensively for the estimation of regional fluxes and ET (Yang et al., 2010; Zhuo et al., 2014). SEBS is a single-source surface energy balance model, which can be utilized to estimate turbulent fluxes within the atmospheric boundary layer, or to determine the evaporative fraction (EF) through the use of satellite images and meteorological data for both local and regional scales (Su, 2002; Jin et al., 2005;; Li et al., 2009; Van de Kwaast, 2009; Gibson et al. 2011; Ma, 2011, 2012).
The satellite-derived land surface parameters and meteorological data required as inputs to SEBS are incorporated into three sub-models, to determine the components of the energy balance, stability factors and the roughness length for heat transfer (Su et al., 2001; Su, 2002). The three sub-models and the formula described in Su (2002) are then used to estimate the EF at limiting cases. The evaporative fraction in SEBS is assumed to be constant for the entire day and the daily ET is determined from the available latent heat flux (Su, 2002), as:

where: Edaily is the actual daily ET (mm), Λ24 is the daily average evaporative fraction, Rnis the net radiation (W-rrr2), Go is the soil heat flux (W-m-2), λ is the latent heat of vaporization (2.45 MJ-kg-1 at 25°C) and pw is the density of water (kg-m-3).
Infilling techniques used to create a continuous daily ET time series
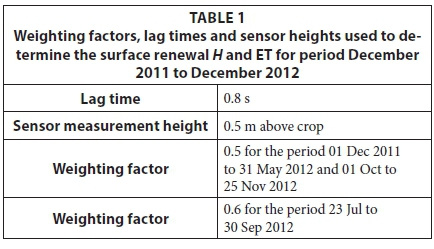
Due to complete cloud cover for 28 days in the MODIS Level 1B data, it was impossible to generate a continuous daily ET data set for the period 1 December 2011 to 25 November 2012 using SEBS estimates of ET. The days on which SEBS ET estimates could be obtained are shown in Fig. 3.
An infilling technique was therefore required. The linear interpolation technique by Muhammed (2012) and the Kc technique by Santos et al. (2008) were applied in this study. These techniques were selected based on the criteria of relative ease of application and data availability.
The linear interpolation technique is a statistical approach which determines the infilled ET as:

where: ET2 is the unknown daily ET value (mm-d1); ET1is the first known daily ET value (mm-d-1); ET3 is the next known daily ET value (mm-d-1); X1 is the Julian day for ET1 X2is the Julian day for ET2 and X3 is the Julian day for ET3.
The technique described above is predicated on the assumption that there are ET values on either side of a missing value. In this study, for situations in which there are 2 or more successive missing values, the technique was applied using the preceding known ET value (ET1) and the subsequent known ET value (ET2) with only the value of the respective Julian day (X2) being changed when applying Eq. 2 to estimate the unknown daily ET value (ET3).
The Kcact technique is a more physical approach which determines the infilled ET as:

where: Kcact can be defined as the actual crop coefficient which accounts for the effects of environmental stress (Allen et al., 2005), ET is the SEBS ET (mm-d"1) and ETref is the grass reference evaporation determined using the FAO Penman-Monteith reference evaporation approach (mm-d-1). The FAO Penman-Monteith reference evaporation (Allen et al., 1998) was derived from meteorological data collected in the WRC study.
Kcact values were derived approximately once every 10 days. It was assumed that a 10-day interval would be suitable, as the temporal progression of Kc should not change rapidly over time. A spline was applied to interpolate the values for the missing dates in order to account for the temporal progression of Kact,, which, in turn, was used to develop the Kcact, curves. These values and the reference evaporation can then be used to estimate the ET for days with complete cloud cover.
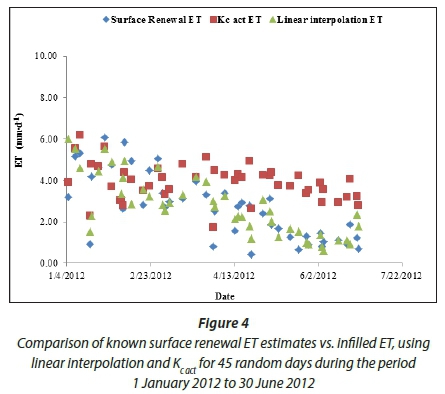
In order to assess which technique would be most suitable to infill the missing data, a preliminary investigation was undertaken applying two differing approaches for the period 1 January 2012 to 30 June 2012. As this was a preliminary investigation only a shortened period was selected to conduct analyses, in order to identify the most suitable infilling technique.
The first test involved the use of the surface renewal daily ET record. Forty-five known ET values obtained from the surface renewal system were artificially removed for the abovementioned time period and treated as missing data. Of the 45 artificially-removed days, 7 actually possessed complete cloud cover. The linear interpolation technique and the Kc technique were then applied to these 45 days to infill the missing records. For the application of the Kcact technique, 19 surface renewal ET values for selected dates were used to derive Kc actat a 10-day interval for the test period.
The 45 days which required infilling, were selected randomly and the maximum number of consecutive days requiring infilling was pre-set as 3, in order to replicate the trend observed during the generation of the SEBS ET estimates.
The second test involved the use of the SEBS daily ET estimates generated for the period 1 January 2012 to 30 June 2012. The equivalent 45 random days to be infilled in the first test were used here again. Known SEBS estimates of ET were artificially removed and the linear interpolation technique and the Kcact technique were applied to infill the missing data records. For the application of the Kc technique, 19 SEBS ET values, for the corresponding dates used in Test 1, were used to derive Kcact at a 10-day interval for the test period.
Performance statistics, i.e. mean, median, relative volume error (RVE), root mean square error (RMSE), coefficient of determination (R2) and a 2-sample i-test, were used to analyse the results of the various investigations. These statistics have been used in a variety of studies in which satellite earth observation data are used to estimate ET (Su, 2002; Jarmain et al., 2009; Yang et al. 2010; Elhag et al., 2011; Gibson et al., 2011; Rwasoka et al., 2012; Ma et al., 2014; Pardo et al., 2014).
RESULTS and DISCUSSION
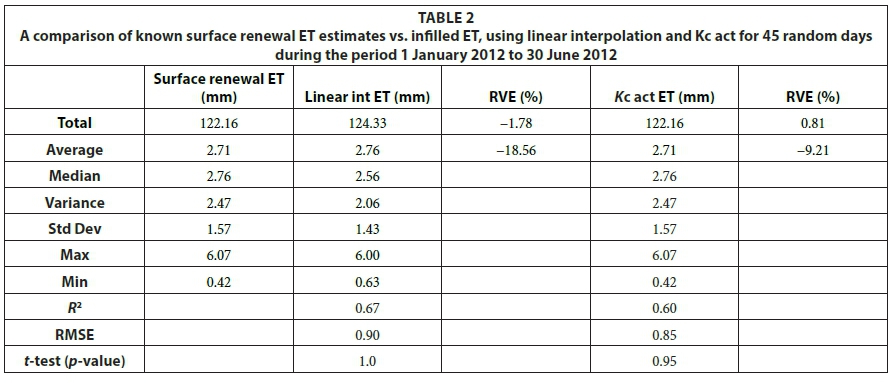
Test 1: Application of the linear interpolation technique and the Kc act technique to the observed data set
The ET estimates acquired through the application of the linear interpolation and Kc approaches were compared against the known surface renewal ET measurements which were artificially removed (Table 2). The comparison between the linear infilled ET estimates and the known surface renewal ET estimates which were artificially removed indicates that, on average, the linear infilling approach overestimated ET by approximately 20%, producing RMSE and R2 values of 0.90 mm-d1 and 0.67, respectively.
The comparison between the Kc ET estimates and the known surface renewal ET data which were artificially removed indicates that, on average, the Kc approach overestimated ET by approximately 10%, producing RMSE and R2 values of 0.60 mm-d-1 and 0.85, respectively. The ET estimates generated by both techniques were shown to be in good agreement with the known surface renewal ET data for the 45 random days. This is further supported by the results of the i-tests at the 95% confidence interval (Table 2), and graphical comparison (Fig. 4).
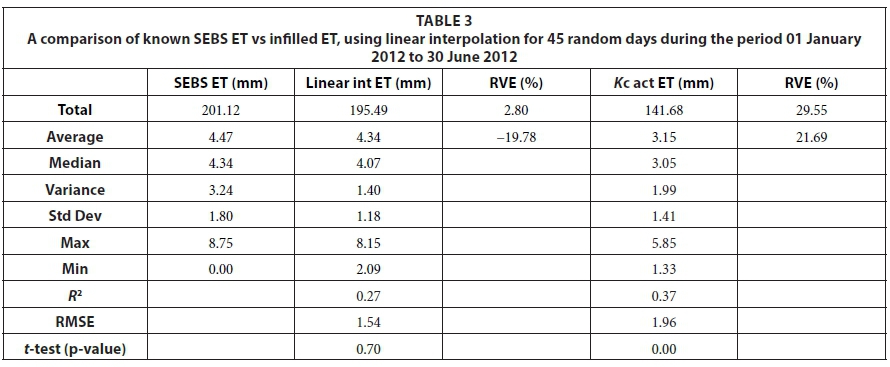
Test 2: Application of the linear interpolation technique and the Kc act technique to the SEBS dataset
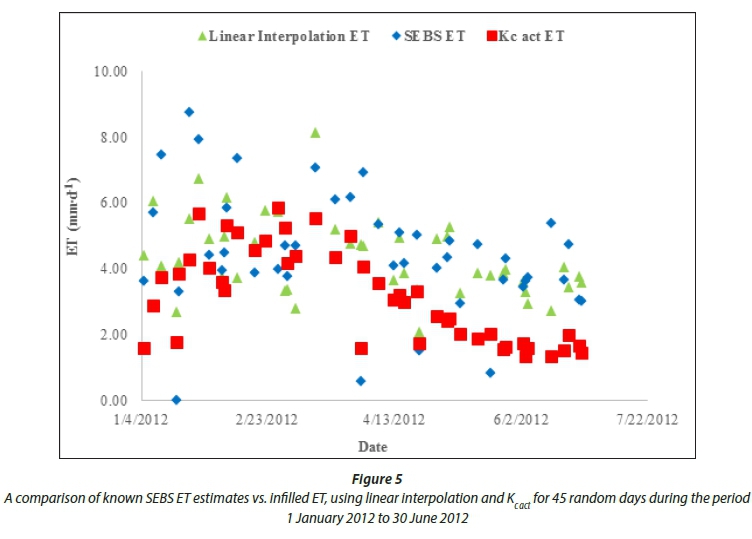
The ET estimates acquired through the application of the linear interpolation and Kc approaches were then compared against the known SEBS ET estimates which were artificially removed (Table 3) . The comparison between the linear infilled ET estimates and the known SEBS ET estimates which were artificially removed indicates that, on average, the linear interpolation approach overestimated ET by approximately 20%, producing RMSE and R2 values of 1.54 mm-d1 and 0.27, respectively. The comparison between the Kc ET estimates and the known SEBS ET estimates which were artificially removed indicates that, on average, the Kc approach underestimated ET by approximately 22%, producing RMSE and R2 values of 1.96 mm-d1 and 0.37, respectively.
Both techniques have been shown to be in poor agreement with the known surface renewal ET data for the 45 random days (see Fig. 5; Table 3). However, the results of the i-tests (Table 3) show that there is no significant difference between the means of the linear infilled ET estimates and the known SEBS ET estimates at the 95% confidence level.
The performance of the Kcact technique to estimate ET was markedly different for the two tests. The Kcact approach is based on the assumption that the conditions which were used to derive the Kcact values remain the same for the period in which it is applied. For the first test, this assumption was upheld. The surface renewal ET was generally lower than the FAO Penman-Monteith reference evaporation for the study period.
The 19 surface renewal ET estimates were also lower than the FAO Penman Monteith reference evaporation for the selected days in which Kc values were derived for Test 1. Consequently, the values acquired from the Kcact curves, which were used to infill the artificially removed surface renewal ET estimates, were representative of the conditions for the period in which the Kc approach was applied.
For the second test, the aforementioned assumption was not upheld. The SEBS ET estimates were found to be generally higher than the FAO Penman Monteith reference evaporation for the study period. However, the SEBS ET estimates were generally lower than the FAO Penman Monteith reference evaporation for the selected days in which Kc actvalues were derived for Test 2.
Consequently, the values obtained from the Kc curves, which were used to infill the artificially removed SEBS ET estimates, were not representative of the conditions for the period in which the Kc act approach was applied. The results of the two tests highlight the significance of upholding the assumption on which the Kc act approach is predicated.
The performance of the linear interpolation technique was also noticeably different for the two tests. The linear interpolation technique is a statistical approach, which does not adequately consider environmental conditions. Consequently, it was not able to capture the dynamic temporal changes associated with the SEBS ET values.
While both techniques were shown to perform poorly for Test 2, the linear interpolation technique was chosen to infill the 28 missing data records in the SEBS ET data set for the period 1 December 2011 to 25 November 2012. This decision was influenced by the marginally better performance of the linear interpolation technique compared to the Kc act approach for Test 2.
Comparison of SEBS daily ET estimates against observed historical daily ET
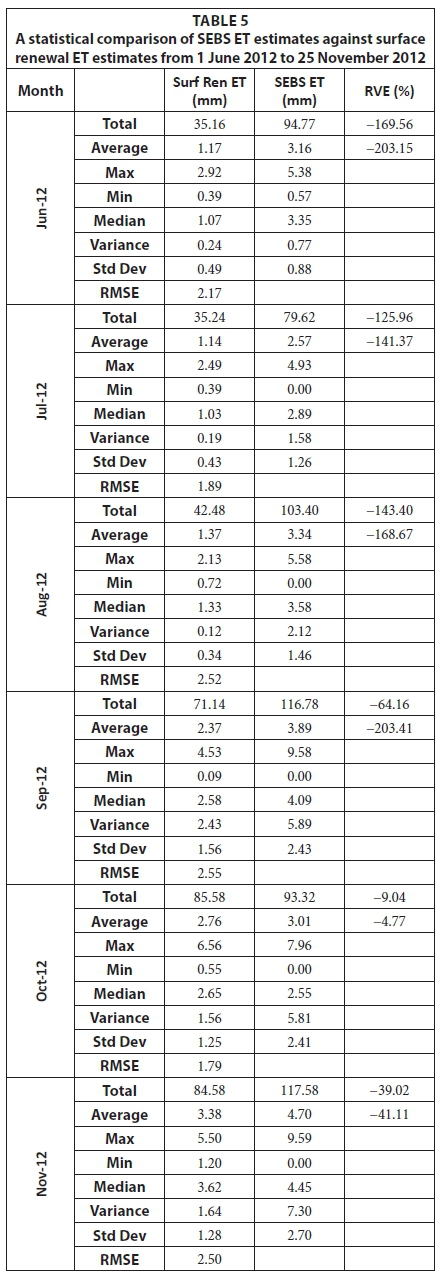
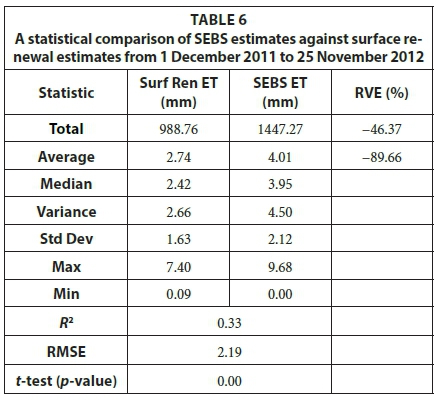
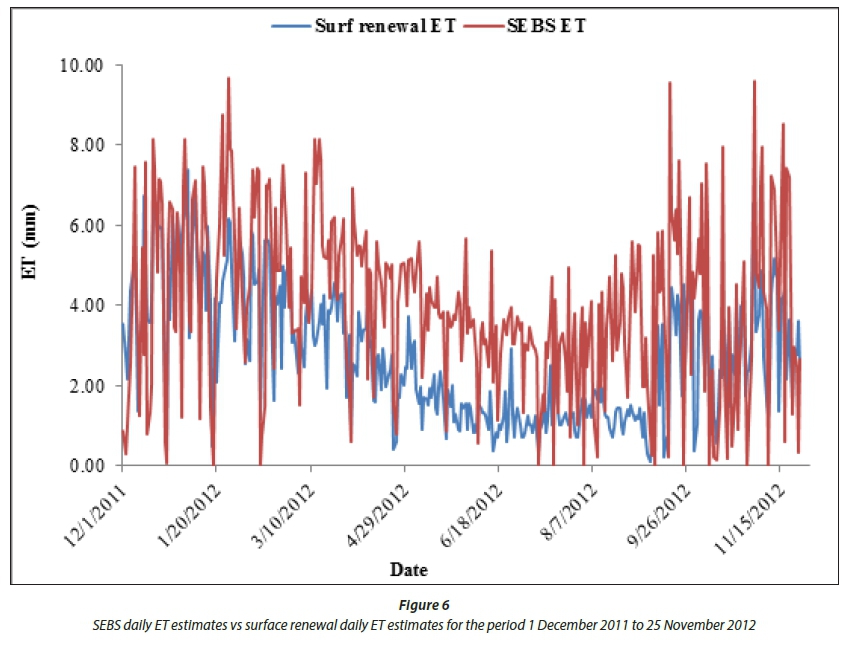
The daily ET estimates generated using SEBS for the period 1 December 2011 to 25 November 2012 were confirmed against observed surface renewal ET estimates for the corresponding period. Tables 4 and 5 provide the monthly statistical comparisons between the SEBS ET estimates and the surface renewal ET, whilst Table 6 provides the statistical comparison for the entire data collection period.
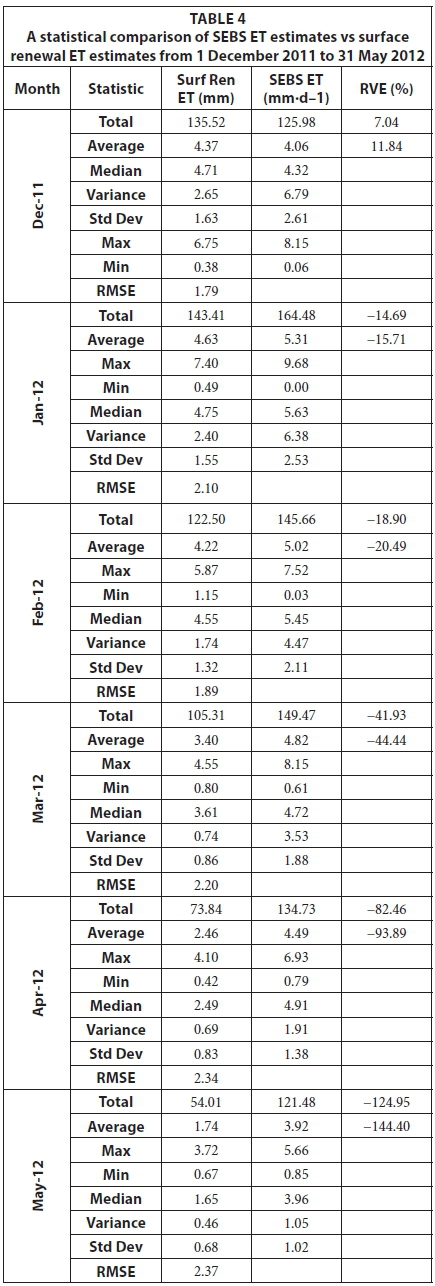
The comparison between the SEBS daily ET estimates and the surface renewal daily ET estimates shows considerable variation over the entire period. The average RVE during the months of December and January is less than 16% whilst in February it is less than 21%, which indicates a fairly good agreement between the SEBS daily ET estimates and the observed data.
The poor correlation between the surface renewal and the SEBS daily ET estimates begins from the month of March, extending until September. The average relative volume error is close to or exceeds 100%, with the exception of the month of March. This indicates that the estimates generated by SEBS are close to double that of the ET observed.
The correlation between the surface renewal and the SEBS daily ET estimates then begins to improve from October onwards. The monthly comparisons between the surface renewal and the SEBS daily ET estimates indicate that the model performed better during certain phases of the study period.
During the grand growth phase, early maturity and ripening phase and the warmer periods of the study (December 2011 to March 2012), there was a fairly good correlation between the surface renewal and SEBS daily ET estimates. However, there was a marked decline in this correlation during the cooler periods of the study for the latter stages of the maturity and ripening phase (April 2012 to June 2012), as well as the harvesting phase (11 Jun 2012).
A poor correlation was also found between the surface renewal and SEBS daily ET estimates after crop re-establishment (18 July to 28 July), most notably during the germination phase (August 2012), and early tillering phase (September 2012). The results of the statistical analyses presented in Tables 4 and 5 and the graphical representation (Fig. 6) further serve to support these observations.
The comparison between the SEBS daily ET estimates and the surface renewal ET estimates for the entire duration of the study period indicates a very poor relationship. The model over-estimated daily ET during each month, producing an average relative volume error for the time period of 89.8% and a RMSE of 2.19 mm-d-1. The results of the t-test presented in Table 6 further serve to support this observation, as there is a significant difference between the surface renewal ET estimates and the SEBS ET estimates for the entire study period, at the 95% confidence level.
The poor relationship between the SEBS estimates and the observed data is largely attributed to the difference in the spatial resolutions at which SEBS ET estimates were generated and surface renewal ET estimates were captured. This poor correlation may have been further exacerbated by: (i) variable cloud cover within a large majority of the MODIS Level 1B images used as inputs to SEBS, and (ii) the infilling of missing data for the surface renewal and the SEBS ET datasets.
The number of clear sky MODIS Level 1B images available for the study area during the period 1 December 2011 to 25 November 2012 was limited. The scattering and absorption of radiation by clouds affects the quality of the data captured for the optical and thermal bands. These bands provide the requisite data for the computational processes that are used to produce the satellite-derived input maps required for the application of SEBS. Consequently, uncertainties associated with the data captured in the abovementioned bands will be further exacerbated in the model output.
The surface renewal ET data set which was used to validate the SEBS ET estimates was not a complete record. Approximately 25% of the 361-day record was infilled, as the surface renewal system was removed just prior to harvesting and shortly after crop reestablishment (30 May 2012 to 28 July 2012), as well as for a short period in January 2012 (10 January - 30 January) (Jarmain, 2014). The infilling of the missing surface renewal ET data for the aforementioned periods may have produced values which did not accurately account for the temporal progression of ET. Consequently, comparing the SEBS ET estimates to these values, which possess some level of uncertainty, could lead to a misleading elucidation of the model's performance.
The SEBS ET estimates were generated through the use of MODIS Level 1B data, which was captured at a spatial resolution of 1 km. As a result, there are a number of land uses contributing to the SEBS ET estimate, resulting in a mixed pixel estimate. According to McCabe and Wood (2006), MODIS has a restricted ability to capture the spatial variability of energy fluxes at the field level. Consequently, inter-field variations are not detected.
The ET for the study area, during the germination phase, early tillering phase, and harvesting phase, can be expected to be low as the crop water usage is generally lower during these periods. The ET captured for the study area by the surface renewal system reflects this site-specific condition.
However, the SEBS ET estimate does not adequately represent this site-specific condition during the abovementioned phases. This is possibly due to a high inter-field spatial variability of energy fluxes, which is not detected in the SEBS ET estimate during this period. Hence, the poor correlation between the surface renewal and SEBS ET estimates.
The correlation between the surface renewal and SEBS ET estimates does improve during the latter tillering phase, grand growth and maturity, and ripening phases. This is conceivably due to a lower inter-field spatial variability of energy fluxes during this period. However, it should be noted that even during this period there still remains a general degree of disagreement between the surface renewal and SEBS ET estimates.
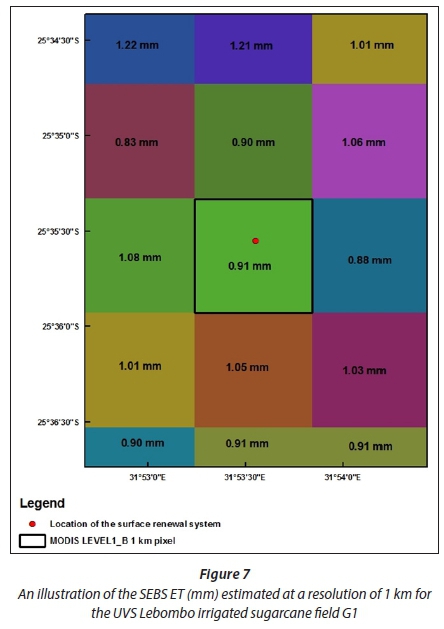
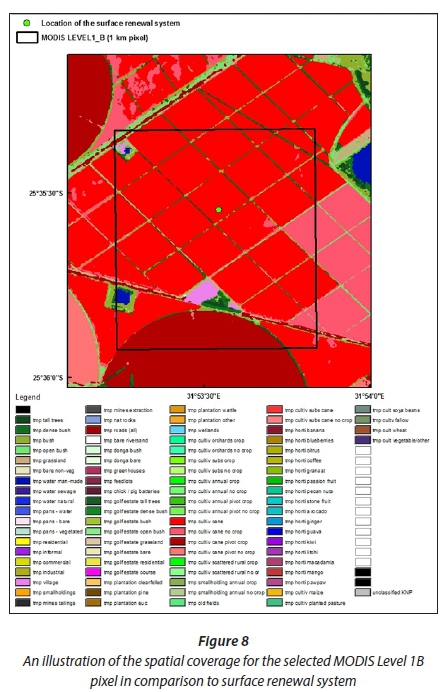
Figures 7 and 8 provide an illustration of the differences in the spatial resolution at which ET estimates are captured by the surface renewal technique and generated in SEBS. Figure 7 illustrates the SEBS ET which was estimated for the UVS Lebombo irrigated sugarcane field G1. The 1-km pixel highlighted in this figure is then overlaid on the land cover map in Fig. 8, to illustrate the different land uses contributing to the SEBS ET estimate.
CONCLUSIONS AND RECOMMENDATIONS
ET data is regarded as one of the key factors in assisting water resource management. Previous research has shown that satellite earth observation data can provide a relatively timeous and cost-effective means of acquiring spatially representative ET estimates, which are sought after by various water resource managers and planners. While there are a number of advantages of employing satellite earth observation data for water resource management purposes, the limited temporal availability of imagery can prove to be a limiting factor.
The investigations highlighted in this paper served to assess the feasibility of applying a suitable approach to infill missing ET data. Two techniques, a linear interpolation and Kc infilling approach were presented and compared. Furthermore, the ability of the SEBS model to provide reliable and representative ET estimates was assessed. This was achieved through the validation of the model output against in-situ ET estimates obtained from a surface renewal system.
The linear interpolation and Kc techniques were applied and tested to infill artificially-removed ET estimates acquired from the surface renewal system and the SEBS model. Two tests were conducted to assess the representativeness and accuracy of these techniques. Both techniques were shown to reliably estimate the artificially-removed ET values for Test 1. However, the performance of both noticeably decreased for Test 2. This poor performance was largely attributed to the nature of the SEBS ET estimates derived for the study period.
While both techniques were found to perform poorly for Test 2, the linear interpolation technique was chosen to infill missing data records in the SEBS ET dataset for the study period. This decision was predicated on the marginally better performance of the linear interpolation technique for Test 2.
The linear interpolation technique can provide a suitable option to infill missing ET data as there are minimal data requirements. However, it should be noted that the application of this technique may oversimplify the ET process, as this approach does not adequately represent dynamic changes in hydro-meteorological fluxes.
In principle, the application of Kcact would be recommended, as it is a more physically based approach. However, the technique is data intensive, as requisite meteorological data for the estimation of the FAO Penman-Monteith reference evaporation is required for the application of this technique. Furthermore, the successful application of this technique is largely based on satisfying the assumption on which the technique is predicated.
ET estimates acquired from a surface renewal system were used to validate the SEBS ET estimates. The surface renewal system provided ET estimates for site-specific conditions: therefore the ET was representative of only the irrigated sugarcane field. However, the SEBS ET estimate consisted of a number of land uses within the MODIS pixel (1 km), all of which contribute to the ET for that pixel. Consequently, the SEBS ET is largely a mixed-pixel estimate.
The use of MODIS imagery to derive ET in SEBS does not adequately represent the inter-field spatial variability of energy fluxes. This proved to be a significant limitation to this study. The SEBS model was shown to consistently overestimate ET when compared to the surface renewal technique for the entire study period. It is conceivable that this poor correlation is largely due to the SEBS ET providing an inadequate representation of the in-situ conditions.
As a result, it is difficult to assess the true performance of the model in comparison to the surface renewal system, as there are various sources of error which could be responsible for the poor correlation in this study. These may include: a flawed conceptualization within the model, the restricted ability of MODIS data to adequately detect inter-field spatial variability of energy fluxes, processing errors or a combination of the aforementioned factors.
Ideally, comparative analyses of the satellite-derived ET generated, through the application of models or algorithms, should be done at representative spatial scales, as it may enable more accurate interpretations of their potentials or limitations. This will in turn assist in determining how best to apply these techniques to assist water resource management.
While the abovementioned limitation could not be overcome in this study due to capacity constraints, the application of downscaling procedures can be considered for future investigations. Downscaling procedures attempt to increase spatial resolution through the disaggregation of the original dataset (Bierkens et al., 2000). The application of such procedures will allow for direct comparisons to be made at a daily time step between the SEBS ET estimates and site specific ET measured in-situ. Additionally, the SEBS ET estimates derived using MODIS can be validated against other conventional approaches which possess a larger measurement footprint.
ACKNOWLEDGEMENTS
The authors would like to extend their gratitude to the Water Research Commission (WRC) and the National Research Foundation (NRF) for the funding required to successfully complete this research. Furthermore, thanks are extended to Dr C Jarmain and the Agricultural Research Council Institute for Soil, Climate and Water (ARC-ICSW) for the provision of the validation data and meteorological data used in this study.
REFERENCES
ALLEN RG, PEREIRA LS, RAES D and SMITH M (1998) Crop evapo-transpiration: Guidelines for computing crop water requirements. FAO Irrigation and Drainage Paper 56. FAO, Rome. 300 pp. [ Links ]
ALLEN RG, PEREIRA LS, SMITH M, RAES D and WRIGHT JL (2005) FAO-56 dual crop coefficient method for estimating evaporation form soil and application extensions. J. Irrig. Drain. Eng. 131 (1) 2-13. http://dx.doi.org/10.1061/(ASCE)0733-9437(2005)131:1(2) [ Links ]
ALLEN R, TASUMI M, MORSE A, TREZZA R, WRIGHT J, BASTIAANSSEN W, KRAMBER W, LORITE I and ROBISON C (2007) Satellite-based energy balance for mapping evapotranspiration with internalized calibration (METRIC)-applications. J. Irrig. Drain. Eng. 133 (4) 395-406. http://dx.doi.org/10.1061/(ASCE)0733-9437(2007)133:4(395) [ Links ]
BASSON MS and ROSSOUW JD (2003) Inkomati Water Management Area overview of water resources availability and utilization. National Water Resource Strategy Final Report. BKS Report No. H141405, DWAF Report No. PWMA 05/090/00/0203. Department of Water Affairs and Forestry, Pretoria. [ Links ]
BASTIAANSSEN WGM and HARSHADEEP NR (2005) Managing scarce water resources in Asia: The nature of the problem and can remote sensing help? Irrig. Drain. Syst. 19 269-284. http://dx.doi.org/10.1007/s10795-005-5188-y [ Links ]
BHATTARAI N, QUACKENBUSH LJ, DOUGHERTY M and MARZEN LJ (2015) A simple Landsat-MODIS fusion approach for monitoring seasonal evapotranspiration at 30 m spatial resolution. Int. J. Remote Sens. 36 (1) 115-143. http://dx.doi.org/10.1080/01431161.2014.990645 [ Links ]
ELHAG M, PSILOVIKOS A, MANAKOS, I and PERAKIS K (2011) Application of the SEBS water balance model in estimating daily evapo- transpiration and evaporative fraction from remote sensing data over the Nile Delta. Water Resour. Manage. 25 2731-2742. http://dx.doi.org/10.1007/s11269-011-9835-9 [ Links ]
FERNANDEZ-PRIETO D, VAN OEVELEN P, SU Z and WAGNER W (2012) Advances in Earth observation for water cycle science. Hydrol. Earth Syst. Sci. 16 543-549. http://dx.doi.org/10.5194/hess-16-543-2012 [ Links ]
GIBSON LA, M'UNCH Z and ENGELBRECHT J (2011) Particular uncertainties encountered in using a pre-packaged SEBS Model to derive evapotranspiration in a heterogeneous study area in South Africa. Hydrol. Earth Syst. Sci. 15 295-310. http://dx.doi.org/10.5194/hess-15-295-2011 [ Links ]
GOWDA PH, CHAVEZ JL, COLAIZZI PD, EVETT SR, HOWELL TA and TOLK JA (2007) ET mapping for agricultural water management: present status and challenges. Irrig. Sci. DOI 10.1007/s00271-007-0088-6. http://dx.doi.org/10.1007/s00271-007-0088-6 [ Links ]
HONG S, HENDRICKX JMH and BORCHERS B (2011) Down-scaling of SEBAL derived evapotranspiration maps from MODIS (250 m) to Landsat (30 m) scales. Int. J. Remote Sens. 32 (21) 6457-6477. http://dx.doi.org/10.1080/01431161.2010.512929 [ Links ]
JARMAIN C, BASTIAANSSEN W, MENGISTU MG, JEWITT G and KANGO V (2009) A methodology for near-real time spatial estimation of evaporation. WRC Report No. 1751/1/09. Water Research Commission, Pretoria. [ Links ]
JARMAIN C, SINGELS A, OBANDO E, PARASKEVOPOULOS A, OLIVIER F, MUNCH Z, VAN DER MERWE B, WALKER S, VAN DER LAAN M, FESSEHAZION M and CO-AUTHORS (2013) Water use efficiency of irrigated agricultural crops determined with satellite imagery. WRC Project No. K5/2079//4, Deliverable 6: Water use efficiency report 2012/13. Water Research Commission, Pretoria. [ Links ]
JARMAIN C (2014) Personal communication, 29 January 2014. Dr Caren Jarmain, independent researcher, Stellenbosch University, South Africa. [ Links ]
JIN X, WAN L and SU Z (2005) Research on evaporation of Taiyuan basin area by using remote sensing. Hydrol. Earth Syst. Sci. Discuss. 2 209-227. http://dx.doi.org/10.5194/hessd-2-209-2005 [ Links ]
KONGO VM and JEWITT GPW (2006) Preliminary investigation of catchment hydrology in response to agricultural water use innovations: A case study of Potshini Catchment - South Africa. Phys. Chem. Earth 31 976-987. http://dx.doi.org/10.1016/j.pce.2006.08.014 [ Links ]
LI Z, TANG R, WAN Z, BI Y, ZHOU C, TANG B, YAN G and ZHANG X (2009) A review of current methodologies for regional evapo-transpiration estimation from remotely sensed data. Sensors 9 (5) 3801-3853. http://dx.doi.org/10.3390/s90503801 [ Links ]
LI X, LI XW, ROTH K, MENENTI M and WAGNER W (2011) Observing and modeling the catchment scale water cycle. Hydrol. Earth Syst. Sci. 15 597-601. [ Links ]
LONG D and SINGH VP (2012) A modified surface energy balance algorithm for land (M-SEBAL) based on a trapezoidal framework. Water Resour. Res. 48 W02528. DOI:10.1029/2011WR010607. http://dx.doi.org/10.1029/2011WR010607 [ Links ]
MA W, MA Y, HU Z, SU Z, WANG J and ISHIKAWA H (2011) Estimating surface fluxes over middle and upper streams of the Heihe River Basin with ASTER imagery. Hydrol. Earth Syst. Sci. 15 1403-1413. http://dx.doi.org/10.5194/hess-15-1403-2011 [ Links ]
MA W, HAFEEZ M, ISHIKAWA, H and MA Y (2012) Evaluation of SEBS for estimation of actual evapotranspiration using ASTER satellite data for irrigation areas of Australia. Theor. Appl. Climatol. 112 (3) 609-616. http://dx.doi.org/10.1016/j.atmosres.2013.10.020 [ Links ]
MA W, MA Y and ISHIKAWA H (2014) Evaluation of the SEBS for upscaling the evapotranspiration based on in-situ observations over the Tibetan Plateau. Atmos. Res. 138 91-97. [ Links ]
MCCABE MF and WOOD EF (2006) Scale influences on the remote estimation of evapotranspiration using multiple satellite sensors. Remote Sen. Environ. 105 271-285. http://dx.doi.org/10.1016/j.rse.2006.07.006 [ Links ]
MENENTI M and CHOUDHURY B (1993) Parameterization of land surface evaporation by means of location dependent potential evaporation and surface temperature range. Proceedings of IAHS confer ence on Land Surface Processes. IAHS Publ. 212 561-568. [ Links ]
MU Q, HEINSCH FA, ZHAO M and RUNNING SW (2007) Development of a global evapotranspiration algorithm based on MODIS and global meteorology data. Remote Sens. Environ. 11 519-536. http://dx.doi.org/10.1016/j.rse.2007.04.015 [ Links ]
MUHAMMED AH (2012) Satellite based evapotranspiration estimation and runoff simulation: A top model application to the Gilgel Abay Catchment, Ethiopia. Msc Thesis, Enschede, The Netherlands. [ Links ]
PARDO N, SANCHEZ LM, TIMMERMANS J, SU Z, PEREZ IA and GARCIA MA (2014) SEBS validation in a Spanish rotating crop. Agric. For. Meteorol. 195-196 132-142. http://dx.doi.org/10.1016/j.agrformet.2014.05.007 [ Links ]
NASA (2014) Global maps. URL: http://earthobservatory.nasa.gov/GlobalMaps/ (Accessed November 2014). [ Links ]
NILE ES (2010) Sensible heat flux estimation under unstable conditions for sugarcane using temperature variance and surface renewal. PhD thesis, University of KwaZulu-Natal, Pietermaritzburg, South Africa. 190 pp. [ Links ]
RWASOKA DT, GUMINDOGA W and GWENZI J (2011) Estimation of actual evapotranspiration using the Surface Energy Balance System (SEBS) algorithm in the Upper Manyame Catchment in Zimbabwe. Phys. Chem. Earth 36 736-746. http://dx.doi.org/10.1016/j.pce.2011.07.035 [ Links ]
SANTOS C, LORITE IJ, TASUMI M, ALLEN RG and FERERES E (2008) Integrating satellite-based evapotranspiration with simulation models for irrigation management at the scheme level. Irrig. Sci. 26 277-288. http://dx.doi.org/10.1007/s00271-007-0093-9 [ Links ]
SAVAGE MJ, EVERSON CS, ODHIAMBO GO, MENGISTU MG and JARMAIN C (2004) Theory and practice of evaporation measurement, with a special focus on SLS as an operational tool for the estimation of spatially-averaged evaporation. WRC Report No. 1335/1/04. Water Research Commission, Pretoria. [ Links ]
SENAY GB, BUDDE M, VERDIN JP and MELESSE AM (2007) A coupled remote sensing and simplified surface energy balance approach to estimate actual evapotranspiration from irrigated fields. Sensors 7 (6) 979-1000. http://dx.doi.org/10.3390/s7060979 [ Links ]
SU Z, SCHMUGGE T, KUSTAS WP and MASSMAN WJ (2001) An evaluation of two models for estimation of the roughness height for heat transfer between the land surface and the atmosphere. J. Appl. Meteorol. 40 (10) 1933-1951. http://dx.doi.org/10.1175/1520-0450(2001)040<1933:AEOTMF>2.0.CO;2 [ Links ]
SU Z (2002) The Surface Balance Energy System (SEBS) for estimating turbulent heat fluxes. Hydrol. Earth Syst. Sci. 6 (1) 85-99. http://dx.doi.org/10.5194/hess-6-85-2002 [ Links ]
SU Z and WANG L (2013) Earth Observation of Water Resources (SEBS). Practical Session Instructions (July 2013). ITC, University of Twente, The Netherlands. [ Links ]
VAN DER KWAST J, TIMMERMANS W, GIESKE A, SU Z, OLIOSO A, JIA L, ELBERS J, KARSSENBERG D and DE JONG S (2009) Evaluation of the Surface Energy Balance System (SEBS) applied to Aster imagery with flux-measurements at the SPARC 2004 site (Barrax, Spain). Hydrol. Earth Syst. Sci. Discuss. 6 1165-1196. http://dx.doi.org/10.5194/hessd-6-1165-2009 [ Links ]
VAN DIJK AI and RENZULLO LJ (2011) Water resource monitoring systems and the role of satellite observations. Hydrol. Earth Syst. Sci. 15 39-55. http://dx.doi.org/10.5194/hess-15-39-2011 [ Links ]
XU X, LI J and TOLSON BA (2014) Progress in integrating remote sensing data and hydrologic modelling. Prog. Phys. Geogr. 38 (4) 464-498. http://dx.doi.org/10.1177/0309133314536583 [ Links ]
YANG D, CHEN H and LEI H (2010) Estimation of evapotranspiration using a remote sensing model over agricultural land in the North China Plain. Int. J. Remote Sens. 31 (14) 3783-3798. http://dx.doi.org/10.1080/01431161.2010.483492 [ Links ]
ZHUO G, BA L, CIREN P and BU L (2014) Study on daily surface evapotranspiration with SEBS in Tibet Autonomous Region. J. Geogr. Sci. 24 (1) 113-128. http://dx.doi.org/10.1007/s11442-014-1076-4 [ Links ]
Received 22 January 2015
Accepted in revised form 27 September 2016
* To whom all correspondence should be addressed. e-mail: shaedengokool@gmail.com

