


Servicios Personalizados
Articulo
 Inglés (pdf)
 Articulo en XML
 Referencias del artículo
Indicadores

Links relacionados
-
 Citado por Google
 -
 Similares en Google
Compartir

 Permalink
Water SA
versión On-line ISSN 1816-7950
versión impresa ISSN 0378-4738
Water SA vol.42 no.4 Pretoria oct. 2016
http://dx.doi.org/10.4314/wsa.v42i4.16
Water quality modelling and optimisation of wastewater treatment network using mixed integer programming
Christopher MahlathiI, *; Njabulo SiyakatshanaI; Evans ChirwaII
IAdvanced Mathematical Modelling, Modelling and Digital Science, Council for Scientific and Industrial Research, 158 Meiring Naudê, Brummeria, Pretoria, South Africa
IIWater Utilisation and Environmental Engineering Division, Department of Chemical Engineering, University of Pretoria, South Africa
ABSTRACT
Instream water quality management encompasses field monitoring and utilisation of mathematical models. These models can be coupled with optimisation techniques to determine more efficient water quality management alternatives. Among these activities, wastewater treatment plays a crucial role. In this work, a Streeter-Phelps dissolved oxygen model (DO) is implemented in a semi-hypothetical Upper Olifants River system to forecast instream dissolved oxygen profiles in response to different wastewater discharge scenarios. A mixed integer programming (MIP) numerical approach was used in the simulation and determination of the best treatment regimen to meet the instream DO standard at the minimum cost for the chosen river catchment. The Olifants River catchment modelled in this study features 9 wastewater treatment plants. Three treatment levels were evaluated for biochemical oxygen demand (BOD) and the impact was evaluated at specific measuring points (checkpoints) within the river system. Using this model, it was demonstrated that water quality standards can be met at all monitoring points at a minimum cost by simultaneously optimising treatment levels at each treatment plant.
Keywords: instream water quality, mixed integer optimisation, wastewater treatment levels, Streeter-Phelps DO model, Upper Olifants River
INTRODUCTION
Rapid water resource depletion and pollution of available water resources has led to the decline of available water resources for human consumption. In South Africa, it is projected that water resources will reach critical levels by 2025 (Basson et al., 1997). The fast-growing population accompanied by high migration rate to urban areas and the increased water demand due to industrialisation threaten to expedite the projected impending water crisis in South Africa. The increasing rate of urbanisation and industrialisation escalates the demand for freshwater and thus a crisis of water shortage. Additionally, South Africa is a developing country with a growing economy and vast mining opportunities. Monitoring of further mining and development activities in vulnerable water bodies such as the Wilge River, part of the Olifants River basin, should be managed and monitored to avoid further water quality deterioration (Dabrowski et al., 2014).
Recently, the work of Saremi et al. (2010) has illustrated the use of multi-optimal waste models with linear programming to model the environmental capacity of the Haraz River (Mazandaran Province, Iran), with BOD being the output parameter. This work produced non-uniform removal rate for pollution based on the minimum cost method. The effectiveness of this approach can be further corroborated by the work of Liu et al. (2011), in which a mixed integer optimisation (MIO) approach was applied on an integrated resource management problem at two Greek islands (Syros and Paros-Antiparos), and the recent work of Gikas et al. (2015) in optimal planning of water and wastewater management infrastructure. Other complex optimisation algorithms exist, such as the modified fuzzy credibility constrained programming approach (Li et al., 2015) and interval two-stage stochastic integer programming approach (Mo et al., 2015), which were applied to agricultural water resource management and urban water resource management, respectively, in recent studies. The complexity of such models is limited by available computational capabilities and hence a simpler approach with relative low accuracy becomes more applicable. The success of these models served as motivation for application of this approach in the water management field, in our case, using the Olifants River catchment as the case study area.
Application of these methods to regional water management systems dates back to the early 1970s, when the earliest model of Fan et al. (1971, cited in Finney et al., 1977) determined an optimal waste discharge policy along a stream by minimising the total cost of maintaining water quality standards on a regional basis. Sasikumar et al. (1998) introduced the application of fuzzy optimisation for water quality management in river systems; more work on a similar topic followed by Mujumdar and Vemula (2004).
In South Africa, increasing water usage by many emerging industries and high wastewater generation from the resulting operational processes contribute significant amounts of polluted discharges to the otherwise already-stressed surface water systems. Rivers and reservoirs are especially vulnerable to pollution since they are viewed as readily accessible pollution dilution zones. The Upper Olifants River in Mpumalanga Province, flowing through the energy heartland of South Africa, is one of the most utilised river systems for municipal, industrial and mining wastewater effluents in South Africa. The Upper Olifants River ultimately flows through some of the most environmentally sensitive areas in the country and the water finally enters the Kruger National Park where the pollution threatens both aquatic flora and fauna in the river and terrestrial animals in the park.
Among the known industrial impacts on the Upper Olifants catchment are from coal mining and other industrial activities in the Witbank and Wilge area (Beumer et al., 2011). For this reason, it has become a necessity to develop an integrated plan for this catchment, to reverse, or at least halt, the pollution trend in this river system. Several water management methods exist, some of which, if applied effectively, could remedy the problem. An interesting study by Ali et al. (2002) focused on stream water quality management for the Paint Creek Watershed (West Virginia, USA), which is similarly bedevilled by mining activities and suffers from acidic pollution. The authors used a stochastic formulation of the temporal variation of water flow and acidity levels, which they incorporated into a cost optimisation model for 9 water treatment technologies for treating the acidity resulting from acid mine drainage (AMD) pollution.
The objective of this study is to apply a simple stream simulation water quality model to a semi-hypothetical catchment. The stream simulation model consisting of two Streeter-Phelps DO and BOD equations was used to predict DO and BOD concentration at the theoretical measuring points in the river system which served as constraints for the optimisation problem. A MIPL (mixed integer linear programming) optimisation routine was used to optimise the treatment level and minimise treatment cost to achieve set water quality standards. The model consisted of one treatment cost objective function with treatment level as a decision variable, and one constraints equation applicable to all theoretical measuring points.
METHODOLOGY
The catchment selected for this study consists of the Upper Olifants River and one primary tributary. The tributary drains into the Olifants River at the confluence 'L' and receives wastewater and mine process water discharges at Points 4-9 (Fig. 1). The studied section of the main Olifants River received wastewater from 3 wastewater treatment plants at Points 1-3. Figure 1 is a graphical representation of the Upper Olifants River and the main tributary.
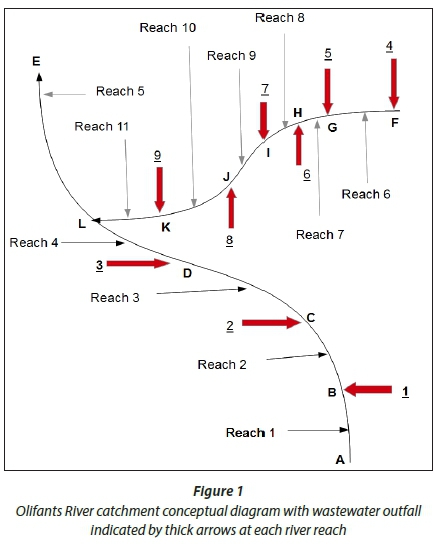
In Fig. 1, the regions A, B, C, D and E represent the main Olifants stream and F, G, H, I, J, K and L represent the tributary (branched stream) with the confluence located at Point L. The waste point loads are numbered and referred to as illustrated in Fig. 1 throughout this paper. The map of the region selected is shown by Fig. 2 with the flow rates indicated at the monitoring stations.
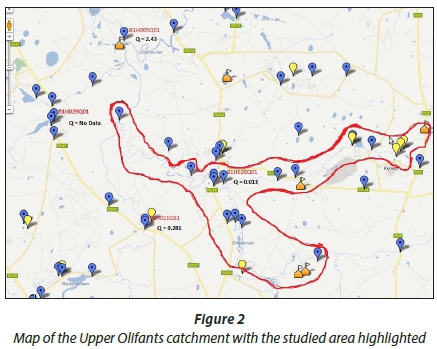
The icons on the map represent sections where data were collected and measured for each section of the studied catchment. During model selection, model robustness and accuracy in evaluating sparse data without poor convergence was considered. The chosen modelling technique was inspired by recent successes in applying similar models for wastewa-ter management optimisation. One such model by Bishop and Grenney (1976, cited in Finney et al., 1977) utilised a coupled-simulation water quality model earlier derived by Finney et al. (1971), who formulated an optimal waste discharge policy along a stream by minimising the total cost of maintaining water quality standards on a regional basis. In a follow-up study, Arbabi and Elzina (1975, cited in Finney et al., 1977) used a linear approach to meet system water quality standards for DO at minimum cost on the Willamette River (Oregon, USA).
Dissolved oxygen stream water quality model
In the early 1920's, Streeter and Phelps (1925) used a non-linear first-order kinetic model to represent the oxygen concentration response as a deficit due to organic loading from an upstream outfall. The model predicts that oxygen deficit in the river is a maximum at a point where the deoxygenation rate and re-oxygenation rate in the river is balanced. The point at which the two processes balance is referred to as the point of critical deficit and marks the point where the river's recovery trajectory begins. The Streeter-Phelps model is used to predict the instream DO concentration during the load impact assessment of a river. The model is selected for its simplistic nature and the fact that it has been applied successfully and yielded good results in several studies, such as the work of Saremi et al. (2010). The Streeter-Phelps oxygen sag model is represented by the following equations, Eq. 1 and Eq. 2, for organic decay and oxygen deficit response with increasing distance from the outfall point x0.
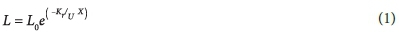
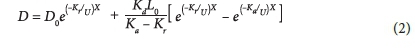
where: U is the average stream velocity (m/day), L is the concentration of oxidisable organic material (mg/L) as oxygen equivalents which is BOD, x is the distance (m) along the reach moving downstream and D is the oxygen deficit (mg/L), i.e., the difference between saturation DO of the water body (DO) and the actual DO concentration, K is the surface re-aeration rate coefficient (d-1), Kr is the total removal rate coefficient (d-1) of organic matter, K, is the oxidation rate coefficient in the stream and K =d rKd, + Ks, where K is the net rate coefficient of sedimentation and re-suspension (d-1) of BOD. The initial conditions at the outfall (time zero) are given by L = L0 and D = D0. The DO concentration can be varied with distance x in meters by dividing time with stream velocity U as presented in Eq. 2. The parameters Kaand Kd, were used to calibrate the model. The Gauss-Newton non-linear regression algorithm adapted from Siyakatshana (2006) was used to calibrate the model.
Equations 1 and 2 were solved simultaneously using GNU Octave Version 3.2 software (Free Software Foundation, Boston, MA). A function named Reach_Solver was created to carry out the stream simulation computations. The catchment was divided into segments of uniform water quality properties called reaches. The Reach_Solver function accepted reach length X, stream velocity U, D0, L0, Ka and Kd as inputs, and it produced DO concentration at location x along the river as an output. This output was used as part of the constraints required for the stream optimisation model.
Mixed integer optimisation
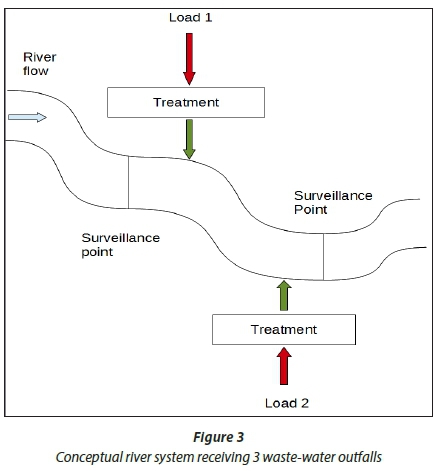
The method used in this study was adopted from Finney et al. (1977). The elements required for implementation of the Reach_Solver function are illustrated schematically in Fig. 3. The parameters that were evaluated and their relative scheme of evaluation are listed below:
i. X Bp = B [(bc)p] = a vector of pollution concentration limitations (stream standards) for c species, at each surveillance point p;
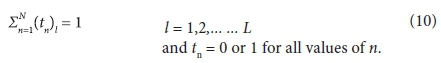
ii. T1 = (tn)l= an integer vector (tn= 1 or 0) indicating which treatment level, n, is provided: tn = 0 if level not provided, tn= 1 if level is provided;
iii. Y°p= (Yoc)p= vector of concentrations for c species, at each surveillance point p, resulting from existing stream loading;
iv. Yl,p= (Yc,n)l,p= matrix of species c concentrations occurring at surveillance point p, for treatment level n, being applied at load l and existing treatment at the remainder of the loads. That is, it represents the concentrations resulting at p if only load l was given additional treatment; and
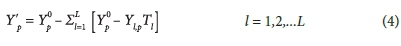
v. Y'k = (Y'c)p= vector of concentrations for each species c, at each surveillance point p, resulting from the optimal loading scheme determined by the model.
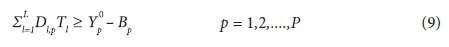
The following indices were used for the different parameters: p = surveillance point index, 1,2,... P; n = treatment level index = 1,2,... N; l = load index 1,2,...L; and c = water quality species index = 1,2,... C.
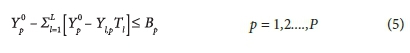
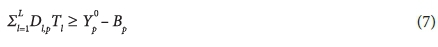
Assuming that the concentration of each species must be less than the stream standard at each surveillance point:

For a linear system the following linear constraint equation formulation holds
Therefore:
We then define:
Dl,p = (dc,l)l,k= a matrix representing the change from the existing concentration of species c at surveillance point p when treatment level n is applied at load l
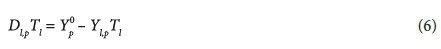
Substituting into previous equation:
Finally we define:
C = (cn)l= a vector of treatment costs for treatment level n at load l.
Nonlinearities in cost functions are accounted for since a specific cost is associated with each treatment scheme. The optimisation method chosen for this system would have to be altered to incorporate the influence of non-linearity, which would result in transforming the optimization task in the context of mixed integer nonlinear programming (MINLP) (D' Ambrosio et al., 2015). The mixed integer programming problem to minimise treatment cost can then be structured as follows:

Subject to the set of constraints:
1. Water quality stream standards
2. Integer solution for treatment levels and only one treatment level per load
Combined simulation and optimisation model
The optimisation model was linked to the simulation model by a single parameter, the 'D'matrices. The D matrix is conveniently generated by the stream simulation model using the following procedure:
1. Calculate Yp0from existing loading
2. Apply the first treatment level at the first load and calculate
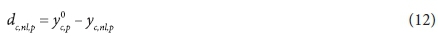
3. Calculate the matrices 'D', with

where: vector Z is defined as follows Z = zla vector with each element equals to 1.0, i.e., each element in Dl,pis simply calculated as:
4. Repeat Steps 2 and 3 for each treatment level.
5. Repeat Steps 2, 3, and 4 for each load.
Constraint 1 is based on a linear system and is not necessarily valid for non-linear quality relationships. For such relations, an iterative technique between the simulation model and optimisation model is required. The mixed integer problem was solved using Octave's built-in linear mixed-integer optimisation function glpk.
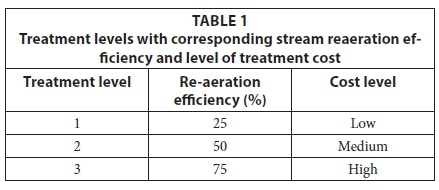
Treatment levels
Typically wastewater treatment levels are designated as follows: Level 1 (primary treatment) is responsible for the physical removal of most of the suspended solids in the wastewater. The treatment process takes place in 3 stages and unit processes, namely: bar screening, grit removal, and sedimentation. Level 2 (secondary treatment) consists of biological treatment processes, in which the remaining suspended solids from the primary treatment and dissolved organic wastes are bio-oxidised. At this stage biological treatment occurs, whereby micro-organisms convert suspended solids into settleable solids followed by sedimentation of the solids. Level 3 (tertiary treatment) involves further treatment of secondary treatment effluent, usually by chemical means or expensive physical means such as filtration, nutrient removal processes and U/V radiation, thereby providing a significant increase in the water quality. A common example of a tertiary treatment process is chemical water treatment. In this work, the relationship between treatment levels and efficiency was assumed and is represented in Table 1 and was also based on the fact that the higher the treatment level required, the more expensive the treatment becomes. Coupling of stream simulation models and mixed integer programming has proven to be a valuable tool in water management studies (Finney et al., 1977; Margeta, 1984). The approach to such problems was implemented and illustrated through the work of Liu et al. (2011) where mixed integer optimisation approach was used on an integrated resource management problem. The success of the method inspired the decision to apply it to the Olifants River catchment in this study
Data and calculation
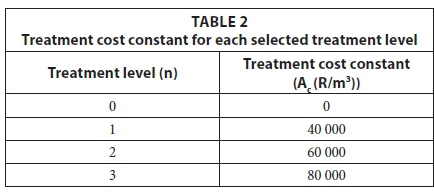
Since the available effluent discharge data are sparse, only nominal time-averaged values from baseline data were used as initial conditions for BOD loading from each effluent discharge point. The initial conditions (BOD concentration and flow rate) were applied to the stream simulation model to generate the constraint equations for the system in order to solve the optimisation problem. The BOD concentration of the effluent at each treatment plant before additional treatment was set to a nominal value of 50 mg/L and the load flow rates were set to a value approximately 10% of the flow rate of the receiving water body. Equation 14 provides the objective function with cost coefficients for each treatment level. This equation structure was adapted from Finney et al. (1977) for treatment cost calculations and was used in this study as a basis for cost calculations.

where: Q = effluent discharge flow rate (m3/day) and Ac is a constant which varies for each treatment level (monetary units/ flow units) and 'treatment cost' refers the total operational cost for each treatment level. Table 2 shows values of Acfor each treatment cost. The values of Acwere assumed while considering the fact that higher treatment levels should cost more that lower treatment levels; hence the numerical values increase with an increase in treatment level. Any values of Ac could be selected to represent each treatment level provided those coefficient values increase with increasing treatment levels.
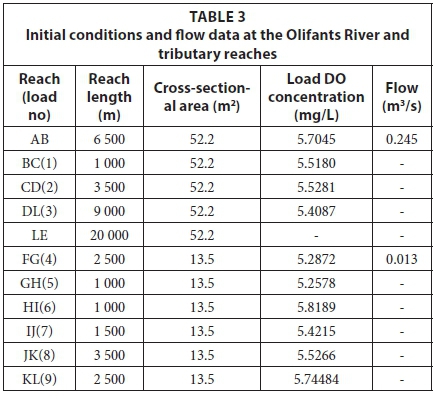
Under these conditions, the optimisation model was constructed suitably to be solved using Octave's built-in function glpk for solving mixed integer problem. Water quality data for the Olifants catchment are represented in Table 3.
RESULTS AND DISCUSSION
The initial conditions at each theoretical measuring point (checkpoint) before optimisation were inputted and the suggested optimal treatment levels to be applied at each checkpoint are presented in Table 4. At Checkpoints 1 to 3 and Confluence 4, set water quality standards are not met therefore further treatment is required.
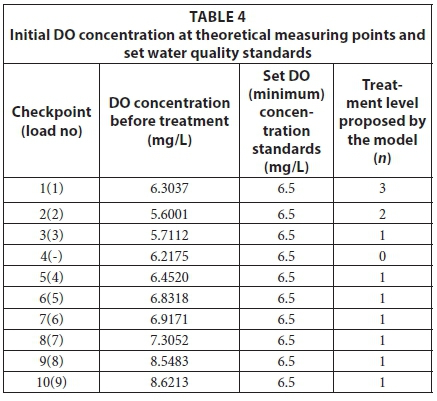
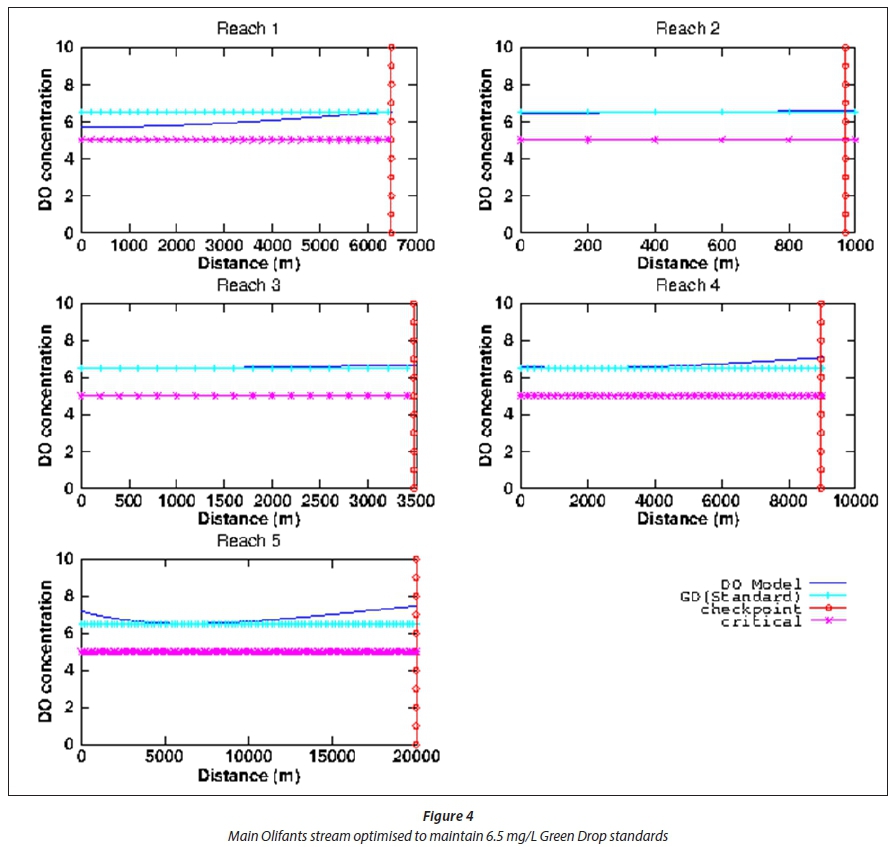
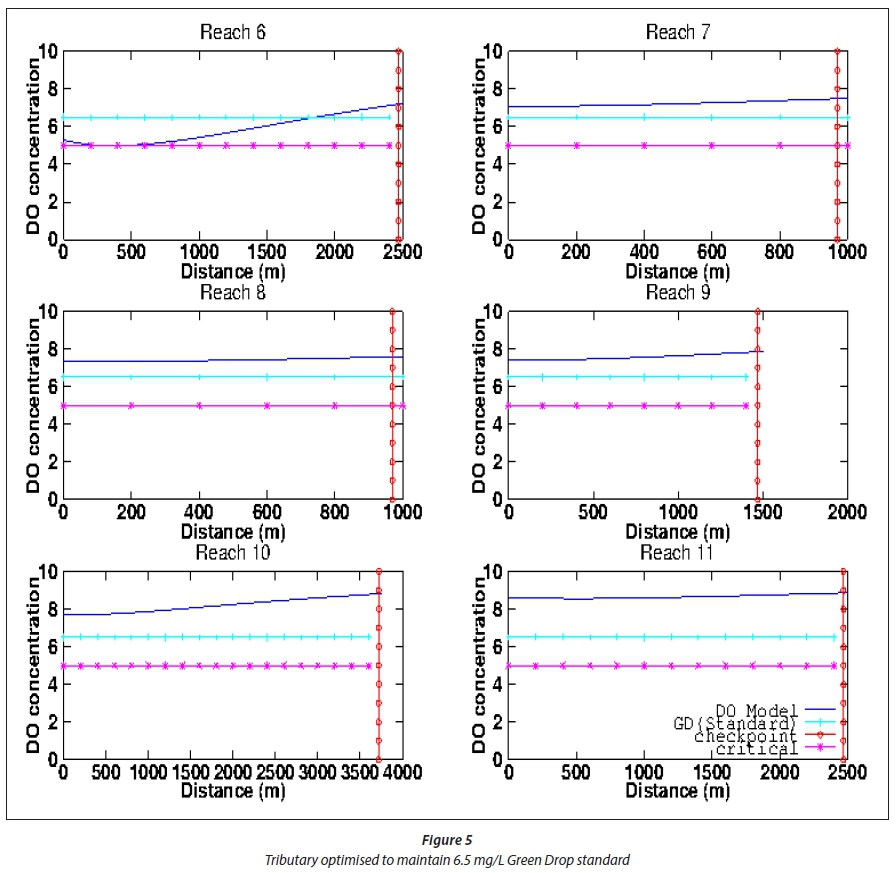
As expected, the solution suggested further treatment for sections of the river where violations occurred, with the exception of the confluence since there is no treatment plant at this location. However, the concentration at this point is affected by the treatment that occurs at other checkpoints. Treatment Level 1 is the minimum treatment that can be applied with minor changes in BOD concentration occurring and Treatment Level 3 is the highest treatment level applicable. The data in Figs 4 and 5 show the DO concentration, Green Drop standards across each reach as well as the location of the theoretical measuring points (depicted by the vertical, red dotted lines). The Green Drop standards are regulatory water quality standards set by the South African Department of Water and Sanitation to classify catchment water quality compliance.
From Figs 4 and 5, DO concentration at the checkpoints can be observed after the proposed treatment levels were applied. The plots illustrate that at each river reach the DO concentration is above the Green Drop standards at the measuring points and hence the solution is feasibly optimised.
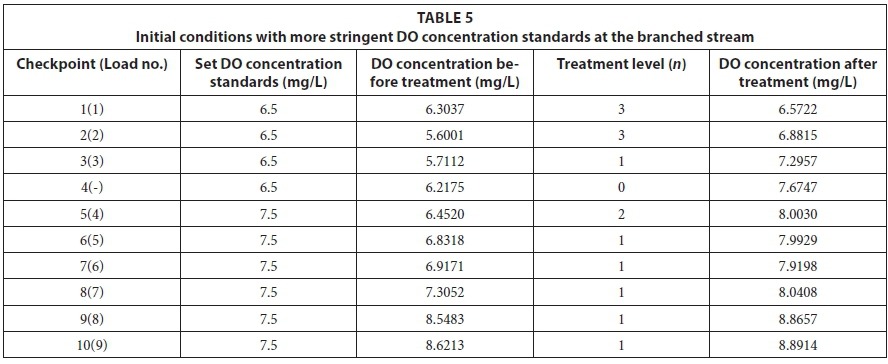
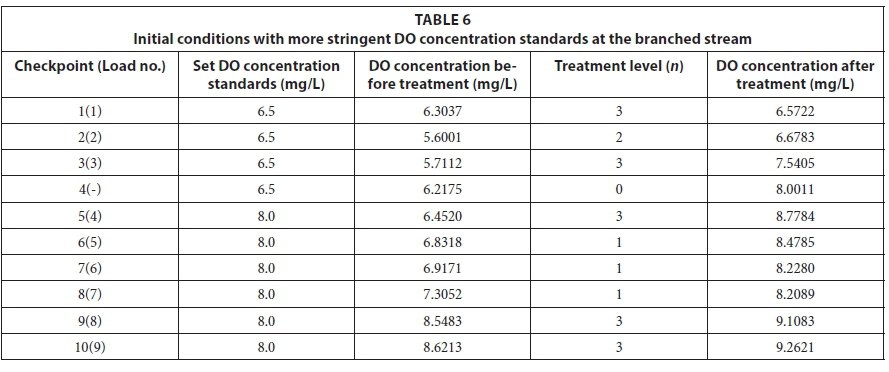
The model was able to produce these solutions in less than 2 min computational time. The figures indicate that at each selected theoretical measuring point, the DO concentration is equal to or above the set water quality standards. At the branched stream checkpoint, it can be illustrated that the stream can manage to maintain water quality standards even if a more stringent requirement is set for the lowest permissible DO concentration. Tables 5 and 6 list the summaries of the responses of instream DO concentration to varying (and more stringent) DO standards, corresponding to varying (and more elaborate) treatment levels. The data show that applying more stringent water quality standards drastically improves stream DO levels in the downstream reaches.
In all of these instances, with more stringent water quality standards, the model suggests higher treatment levels, which is the expected result; however, this results in increased operational cost. This method shows consistency for different set water quality standards by suggesting treatment levels for the WWTP that ensure that these standards are maintained at each theoretical measuring point. An important point to note is that Eq. 13, which is the basis of the optimisation cost function, only considers variable costs at prescribed values, and hence assumes existing treatment facilities. It is possible to define actual set-up costs on top of the actual running costs to define new plant set-ups; however, the essence of the methodology will not change.
As a way of improving on this optimisation routine so as to get as close as possible to reality, the transient nature of flow rate due to seasonal variation and also of contaminant loading (in this case BOD, but in reality several others) would need to be taken into account, to avoid under-designing a treatment plant, especially if the covariance of these two independent variables is positive. In this work, we have considered mean values, which helps to illustrate the preliminary focal areas for various treatment levels.
The methodology illustrated in this work focuses on one contaminant (BOD) and its associated indicator (DO); however, it is noteworthy that multiple contaminants can be easily handled as well. A typical stream flowing through a community typically suffers from contamination by nitrates, phosphates, E. coli, algal blooms, extremes of pH, heavy metal leachates and more. Treatment levels for these multiple contaminants can be defined in the same way as for the BOD/DO system, and they can be incorporated in the optimisation sub-routine by defining the appropriate number of contaminants (defined as Index c). Thus these robust optimisation algorithms can potentially result in more effective decision-making with regard to regional wastewater treatment systems.
CONCLUSIONS AND RECOMMENDATIONS
A mixed-integer programming technique for optimising wastewater load treatment by minimising treatment cost while maintaining set DO concentration stream standards was applied to the semi-hypothetical treatment network of the Upper Olifants River catchment. A combined stream simulation and mixed-integer programming model was capable of producing a feasible solution for a treatment system with 9 treatment facilities operating at 3 possible treatment levels by minimising treatment cost.
The Olifants River catchment can be better represented by a more complex model that will consider the un-steady state nature of the system and also take into consideration the other possible sources and sinks of oxygen. Enhancements to the model for the Olifants River network should include more than just one contaminant and also need to take into consideration the effect of distributed polluted sources. The coupled stream simulation-optimisation model should consider load streams with varying flows and optimisation should also be done based on other contaminants, such as ammonia, nitrates, and phosphorus, as well as chemical oxygen demand.
One of the constraints found in this research was the availability of data. If this can be improved, it will markedly improve model accuracy and proper techno-economics can be performed. Data especially required are flow rates, contaminant concentration, river morphology and wastewater loads. To fully optimise the whole system, even at a sub-catchment level, more contaminants will have to be included. The ultimate goal of such a broader undertaking would then be to consider a larger catchment, which would make the problem several orders of magnitude more complex but, with adequate data, can prescribe a solution for optimal WWTP operations at regional level for multiple contaminants.
LIST OF SYMBOLS
Parameters
Ac Treatment level dependent cost coefficient (cost-d-m3)
Ka Surface re-aeration rate coefficient (d-1)
Kd BOD degradation rate coefficient (d-1)
Kr Deoxygenation rate coefficient (d-1)
X Reach length (m)
B Vector of pollutant concentration
Variables
D Oxygen deficit (mg∙L1) at any time t (d)
D0 Initial oxygen deficit (mg∙L1) at any time t = 0 d
L BOD concentration (mg∙L1) at any time t (d)
L0 Initial BOD concentration (mg∙L1) at any time t = 0 d
Q Stream flow rate (m3 d-1)
tnTreatment binary function (0 for yes, and 1 for no)
T Treatment level vector
U Stream velocity (m∙s-1)
x Distance travelled (m)
Y Vector of concentrations for c species.
Z,zNumerical vectors for calculation of concentration
Indexes
c Pollutant species number
p Surveillance point number
n Treatment level index
glpk Linear mixed-integer optimisation function in Octave 3.2
REFERENCES
ALI KAMAR MD, FLETCHER JERALD J and PHILLIPS TIM T (2002) Stream water quality management: a stochastic mixed-integer programming model. Annual Meeting of the American Agricultural Economists Association (AAEA), 28-31 July 2002, Long Beach, USA. [ Links ]
ARBABI M and ELZINGA J (1975) A general approach to stream water quality modeling. Water Resour. Res. 11 (2) 191-196. http://dx.doi.org/10.1029/WR011i002p00191 [ Links ]
ASHTON PJ, LOVE D, MAHACHI H and DIRKS PHGM (2001). An overview of the impact of mining and mineral processing operations on water resources and water quality in the Zambezi, Limpopo and Olifants Catchments in Southern Africa. Contract Report to the Mining, Minerals and Sustainable Development (Southern Africa) Project. CSIR Environmentek Report No. ENV-P-C 2001-042. CSIR, Pretoria. 336 pp. [ Links ]
BASSON MS, VAN NIEKERK PH and VAN ROOYEN JA (1997) Overview of water resources availability and utilisation in South Africa. DWAF Report No. PRSA/00/ 0197. Department of Water Affairs and Forestry, Pretoria, South Africa. [ Links ]
BEUMER J, VAN VEELEN M, TIMM D and TEAM (2011) Development of a reconciliation strategy for the Olifants River water supply system. WP10197, Preliminary Reconciliation Strategy Report. Aurecon, Pretoria. [ Links ]
BISHOP AB and GRENNEY WJ (1976) Coupled-simulation water quality model. J. Environ. Eng. Div. Am. Soc. Civ. Eng. 12 (EE5) 1070-1086. [ Links ]
DABROWSKI JM, DABROWSKI J, HILL L, MACMILLAN P and OBERHOLSTER PJ (2014) Fate, transport and effects of pollutants originating from acid mine drainage in the Olifants River, South Africa. River Res. Appl. 31 (2015) 1354-1364. http://dx.doi.org/10.1002/rra.2833 [ Links ]
D'AMBROSIO C, LODI A, WIESE S and BRAGALLI C (2015) Mathematical programming techniques in water network optimisation. Eur. J. Oper. Res. 3 (243) 774-788. http://dx.doi.org/10.1016/j.ejor.2014.12.039 [ Links ]
FAN LT, NADKARNI and ERICKSON (1971) Management of optimal water quality in a stream. Water Res. 5 (2) 1005-1021. http://dx.doi.org/10.1016/0043-1354(71)90035-2 [ Links ]
FINNEY B, GRENNEY WJ, BISHOP AB and HUGHES TC (1977) Mixed integer programming models for water resource management. Utah Water Research Laboratory, College of Engineering, Utah State University, Logan, Utah. 84322.PRWG-198-1. [ Links ]
GIKAS P, LIU S, PAPAGEORGIOU L and KONSTANTOPOULOU F (2015) Optimal planning of water and wastewater management infrastructure for insular areas: the role of water reuse. Water Sci. Technol.: Water Suppl. 15 (4) 701-708. http://dx.doi.org/10.2166/ws.2015.017 [ Links ]
LI XM, LU HW, LI J, DU P, XU M and HE L (2015) A modified fuzzy credibility constrained programming approach for agricultural water resources management - a case study in Urumqi, China. Agric. Water Manage. 156 (11) 79-89. http://dx.doi.org/10.1016/j.agwat.2015.03.005 [ Links ]
LIU S, KONSTANTOPOULOU F, GIKA P and PAPAGEORGIOU LG (2011) A mixed integer optimisation approach for integrated water resources management. Comput. Chem. Eng. 35 858-875. http://dx.doi.org/10.1016/j.compchemeng.2011.01.032 [ Links ]
MARGETA J (1984) Coupled optimisation-simulation water quality model for regional water quality management. Math. Comput. Simul. 26 229-242. http://dx.doi.org/10.1016/0378-4754(84)90060-0 [ Links ]
MING T (2000) Overview of mechanistic modeling techniques. URL: http://lorien.ncl.ac.uk/ming/dynamics/modelling.pdf (Accessed 31 January 2013). [ Links ]
MO S, DUAN H, SHEN B and WANG D (2015) Interval two-staged stochastic integer programming for urban water resource management under uncertainty. J. Coast. Res. 73 160-165. http://dx.doi.org/10.2112/SI73-028.1 [ Links ]
MUJUMDAR PP and VEMULA VRS (2004) Fuzzy waste load allocation model: simulation-optimisation Approach. J. Comput. Civ. Eng. 18 (2) 120-131. http://dx.doi.org/10.1061/(ASCE)0887-3801(2004)18:2(120) [ Links ]
SAREMI A, SEDGHI H, MANSHOURI M and KAVE F (2010) Development of multi-objective optimal waste model for Haraz River. World Appl. Sci. J. 11 (8) 924-929. [ Links ]
SASIKUMAR K and MUJUMDAR PP (1998) Fuzzy optimisation model for water quality management of a river system. J. Water Resour. Plann. Manage. 124 (2) 79-88. http://dx.doi.org/10.1061/(ASCE)0733-9496(1998)124:2(79) [ Links ]
SIYAKATSHANA N (2006) Study of continuous flow systems with multiple impellers. PhD thesis, Institute of Chemical Technology, Prague, Czech Republic. [ Links ]
STREETER HW and PHELPS EB (1925) A Study of the pollution and natural purification of the Ohio River. III. Factors concerned in the phenomena of oxidation and reaeration. Public Health Bulletin No. 146. Reprinted by U.S. Department of Health, Education and Welfare, Public Health Service, 1958. [ Links ]
TSAKIRIS G and ALEXAKIS D (2012) Water quality models: An overview. Eur. Water 37 33-46. [ Links ]
ZANG C, HUANG S, WU M, DU S, SCHOLZ M, GAO F, LIN C, GUO Y and DONG Y (2010) Comparison of relationships between pH, dissolved oxygen and chlorophyll a for aquaculture and non-aquaculture. Water Air Soil Pollut. 219 157-174. http://dx.doi.org/10.1007/s11270-010-0695-3 [ Links ]
Received 20 March 2015
Accepted in revised form 20 September 2016
* To whom all correspondence should be addressed. ☎ +27 12 420-5894; e-mail: Evans.Chirwa@up.ac.za

