


Servicios Personalizados
Articulo
 Inglés (pdf)
 Articulo en XML
 Referencias del artículo
Indicadores

Links relacionados
-
 Citado por Google
 -
 Similares en Google
Compartir

 Permalink
Water SA
versión On-line ISSN 1816-7950
versión impresa ISSN 0378-4738
Water SA vol.42 no.4 Pretoria oct. 2016
http://dx.doi.org/10.4314/wsa.v42i4.08
REVIEW
Four decades of water recycling in Atlantis (Western Cape, South Africa): Past, present and future
Richard DH BuganI, * ; Nebo JovanovicI; Sumaya IsraelI; Gideon TredouxI; Bettina GentheI; Maronel SteynI; David AllpassII; Rodney BishopII; Vernon MarinusII
ICSIR, Natural Resources and Environment, PO Box 320, Stellenbosch 7599, South Africa
IICity of Cape Town, PO Box 1694, Cape Town 8000, South Africa
ABSTRACT
The primary aquifer at Atlantis (Western Cape, South Africa) is ideally suited for water supply and the indirect recycling of urban stormwater runoff and treated domestic wastewater for potable purposes. The relatively thin, sloping aquifer requires careful management of the artificial recharge and abstraction for balancing water levels. Water quality management is a further key issue at Atlantis for ensuring the highest quality potable water. Groundwater quality varies from point to point in the aquifer, while urban runoff and wastewater qualities vary greatly. The layout of the town allows for the separation of stormwater from the residential and industrial areas as well as separate treatment of domestic and industrial wastewater. This permits safe artificial recharge of the various water quality portions at different points in the aquifer, either for recycling or for preventing seawater intrusion. All of the management actions are dependent on detailed data collection and this paper describes the various parts of the system, describes the data collection activities, and provides results of the monitoring and aquifer responses over the past four decades. Challenges related to iron fouling of production boreholes are also described. The presence of emerging contaminants was studied in 2008 but requires follow-up research for establishing the extent of any possible threat to water recycling. In order to address the shortcomings of the system a risk management plan based on the Hazard Analysis and Critical Control Points approach was developed. Lessons learnt from the Atlantis experience can be transferred to other potential sites for establishment of similar systems in arid and semi-arid areas of South Africa and the African continent.
Keywords: Atlantis, managed aquifer recharge, water recycling, groundwater, stormwater, wastewater, monitoring
INTRODUCTION
Indirect recycling of water at Atlantis started shortly after development of the town commenced in the mid-1970s. This was inspired by the pilot-scale testing in the Cape Flats of artificial groundwater recharge as a means of recycling treated domestic wastewater (Tredoux et al, 1980). At Atlantis marine discharge of urban stormwater runoff and wastewater was avoided due to the high costs associated with the construction and long-term monitoring of marine outfall.
As a result of the increasing pressure on water resources in the Western Cape Province (South Africa) due to population increase, economic growth and the challenges posed by climate change, there has always been a need to conserve water volumes and quality, and improve management of the water resources. Indirect water recycling via managed aquifer recharge (MAR) has proven to be an effective conservation measure. MAR is defined as the transfer of surface water underground and the subsequent storage in an aquifer, either via infiltration from basins/dams/ponds or through injection boreholes (DWAF, 2007). In this way, water is stored during wet periods or when there is a surplus, and abstracted during dry periods. Storing water underground is more efficient than storage in surface dams because it obviates the need for identifying suitable dam sites and minimizes evaporation. In addition, the water is relatively safe from contamination and the porous medium through which it infiltrates acts as a filter for improving water quality. DWAF (2007) published a national artificial recharge strategy aimed at promoting the use of sub-surface storage of water as part of integrated water resource management, wherever technologically, economically, environmentally and socially feasible in South Africa. The strategy captured existing knowledge on the topic, the applicable legislation, planning and implementation requirements/criteria, and proposed management interventions and areas which require further research.
The International Groundwater Resource Assessment Centre (IGRAC) compiled an inventory of MAR schemes to promote MAR applications (IGRAC, 2015). Approximately 1 200 case studies from over 50 countries from Europe, Asia, Africa, North and South America, and Oceania were analysed and compiled to produce the global inventory. The inventory contains information such as site name, coordinates, MAR type and the reference. For some sites data pertaining to the annual volume of recharge, the source of infiltration water, the aquifer type, the final use of recovered water, as well as the main objectives of the project are also available. The inventory includes the famous Amsterdam dune water artificial recharge system, i.e. (Leiduin), the Orange County Groundwater Basin (Hutchinson, 2013), the Floreat Scheme in Perth (Australia; Bekele et al., 2008), Atlantis Water Supply Scheme (AWSS; DWA, 2010), etc. DWAF (2007) reported on the artificial recharge schemes being implemented in Southern Africa and internationally. The purpose of these schemes ranges from site-specific/local applications (where artificial recharge schemes have been incorporated into the overall water management strategy for the area, town or city) to regional examples (where artificial recharge is considered on a national or regional scale as a water conservation measure). Most schemes are mainly used for municipal supplies and for seasonal storage. Secondary benefits of the schemes include recovery of groundwater levels, prevention of saltwater intrusion, protection of endangered species habitat, improvements of groundwater quality and use of surface water allocations (AWWA, 2002). The re-use and recycling of water provides greater efficiency of water use and generally improves water quality. DWAF (2006) defines water recycling as a process whereby effluent resulting from water use is collected and treated (if necessary), and redirected back for use again.
The AWSS provides an excellent example of wise and efficient water use in an urban area. Since the late-1970s, the AWSS has recycled water, utilizing an artificial groundwater recharge scheme to further purify and store treated domestic wastewa-ter and urban stormwater. Subsequently, the groundwater is abstracted at wellfields and re-used to augment the municipal water supplies to the town of Atlantis (Western Cape, South Africa). The AWSS may be classified as a local application, where the artificial recharge scheme has been incorporated into the overall water management strategy for the town. Over the past 4 decades, considerable data and information were collected on the groundwater resource and the components of the AWSS. This paper reviews the operation and history of the AWSS, and assesses artificial recharge and the resulting groundwater blend from a quantitative (water quantities) and qualitative (water quality) perspective. This review utilizes data gathered during the numerous previous investigations which have been undertaken in the study area. Data and information were particularly gleaned from Cavé (1997), Cavé et al. (1997), Tredoux et al. (2002), Hobbs (2005), Bugan et al. (2014) and Jovanovic et al. (2014). A review of current actions is also presented as well as recommendations on how to maintain optimal functioning of the AWSS in future.
DESCRIPTION OF THE STUDY AREA
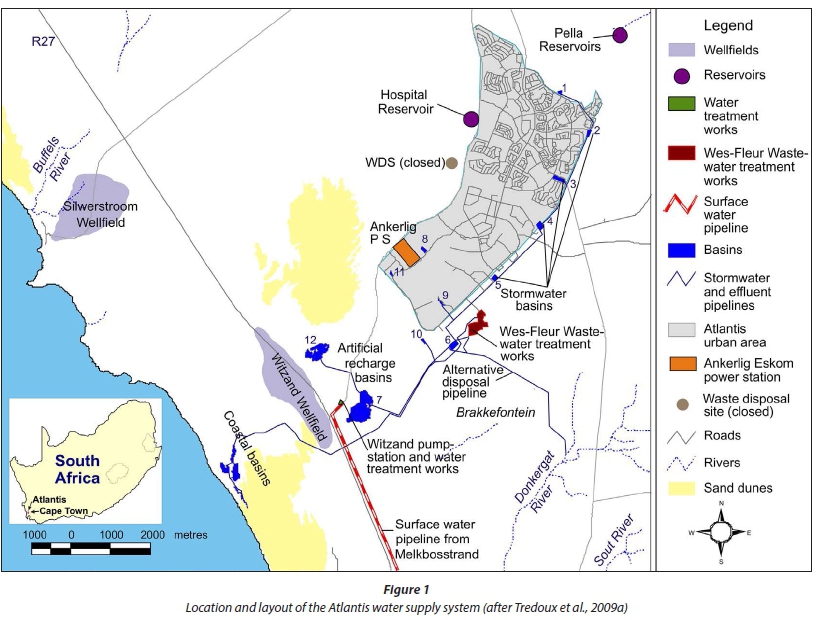
Atlantis is located approximately 50 km north of Cape Town along the west coast of South Africa (Fig. 1). It was developed from 1976 as a growth point" with tax incentives for industry, and originally planned for 500 000 inhabitants. Initially, the water supply was obtained from the Silwerstroom spring and a number of boreholes surrounding the spring. The longer term plan was to use surface water by means of a 70 km pipeline from the Misverstand Dam in the Berg River system via Withoogte Water Treatment Plant to Atlantis. As time passed and the town developed, the Witzand Wellfield was established further south along the R27 (West Coast Road') to accommodate the greater demand for water but also to ensure that only water of high quality is recycled. Since 2000, the Atlantis water supply has been linked to the Cape Town distribution system and limited quantities of surface water are also available from the reservoir at Melkbosstrand. Currently, the town of Atlantis forms part of the metropolitan area of Cape Town and a 2011 census reported a population of 67 491 residents (CCT, 2013). As the town was a planned development, the residential and industrial areas are separated. This facilitates the separate management of stormwa-ter runoff and wastewater flows from these different areas.
Atlantis experiences a semi-arid/Mediterranean-type climate with the majority of the 450 mm mean annual rainfall received between the months of April and September. The area is practically devoid of surface drainage features. The Donkergat and Sout Rivers to the south of the Atlantis area flow in winter, while surface drainage to the north and east of Atlantis contributes to the catchment areas of the Modder and Diep Rivers respectively. All the rivers are seasonal, drying up in summer (Tredoux et al., 2009a).
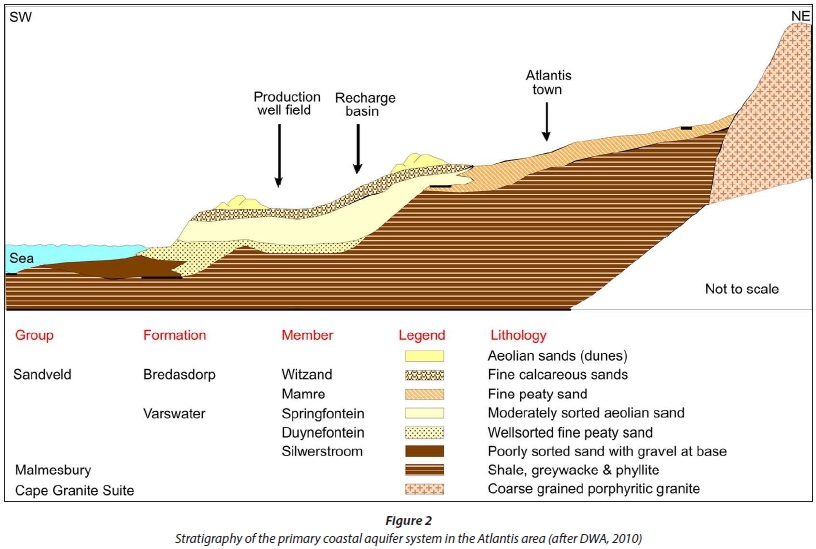
The Atlantis aquifer covers an area of about 130 km2, stretching inland from the Atlantic Ocean to the town itself in the east. Due to the sandy surface over most of the area, natural groundwater recharge percentages in the order of 15 to 30% of the annual rainfall are generally experienced, with the higher recharge occurring in the unvegetated sand dune area (Van der Merwe, 1983; Fig. 1). The primary coastal aquifer system in the Atlantis area is formed of unconsolidated Cenozoic sediments of Tertiary to recent age overlying Malmesbury Group bedrock consisting of greywacke and phyllitic shale (Van der Merwe, 1983; Fig. 2). Granite plutons have intruded the bedrock. The Cenozoic successions which occur in the area consist of quartz sands belonging to the Sandveld Group (Rogers, 1980). The total sand cover attains a thickness of 60 m in certain areas, but generally averages at 25 m. The saturated thickness varies considerably, but seldom exceeds 35 m (Tredoux et al., 2009a). The town is situated about 180 m amsl causing a fair topographic gradient towards the coast. The granite outcrops of Dassenberg, Kanonkop and at Mamre form the highest points in the area, at heights of 210 m to 410 m amsl (Van der Merwe, 1983). Groundwater flows westwards to south-westwards from a maximum elevation of about 160 m in the north-east, and discharges along the coast in areas where the aquifer dips below sea level. The groundwater table, therefore, has a relatively steep gradient towards the coast.
OPERATION OF THE AWSS
The town of Atlantis has practiced indirect water recycling, of which artificial groundwater recharge forms a major component, for almost 40 years. It was estimated that the groundwater abstracted as part of the AWSS represents a blend of 30% water derived from recycling and 70% natural groundwater (DWA, 2010). The need for the implementation of a water recycling scheme was fuelled by the recognition that the natural ground-water yield of the aquifer was insufficient to meet the long-term needs of the town, as well as to find an alternative to marine wastewater discharge. The various components of the AWSS are presented schematically in Fig. 3. The operation of the AWSS may briefly be summarized as follows:
• Initially all wastewater was treated in a single wastewater treatment plant and all the treated effluent used for artificial recharge. In 1986 this practice was discontinued due to water quality considerations and a separate treatment plant was constructed for domestic wastewater treatment. This came on line in the mid-1990s. Domestic wastewater undergoes full secondary treatment with nitrification∙denitrification steps (anaerobic-anoxic-aerobic). The effluent from secondary settling tanks is polished in a series of maturation ponds. The Department of Water and Sanitation oversees the effluent quality and the treatment works has attained Green Drop status.
• Large volumes of stormwater runoff, generated as a result of urbanization, are collected via the stormwater collection system, i.e., 12 detention and retention basins, numbered in Fig. 1, and associated interconnecting pipelines. Detention basins 1 to 4, 8 and 11 were designed to be mostly dry and serve for peak flow reduction, while Basins 5, 6, 9 and 10 were designed to act as wet basins in which reed beds developed.
• Treated domestic effluent (from maturation ponds) is blended with low-salinity urban stormwater runoff in Basin 6 before being discharged into the main recharge basins, i.e., retention Basins 7 and 12, for artificial recharge up-gradient of the Witzand Wellfield (Fig. 1). Basin 7 extends over 28.3 ha, whilst Basin 12 is 16.8 ha in extent. Basin 7 receives low flows (largely treated domestic wastewater), while Basin 12 is intended mainly for recharge of high quality peak-flow stormwater. The high/low flow separation takes place in a simple weir system. In case of emergency, it is possible to dispose the treated domestic wastewater to the Donkergat River (Fig. 1).
• The more saline treated industrial effluent is discharged into the coastal recharge basins (CRBs) and seeps into the ocean through the subsurface. This is a mitigation measure against potential seawater intrusion. Basin 10 serves the 'noxious trade' area and is connected to the coastal basins (Fig. 1).
• Groundwater is abstracted at the Witzand (blend of natural and recharged water) and Silwerstroom (natural groundwater) Wellfields (Fig. 1).
• The natural characteristics of the aquifer material affects the groundwater quality, e.g., calcrete and calcareous sands are imparting high hardness to the water, the vegetation contributes significant dissolved organic carbon, pyrite (and ferricrete in certain parts) adds measurable dissolved iron, and high salinity occurs in isolated places. The hardness is reduced by ion exchange, softening part of the flow. In the process iron is also partly removed but the organic carbon remains in solution (Tredoux et al., 2011).
For a comprehensive description of the system, the reader is referred to DWA (2010) and Tredoux et al. (2011).
HISTORIC DATA
Given that the AWSS supplies water both for drinking and for industry, it is essential that the system is managed to provide sufficient water volumes to the users and to reduce any possible risk of contamination in the system. For this purpose, groundwa-ter volumes and quality were monitored intensively around the recharge facilities and also at potential pollution point sources, e.g., the disused waste disposal site (WDS) and the wastewater treatment works (Fig. 1). This section summarizes, examines and interprets trends in historical data for groundwater abstraction, groundwater levels and chemistry, as well as recharge volumes and quality (e.g. microbiological, physical and chemical). Apart from the initial analytical data when the boreholes were drilled no systematic groundwater monitoring took place until 1982 when MAR had already been practiced for several years. Thus baseline information on the aquifer is sketchy.
Groundwater abstraction
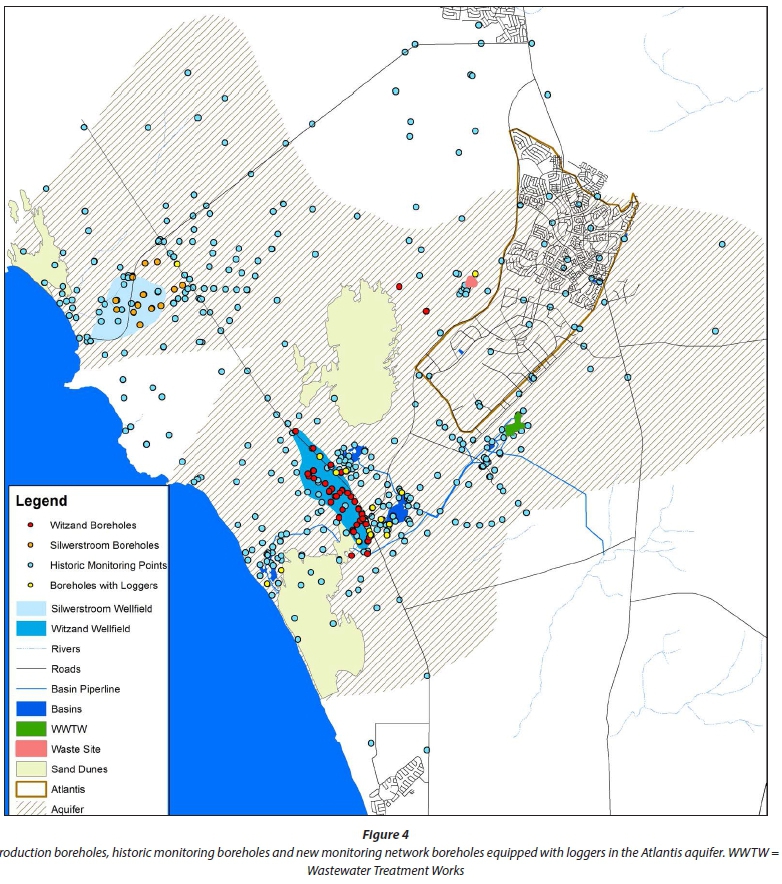
Groundwater abstraction at Atlantis occurs from two wellfields, i.e., Witzand (with 43 production boreholes) along the R27 and Silwerstroom (with 15 production boreholes) further north and to the west of the R27 (Fig. 4). According to CMC et al. (1995), the AWSS has an estimated potential production capacity in the order of 9.9 Mm3∙a-1. A much more conservative supply potential of 4.4 Mm'∙a-1 was however reported by CCT (2001) in the City of Cape Town (CCT) Water Services Development Plan. According to Tredoux and Cavé (1997), the water demand has increased steadily since development of Atlantis began. However by 1997, it stabilised between 5.4 and 5.7 Mm3∙a-1.
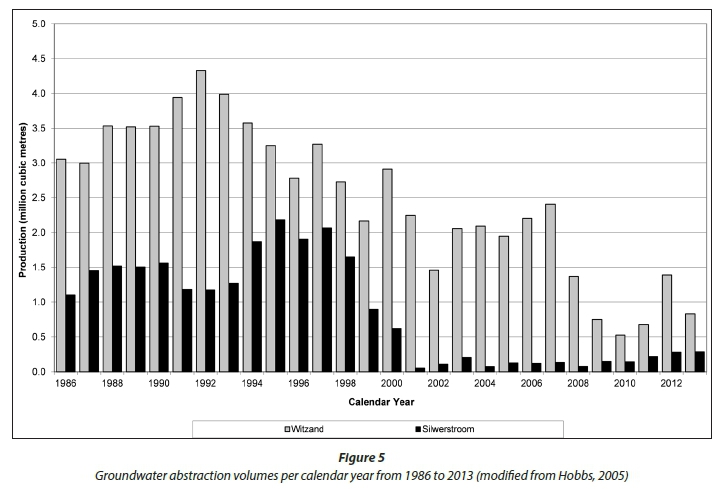
Hobbs (2005) collated historical groundwater data for the AWSS for the period 1986 to 2004. Figure 5 presents the groundwater data until 2013. The mean annual production, during the period 1986 - 2004, was 4.2 Mm3∙a-1, ranging between 1.6 Mm3∙a-1 (2002) and 5.5 Mm3∙a-1 (1992). A distinct decrease in abstraction was evident after 1999 (Fig. 5), which coincided with the introduction of surface water via the pipeline from Melkbosstrand. Hobbs (2005) quantified the annual average contribution of surface water to the AWSS during the period 2000-2004 to be 2.1 Mm3∙a-1.
During 2003-2013, coinciding with a period when production borehole data collection and recording intensified, abstraction took place from 41 boreholes, i.e., the Witzand and the Silwerstroom Wellfields were represented by 28 and 13 boreholes, respectively (Fig. 5). Total annual production did not exhibit a steady decline, but showed variability, ranging between 2.55 Mm3∙a-1 (2007) and 0.67 Mm3∙a-1 (2010). The minimum production in 2010 may however be due to missing data for some months. Annual production during the period of observation never exceeded 30% and 60% of the potential production estimates recoMmended by the CMC et al. (1995) and CCT (2001), respectively. The 2.55 Mm3∙a-1 produced in 2007 represented 26% and 58% of the respective potential production estimates for the AWSS. During the period 2003-2013 the maximum monthly production volumes were observed in May 2005 (290 947 m3) and June 2005 (290 320 m3).
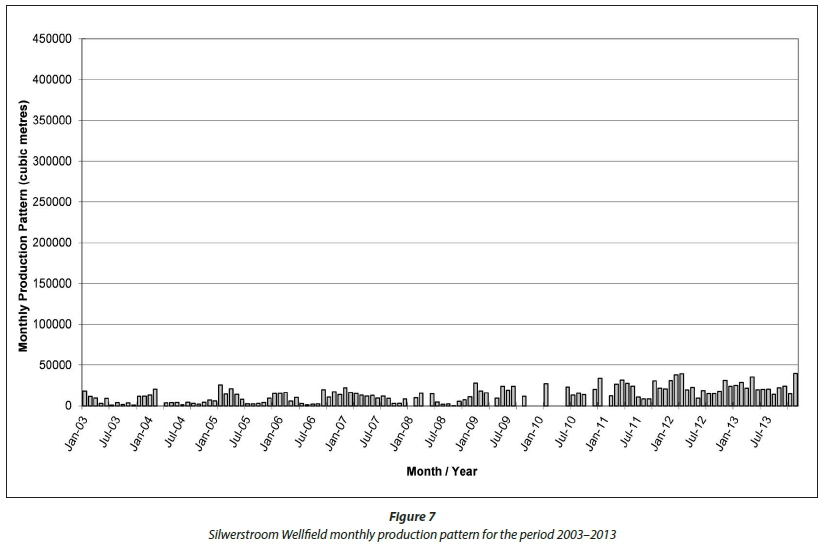
The Witzand Wellfield was historically the most productive of the two wellfields. During the period 2003-2013, abstraction from the Witzand Wellfield amounted to 14.53 Mm3. The monthly production pattern of the Witzand Wellfield is shown in Fig. 6. The production volumes observed at many of the boreholes were well below their respective production potentials. In general, the recorded data indicated large variations in borehole yield and monthly pumping schedules, i.e., poor consistency in production per borehole during the period of observation. The total production from the Silwerstroom Wellfield during the period 2003-2013 amounted to 1.70 Mm3. The monthly production pattern of the Silwerstroom Wellfield is shown in Fig. 7. Again, the production was well below the supply potential of this wellfield. Poor consistency, in terms of the monthly abstraction volumes, was also observed. The poor consistency in terms of the monthly production volumes, observed at both the Witzand and Silwerstroom Wellfields, may be attributed to a preference to use surface water via the pipeline from Melkbosstrand rather than groundwater. The use of surface water was intensified during periods when borehole equipment malfunctioned or when borehole clogging and/or turbidity problems occurred. The boreholes were rehabilitated between 1999 and 2002 to remove clogging and to reassess the reliable yield. Thereafter there was a gradual decline in yield as clogging returned necessitating further rehabilitation in 2015, which required a significant financial investment.
Groundwater levels
A large number of boreholes and wellpoints were established within the study area, i.e., > 500 (Fig. 4). These monitoring points were established during previous investigations to serve different objectives, to determine the extent and configuration of the aquifer, to provide water to smallholdings and industry, and to monitor the Atlantis aquifer. Recent surveys of the monitoring points in the area have, however, indicated that a large number of boreholes have been damaged or lost due to vandalism, fires, overgrowth of vegetation and other reasons. Groundwater level data are available at different frequencies, generally between 1984 and 2004, with subsequent occasional groundwater level monitoring campaigns covering small subsets of boreholes. From 2003 onwards monitoring was concentrated on the production boreholes while monitoring at most of the other points in the area was discontinued. The recent installation of groundwater level loggers is intended to augment data collection.
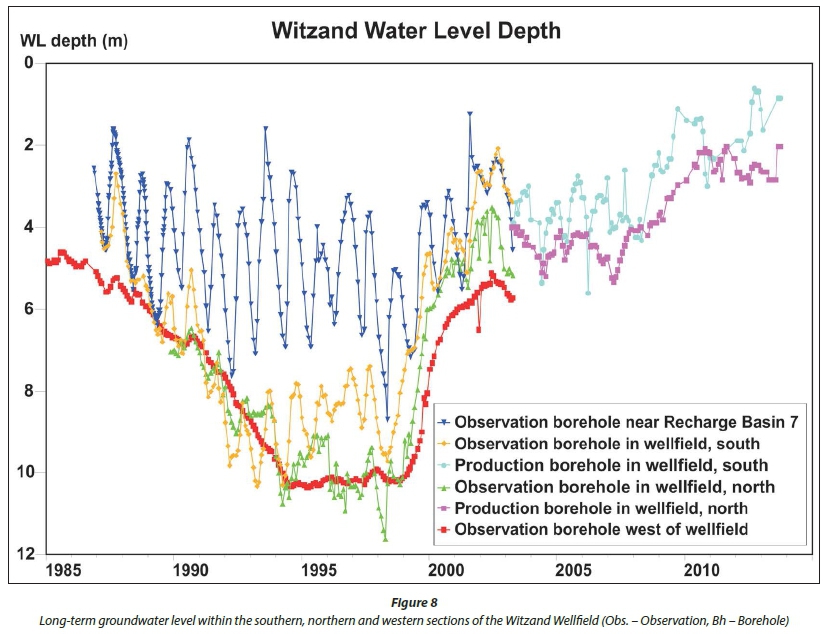
Figure 8 presents manually collected groundwater level data for points located within the vicinity of the Witzand Wellfield. These are representative of the groundwater levels in the areas to the west, and in the southern and northern parts of the well-field, and also include an observation point to the east of the wellfield near Recharge Basin 7. The observation point in the west is representative of the area between the wellfield and the CRBs (Fig. 1). The observation in this area started after abstraction commenced and thus the initial rest level before abstraction started is not shown. However, the further decline in groundwa-ter levels from 1986 until 1993 is clearly evident. The wellfield recovery caused by reduced abstraction from 1999 onwards is reflected. The impact of abstraction from 1986 is also clearly evident in the northern and southern parts of the wellfield. The groundwater level in the south is influenced by recharge in Basin 7 and initially the water level at the observation borehole in the southern part of the wellfield followed the seasonal variations in Basin 7. By 1993 there was a steep gradient between the recharge Basin and the wellfield. From 2000 onwards the water level in the wellfield again mirrored the water level variations at Basin 7 with practically no gradient between the Basin and the wellfield by 2002 when water level observations at Basin ended.
The water level in the northern part of the wellfield is more affected by recharge in Basin 12. As Basin 12 only receives peak flow stormwater the bulk of artificial recharge is via Basin 7 in the south. The decline in the wellfield groundwater levels started in 1986 due to the fact that no wastewater was recharged from 1986 until the mid-1990s, when the new wastewater treatment plant was constructed and renovations to the existing plant were carried out. Once the treated domestic wastewater was reintroduced, the levels stabilized. The minimum water level was observed in 1998, after which a recovery in water levels started. This recovery also coincided with the reduction in abstraction due to the linking of the Atlantis water supply to the Cape Town reticulation system at Melkbosstrand allowing the importation of surface water (1999). The recovery period extended to 2002, but since 2007 water levels rose further due to a further reduction in wellfield abstraction caused by borehole clogging. The lack of data at certain points from 2005 onwards is clearly noticeable in Fig. 8.
Groundwater chemistry
The groundwater chemistry at the Witzand and Silwerstroom Wellfields has been monitored regularly since the inception of the scheme. About a decade ago, the CCT restructured the water quality monitoring programme for production boreholes on a 5-week cycle. The data provided a useful database with which to assess the condition of each borehole and the scheme in its entirety. It is also invaluable for planning and for the future management of the AWSS. A total of 10 148 water chemistry records exist for the production boreholes in Atlantis.
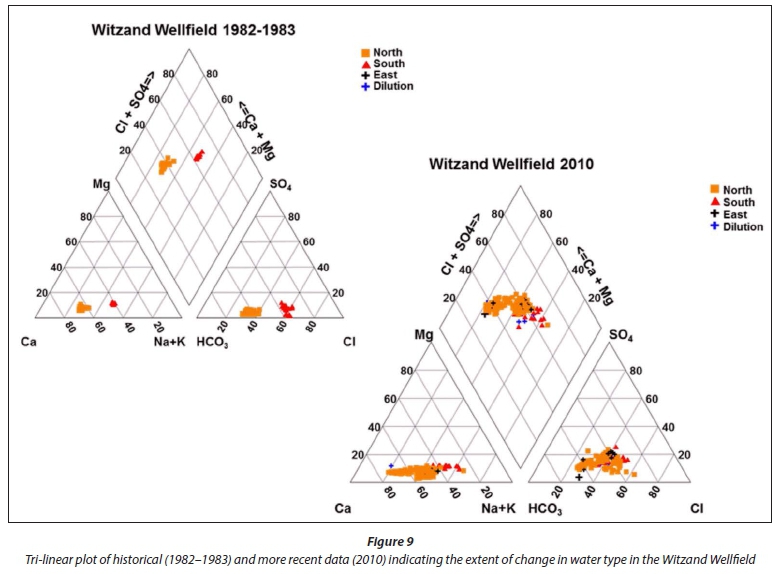
Tri-linear Piper diagrams were constructed using Aquachem (SWS, 2007) to compare the earliest available data (1980s) for the wellfields with the most recent data (2010). This provides an indication of the extent to which the groundwater composition has evolved over time. The Witzand Wellfield production boreholes were sub-grouped based on their location and function, i.e., North, South, East, and 'Dilution' (an alternate name given to the boreholes used for mixing of groundwater from the Witzand Wellfield and surface water) to facilitate data analyses. Figure 9 shows the groundwater characterization at the Witzand Wellfield comparing earlier years to the most recent monitoring data. It is evident that from as early as 1982/1983, there were two distinct water types, i.e., Ca-rich in the north of the wellfield and Na-rich in the south of the wellfield. The more recent data show that the northern parts of the wellfield contain more Ca-HCO3 rich waters while the southern part of the wellfield contains more Na-Cl type waters. The area between the north and south exhibits a mixture with respect to composition. Boreholes in the southernmost portion of the Witzand Wellfield had been decommissioned in previous years due to salinity, in favour of those to the north, and newer wellfield areas were established to avoid drawing groundwater of higher salinity and sulphate content into the wellfield (Tredoux and Cavé, 2002). Groundwater abstracted from the Witzand unit requires softening to remove temporary hardness before reticulation to the town and industries.
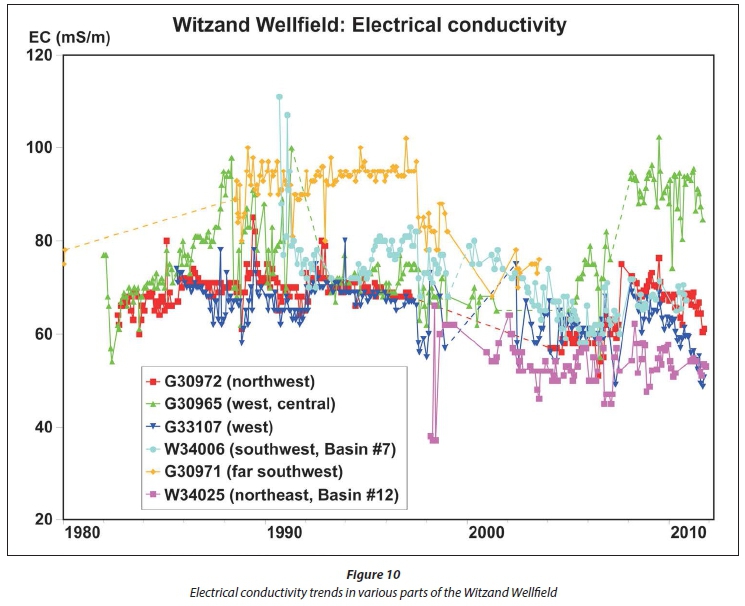
Figure 10 shows the temporal trends in electrical conductivity (EC) in various parts of the Witzand Wellfield. In the early 1980s artificial recharge in Basin 7 kept the higher salinity groundwater to the south of the wellfield at bay but the salinity started increasing in the southwest (G30971) from 1988 when recharge of treated wastewater was discontinued at the end of 1986 and the water level dropped. Only when wellfield water levels started to recover in 1998 (Fig. 8) did the salinity decrease in that area. This coincided with the augmentation of the Atlantis water supply with low-salinity surface water. In the south-western part of the wellfield, which is directly influenced by the recharge in Basin 7 (W34006), the salinity declined from about the year 2000 and reached its lowest level around 2006 when the water table attained its original level. The lowest salinity occurred in the north-eastern part of the wellfield (W34025) near Basin 12, which is an area fed by low-salinity rain recharge from the unvegetated dunes. In the north-western part of the wellfield (G30972) the salinity remained largely constant except during the period from 2004 to 2008 when it seemed that there was some influence from the low-salinity recharge coming from Basin 12. The reason for the higher salinity in the central western part (G30965) in the period between 2008 and 2012 is unknown but may be related to the exceptionally high water table.
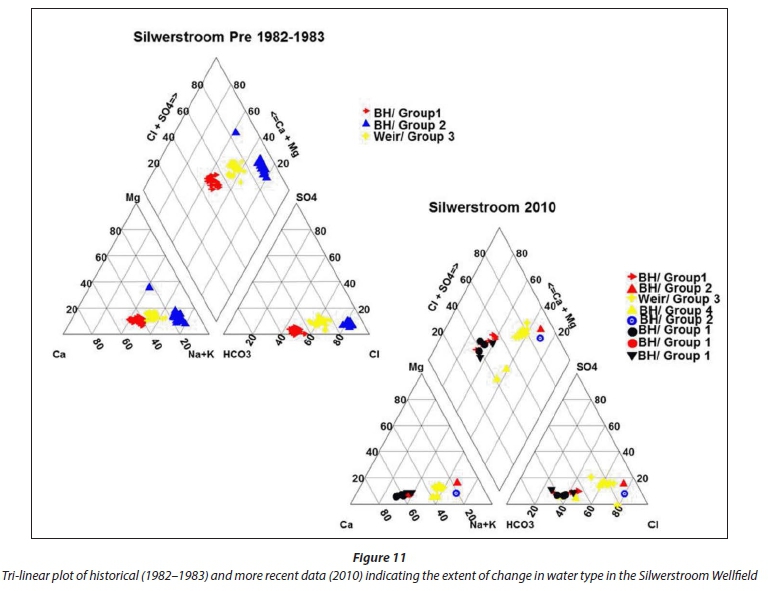
Figure 11 shows the Piper diagram for the Silwerstroom Wellfield. Lower natural Ca and HCO3 concentrations were found in the Silwerstroom aquifer unit, where the calcareous Witzand Member is absent. Data selected for these plots were for 1982-1983 and 2010. The results show that the Silwerstroom Weir samples (Fig. 11, Weir/Group3, a gauging station that collects water from the Silwerstroom Spring) now exhibits a slightly more NaCl-rich water type than in 1982. Production boreholes showed no significant change in water type with time, but their water type differed greatly from the Silwerstroom Weir in that they had a lower salinity Ca-HCO3 type water. Some of the boreholes shown for 2010, which were drilled in the 1990s, have a Ca-HCO3 water type similar to production boreholes.
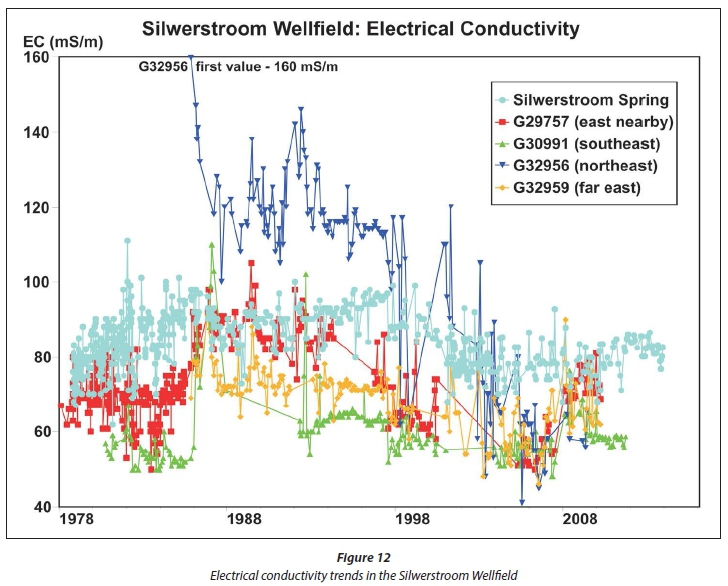
Figure 12 shows the water quality (EC) trends in the Silwerstroom Wellfield using data from the Silwerstroom spring and 4 production boreholes with the longest record of data. The Silwerstroom Wellfield depends only on natural recharge and the salinity trends are due to natural phenomena and water bodies derived from different depositional environments. A striking feature is the relatively constant water quality of the Silwerstroom spring over nearly 4 decades. A nearby production borehole (G29757), up-gradient of the spring, showed significant salinity variations. Initially the salinity was lower but from about 1986 until 1996 it was similar to that of the spring. Subsequently it was again lower but by 2008 it was again similar to that of the spring. In the south-east (G30991), the salinity was generally significantly lower than at the spring. In the north (G32956), the salinity was much higher than at the spring from 1986 until 1998 but then gradually decreased to lower levels until the observations ended.
In terms of drinking water quality standards (SANS241-1: SABS, 2011; DWAF, 1996), the only parameters that have occasionally exceeded the aesthetic specifications for drinking water were EC (limit of 170 mg∙L-1) and Fe (0.3 mg∙L-1). These were, however, removed by ion exchange softening at the water treatment works, and later blending with surface water diluted the groundwater further to reduce the EC.
Artificial recharge
Artificial recharge for recycling is realised at Atlantis through the use of two main recharge basins, i.e., Basin 7 and Basin 12 (Fig. 1). These have been constructed up-gradient of the Witzand Wellfield (Fig. 1). On average, approximately 7 500 m3∙d-1 of stormwater and domestic wastewater is estimated to be recharged thereby augmenting the water supply by more than 2.7 Mm3∙a-1, which theoretically means that approximately 30% of Atlantis' water supply is augmented through artificial recharge (DWA, 2010). This section discusses the water volumes and water quality, including the microbiological water quality, associated with the artificial recharge process.
Water volumes and water balance
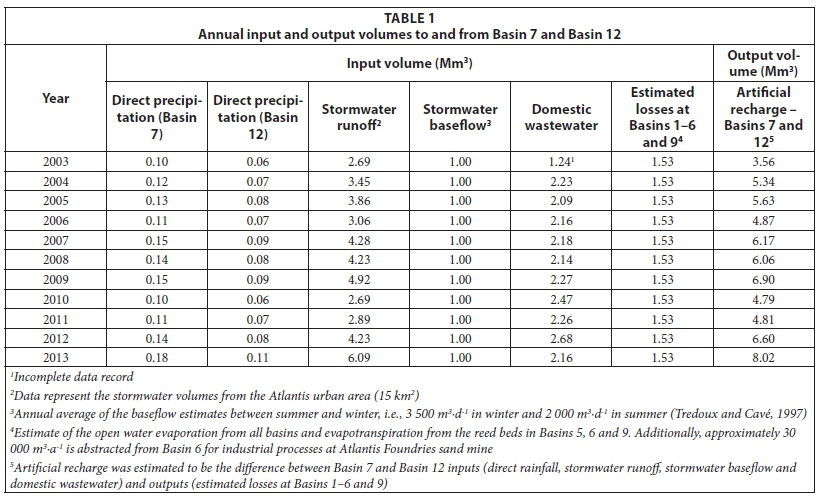
The Wesfleur Wastewater Treatment Works (WWTW, Fig. 1) at Atlantis has been in operation since 1978. An activated sludge process is used to treat about 4 Mm3 of wastewater per year (Tredoux and Cavé, 2002). The WWTW comprise separate domestic and industrial treatment plants. The domestic effluent is blended with urban stormwater runoff in Basin 6, mainly from residential areas, before being discharged into the main recharge basins, Basins 7 and 12 (Tredoux et al., 2009b). The more saline treated industrial effluent from the WWTW is conveyed and discharged into the CRBs and seeps into the ocean through the subsurface. Effluent volumes from both the domestic and industrial treatment plants are monitored daily at the Wesfleur WWTW. The annual domestic effluent volumes are presented in Table 1. Annual discharge from the domestic treatment plant during the period 2003-2013 averaged at 2.33 Mm3a-1. Effluent volumes from both plants remained fairly constant in the period 2005-2009. Subsequent to 2009, however, a distinct increase was observed in effluent volumes emanating from the domestic treatment plant and a distinct decrease in effluent volumes from the industrial treatment plant. This was a result of the frequent diversion of inflow from the industrial plant to the domestic plant due to malfunctioning of the industrial plant.
Rainfall is monitored at Station 0020/846 Atlantis WWTW, which is located at the Wesfleur WWTW. The station is managed by the South African Weather Service (SAWS). During the period 2003-2013, total annual rainfall ranged between 352 mm (2003) and 653 mm (2013), averaging at 459 mm. It should be noted that 2013 was the wettest rainfall year on record. This rainfall data was translated to direct precipitation to Basins 7 and 12 using Basin areas of 28.3 ha and 16.8 ha, respectively (Tredoux et al., 2009b). The results are presented in Table 1.
In the Atlantis area, minimal overland flow is generated under natural conditions due to the high infiltration capacity of the soil. The hard impermeable surfaces, which are a result of urbanization, however, generate large volumes of stormwater runoff. This was seen as a valuable water source for supplementing freshwater supplies, which highlighted the need for a storm-water collection system. The stormwater drainage system consists of an integrated system for gathering stormwater from roads and public open spaces (Tredoux and Cavé, 1997) with 12 detention and retention basins and associated interconnecting pipelines (Fig. 1). The total urban surface area of Atlantis is 17.21 km2. The area which contributes to urban stormwater, which discharges to Basin 6, is approximately 15 km2. Stormwater runoff which originates from the noxious trade area (approximately 2.21 km2) is transported to the CRBs. Stormwater volumes are not monitored at Atlantis, even though it is very important to the optimal functioning of the AWSS. Stormwater is also a significant component of the water balance of the scheme.
As an estimate, stormwater volumes were calculated using the Soil Conservation Service (SCS) Curve Number (CN) method (Hudson, 1993). This method allows for the quantification of probable rates of overland flow/stormwater and is based on the fact that stormwater will vary according to the amount of rainfall during the storm, and according to the amount of moisture which can be absorbed by the soil. For a description of the equations used and the methodology, the reader is referred to USDA-SCS (1965), Hudson (1993) and Bugan et al. (2014). For the quantification of stormwater volumes in Atlantis, the SCS CN method was parameterised to represent an urban area. The results of the application of the SCS CN method to quantify monthly stormwater volumes from the Atlantis area which discharge to Basin 6 are presented in Table 1. Annual stormwater volumes ranged between 2.69 Mm3 (2010) and 6.09 Mm3 (2013). On average, the monthly stormwater volume was approximately 44% of monthly rainfall. According to Wright (1994), discharges during storm events can reach 72 000 m3∙d-1. The total volume discharging to Basin 7 and Basin 12 is approximately 7 000 m3∙d-1 in winter, 3 000 m3∙d-1 in early summer and 2 000 m3∙d-1 in late summer (Tredoux and Cavé, 1997). The maximum monthly stormwater discharge attained in August 2013 (1.97 Mm3), when converted to a daily average volume (63 548 m3∙d-1), is within the range of the estimate (72 000 m3∙d-1) by Wright (1994).
Stormwater baseflow is also a feature of the AWSS and arises due to groundwater entering the stormwater pipelines in areas where these are below the groundwater table. Stormwater baseflow amounts to approximately 3 500 m3∙d-1 in winter and 2 000 m3∙d-1 in summer (Tredoux and Cavé, 1997). The baseflow was estimated to be 1 Mm3∙a-1 (conservative value), as no monitoring data are available. In reality, however, it is expected to show variation in accordance with groundwater level fluctuations.
Significant losses also occur from the AWSS, which includes open water evaporation, seepage losses, evapotranspiration from the reed beds in Basins 5, 6 and 9, and abstraction from Basin 6 for industrial processes (approximately 30 000 m3∙a-1). Periodic pan evaporation data are available for Station 0020/846 Atlantis WWTW, which suggest that annual open water evaporative losses could be of the order of 2 200 mm∙a-1. This equates to an evaporative loss of 0.63 Mm3∙a-1 from Basin 7. Tredoux and Cavé (1997) reported that total evaporative losses from Basin 7 were 0.10 Mm3 (102 986 m3) in 1996. Bugan et al. (2012) also quantified the annual evapotranspiration, in a catchment in close proximity to Atlantis, to be approximately 94% of the annual precipitation. Considering these values, annual losses (open water evaporation, seepage losses, evapotranspiration from the reed beds in Basins 5, 6 and 9 and abstraction from Basin 6) were estimated to be 1.53 Mm3∙a-1.
The water balance data are synthesized in Table 1. The artificial recharge at Basins 7 and 12 was estimated to be the difference between the inputs and estimated losses. Total artificial recharge ranged between 3.56 Mm3∙a-1 and 8.02 Mm3∙a-1. This is in excess of estimates by Tredoux et al. (2009b), who stated that the actual infiltration up-gradient of the Witzand Wellfield amounts to about 2.7 Mm3∙a-1, on average. Uncertainties associated with stormwater volumes and the estimated losses, however, also create uncertainty about the artificial recharge volumes. At a daily scale, it is very likely that the estimated artificial recharge volumes are in excess of the recharge capacity of the AWSS, i.e., 15 000 m3∙d-1 (Tredoux et al., 2009b). Further evidence for this is provided by the frequent observation of waterlogged areas around Basin 7 and increased vegetation growth during 2011-2013.
The separate contribution of urban stormwater and domestic wastewater to Basin 7 and Basin 12 could not be quantified as stormwater volume data are only available on a monthly scale.
The AWSS is designed in such a manner that if the discharge to Basin 7 is less than 5 ML∙d-1, wastewater is discharged entirely to Basin 7. However, if it exceeds this threshold value, the excess is diverted to artificial recharge Basin 12 through a passive weir splitter. The average daily discharge from the domestic wastewater plant during the period of observation was 6.7 ML∙d-1 and thus water should have regularly discharged into Basin 12.
Chemistry
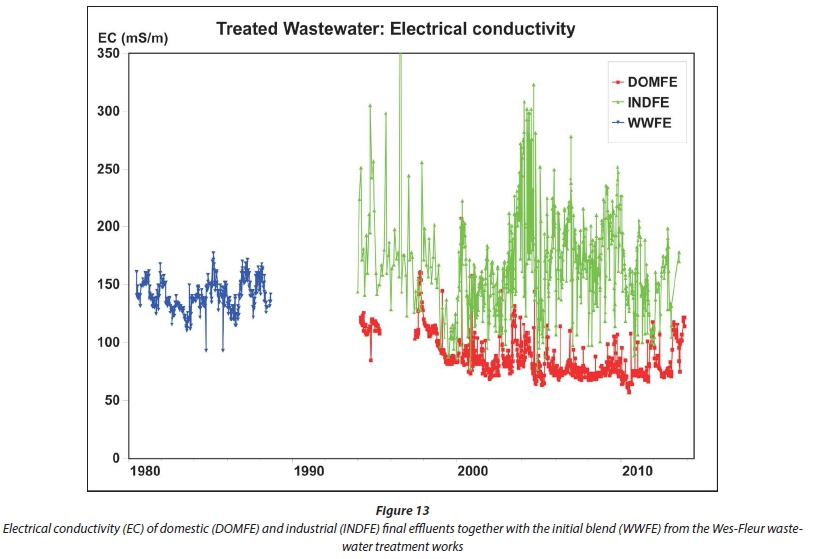
Over the years, the artificial recharge of stormwater and wastewater has been refined by separating the components of different quality for recharge at different locations in the aquifer. Water emanating from the noxious trade area is piped to the CRBs, while some industrial and all domestic stormwater makes its way to Basin 6. The separate disposal of industrial and domestic wastewater since the mid-1990s is due to higher salinity and inferior quality water emanating from the industrial area (Fig. 13). Treated domestic wastewater from the Atlantis WWTWs is of high quality (generally less than 150 mS∙m-1) and is released into Basin 6 where the water undergoes further natural quality improvement due to passing through reed beds and sand filtration. The separation of wastewater ensures that good quality water flows toward Basins 7 and 12 (Fig. 1). The CCT has implemented regulations regarding both stormwater system and sewerage system discharges and there have been prosecutions in the industrial area where illegal discharges were identified. The average TDS observed at the CRBs is 1 194 mg∙L-1. This is well below the recommended standard for the discharge of effluent into the marine environment, i.e., 34 850 mg∙L-1. At or below this guideline value it is interpreted that ecosystem functioning will be maintained (DWAF, 1995). The water stored in the CRBs infiltrates through the subsurface before reaching the ocean and thus the water quality is likely to be improved before reaching the marine environment. Currently, there are no water quality guidelines related to subsurface seepage into the ocean.
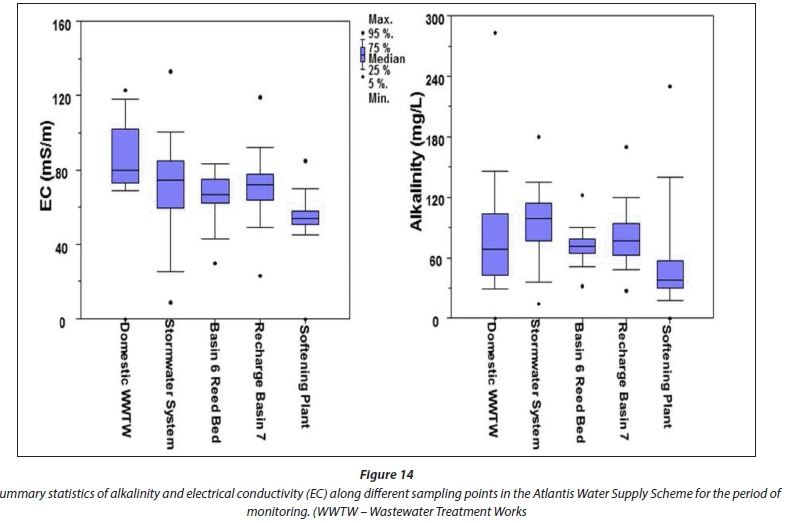
The salinity of the water in the stormwater system (Fig. 1) generally increases in a downstream direction with the lowest salinity observed at Basins 1 and 2. The salinity of the water virtually doubles before reaching Basin 6, as it drains the town centre and displays some residual chemical signature of historical farming and animal husbandry activities in the area (storm-water system in Fig. 14). The main salinity inputs however occur at Basins 5 and 9. Basin 9, receiving discharge from the industrial area, could have a negative impact on the water recharging the aquifer due to its elevated salinity compared to the background levels for the area, i.e., < 100 mS∙m-1. Basin 10 (Fig. 1), is the most saline of the basins and discharges to the CRBs. It would therefore be most suited to divert water from Basin 9 to Basin 10 and from there to the coastal basins instead of the recharge basins. It is also noticeable from Fig. 14 that mixing domestic wastewater and stormwater at Basin 6 has a buffering effect on water quality, and that the subsurface passage of water through the aquifer and dilution with natural groundwater considerably improves the water quality between recharge Basin 7 and the softening plant (Fig. 14).
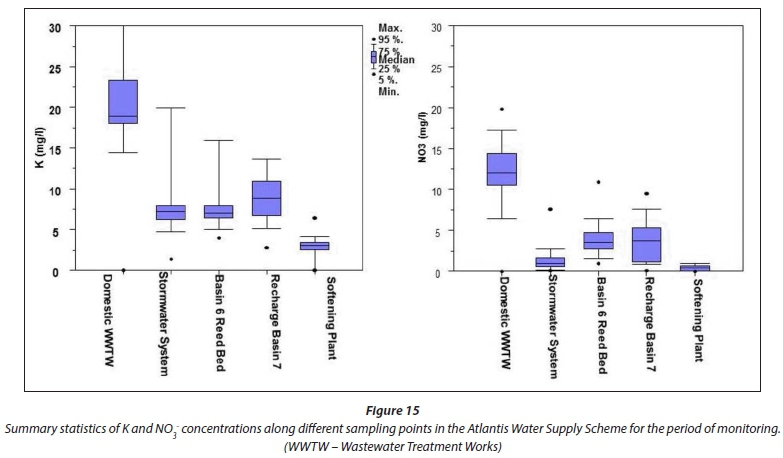
Figure 15 shows the nutrient content through the water system in Atlantis. Even though the recharged water may have elevated nutrient levels from the domestic WWTWs and storm-water system, the time water takes to travel within the aquifer to the softening plant and dilution with natural groundwater is sufficient to reduce nutrient levels to within guideline levels (DWAF, 2006).
Microbiological water quality
Historically, the AWSS relied on indicator microorganism analyses which comprised monitoring for faecal coliforms according to the South African Drinking Water Quality Guidelines (DWAF, 1996) and General and Special Standards for the Treatment of Wastewater Effluent (RSA, 1984). Monitoring sites were limited to certain points in the scheme and mostly focused on the treated wastewater effluent and the final water supply after softening. Analyses historically focused on the presence of faecal indicator organisms to provide an indication of the possible presence of pathogenic microorganisms within the system and potential for human health risks.
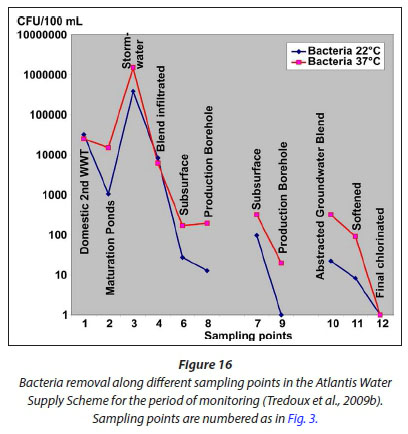
A detailed water quality sampling programme was carried out from 2007 to 2008 in order to determine the efficiency of the system in terms of contaminant removal. The study was done by analysing a number of indicators of water quality at the sampling points indicated and numbered in Fig. 3. An example of analytical results is shown in Fig. 16 for coliform bacteria, where log-reductions in bacteria colony-forming units were observed as the recycled water passes through the system. A similar pattern was observed for inorganic compounds, dissolved organic carbon (DOC) as well as pathogenic indicators (Clostridium for parasites and coliphages for viruses) and selected emerging contaminants (pharmaceuticals) (Tredoux et al., 2009a). The analysis confirmed the role of the subsurface passage as a barrier, reducing the health risk for potable reuse.
CURRENT FUNCTIONING
The Atlantis groundwater scheme provides a cost-effective water supply option when coupled with strict management of the resource. The importation of limited quantities of low-salinity surface water enhanced the viability of the recharge scheme and also allowed the utilization of slightly more saline groundwater. The introduction of ion-exchange for water softening and partial desalination in 1986 further enhanced the scheme, even allowing the possible export of potable water to other residential areas.
The production boreholes are currently monitored on a monthly basis by the Atlantis Water Scheme (Water and Sanitation Department: Utility Services) of the CCT. This includes water meter readings (abstraction and running hours); water quality checks (pH, Eh, EC, Temperature, TH, TAlk, dissolved oxygen, total dissolved solids and turbidity); and aquifer and borehole conditions (rest water level, pumping water level, yield verifications through volumetric bucket-and-stopwatch checks). The production boreholes are sampled for chemical analysis once in a 5 week sampling cycle. Samples for chemical analysis are collected from the tap at each borehole. Sampling and chemical analyses are performed by the CCT (Scientific Services). The samples are analysed for the following parameters: Al, Ca, Cl, Cu, EC, Fe, K, Mg, Mn, Na, NH4-N, NO3-N, pH, SO4, TDS, total alkalinity, total hardness and turbidity.
Given the analysis and interpretation of historic data, the AWSS management could be improved. As demonstrated through the historic data, abstraction rates have declined since the addition of surface water to the AWSS in 1999 (Fig. 5). The artificial recharge of treated domestic wastewater and urban stormwater has largely continued as if groundwater abstraction patterns have not changed. Reduced abstraction and continued artificial recharge has resulted in elevated groundwater levels, particularly in the vicinity of, and downstream of, the artificial recharge basins (Fig. 8). The elevated groundwater levels potentially have had negative consequences in terms of the attenuation of potential contaminants, due to the reduction of the thickness of the unsaturated zone and reduced groundwater residence times. Reduced abstraction is a result of iron-related bacterial clogging and a lack of effective routine maintenance to deal with the clogging problem. The increase in groundwater level has had implications for the adjacent Koeberg Nature Reserve, managed by South African National Parks and located downstream of the Witzand Wellfield. This manifested mainly in waterlogging at low points within the nature reserve. The following actions were therefore undertaken recently in order to address the shortcomings of the system:
• An investigation into the potential for iron removal through ozone injection in order to prevent iron clogging in production boreholes and improve their yield.
• A new monitoring programme to record groundwater levels and quality as well as the quality of water at the inlet of Basin 7 with loggers in order to eliminate data gaps and to improve management.
• The development of a risk management and assessment plan (Page et al., 2012) based on Hazard Analysis and Critical Control Points (HACCP). The HACCP plan envisages addressing issues related to clogging, potential pollution, potential incorrect functioning of the WWTPs, illegal discharges, etc.
Borehole clogging
The below-potential production of the AWSS is interpreted to mainly be a function of the availability of surface water supplies as well as the deterioration of the infrastructure, specifically borehole clogging. Since the 1990s, iron clogging was a recurring problem in the Atlantis wellfields, which resulted in reduced borehole yields. The occurrence of borehole clogging may be attributed to:
• The presence of naturally available iron and manganese in the aquifer
• The occurrence of natural soil bacteria which accumulate iron and manganese due to fluctuating groundwater levels and dissolved oxygen concentrations
• Borehole construction
• The adopted pumping regime
To facilitate identification of the occurrence of clogging, the production borehole monitoring programme included the monthly measurement of the actual yield (volumetric methods) of each production borehole in operation. Analysis of the production borehole data, however, indicated that these were performed infrequently due to faulty equipment (flow indicators). Additionally, step∙drawdown pumping tests were also performed sporadically on production boreholes.
Bishop (2002) adopted a more conservative approach to the determination of the sustainable yield of the production boreholes when compared to earlier values (Cavé, 1997). In most cases, the average borehole yield for the period of observation was below both the original (Cavé 1997) and Bishop's (2002) estimated yields or between the two estimates. Only four boreholes from the Silwerstroom Wellfield and one borehole from the Witzand Wellfield exhibited average borehole yields which exceeded the estimated yields. In most cases, the maximum observed borehole yield was within the range of yield estimates. Certain boreholes exhibited high standard deviations, e.g., > 2 L-s-1. In certain cases the standard deviation was as high as 48% of the estimated yield (Bishop, 2002). Additionally, the current yield of most boreholes is well below the estimated yield, which highlights the need for borehole rehabilitation activities. The potential to efficiently rehabilitate many of the boreholes in the wellfields is however influenced by borehole construction. At some boreholes, the adopted construction technique causes difficulty for the removal of clogging below the borehole screen area.
The borehole clogging problem was recently investigated by Robey et al. (2014). The pilot study to evaluate the local applicability of the in-situ iron removal method for preventing iron clogging in production boreholes in a primary aquifer was set up at a production borehole adjacent to the current water treatment plant in Atlantis. The daisy-wheel injection approach was applied at this site with 12 small∙diameter well-points drilled in close proximity around the production borehole. Ozone was generated on-site and injected into the injection well-points to oxidize and subsequently precipitate iron and manganese in the aquifer. Results showed that iron and manganese levels were significantly reduced during the experiment. This in-situ remediation technique showed great promise with improved water quality and negligible impacts on the aquifer (Robey et al., 2014).
Monitoring programme
Due to the vulnerable nature of the AWSS, it is of utmost importance that the microbiological, physical and chemical attributes of the system are monitored and understood to ensure appropriate management of the system as a whole. Given shortcomings in monitoring that were identified, a new monitoring programme was designed to address the lack of data in a manner that would be manageable in terms of the operation of the system and serve as warning to potential risks (Jovanovic et al., 2014).
As part of the new monitoring programme, 13 Solinst Levelogger Gold LT 30 m (recording groundwater level and temperature), 4 Solinst Levelogger LTC (recording ground-water level, temperature and EC) and a Solinst Barologger Gold (Solinst Canada Ltd., Georgetown, Ontario, Canada) were installed between December 2012 and February 2013. The installation points are shown in Fig. 3. The siting of the monitoring points was mainly based on the general direction of groundwater flow (south-westerly) and the locations of significant features. Points were chosen upstream of significant features to assess background conditions as well as downstream to identify any impact emanating from these features. Significant features within the study area include the recharge basins, production boreholes, pollution sources (residential/ urban areas, waste dumps, WWTWs, etc.) and natural features (groundwater recharge areas). The monitoring network also allows for identification of impacts (excessive drawdown, changes in the direction of groundwater flow, etc.) associated with large-scale abstraction. Points were also identified along the coastline to identify any occurrence of saltwater intrusion. The CCT also monitors the groundwater quality around the disused WDS; however, based on groundwater modelling results, the risk of pollution from the WDS reaching the well-field is very small. The aim of logger installation was to facilitate long-term groundwater level and EC monitoring at critical points and also to collect data for the calibration and validation of groundwater models. Additionally, the purpose of installation was also to obtain high-frequency data (hourly) in order to describe with accuracy individual events (e.g. rainfall, episodic discharge of treated wastewater in the basins etc.) for management of the system.
Although wastewater volumes are recorded at the WWTWs (Table 1) and the water volumes entering Basin 7 and 12 are occasionally recorded by the Storm Water branch of CCT, historic records of water quality entering the recharge basins were limited to manually collected data. This may cause changes in water quality and spillage events to be overlooked and interventions delayed.
Microbiological quality of the final effluent of the Wesfleur WWTW is monitored on a 5-weekly basis for indicator microorganisms. The production boreholes are monitored for the indicator microorganisms, i.e., total coliforms and E. coli. Final production water is monitored on a daily basis. The final water is also analysed for protozoan parasites and viruses on an annual basis.
Risk management plan
The risk management plan was developed based on the 12 elements of HACCP recommended by Swierc et al. (2005). HACCP includes 12 elements, two of which will be discussed here, i.e., the identification of hazards and critical control points. The identification of hazards at Atlantis was initiated during the European 'Reclaim' project (Ayuso-Gabella et al., 2008) and updated by Jovanovic et al. (2014). A semi-quantitative risk estimation and consequence analysis led to the compilation of a risk matrix (Table 2) for ranking risks of all hazards identified.
Four critical control points, as defined by Swierc et al. (2005), were identified based on a Decision Tree method (Jovanovic et al., 2014):
• Effluent discharge point of domestic WWTW (Point 1 in Fig. 3), monitoring the efficiency of treatment.
• Stormwater quality at point where stormwater runoff blends with domestic treated wastewater and enters Basin 6 (Point 3 in Fig. 3).
• Water quality of the production borehole blend representing the whole wellfield and giving an overview of the water quality produced (Point 10 in Fig. 3). This measures the aquifer as a whole (sub-surface treatment barrier). Managing the retention time of the water within the aquifer is critical as it is the final barrier in the AWSS for removing protozoan parasites such as Giardia and Cryptosporidium from the water as these parasites are resistant to chlorine (Page et al., 2010).
• Chlorination point - this is a specific final barrier in place to prevent microbial contamination and re-growth in the distribution system (Point 11 in Fig. 3). Chlorination is also the final control measure to remove viruses if present at this stage in the supply water. Low levels of viruses were detected with no enteric viruses found in 100 L samples and 2-3 log somatic coliphages found in surface water samples (wastewa-ter effluent to recharge basins). This did not allow log reduction to be calculated.
Frequent sampling and detailed analysis, with assessment against critical limits of EC, E. coli, DOC, turbidity and Cl are recommended (Jovanovic et al., 2014).
THE WAY FORWARD
The AWSS provides an excellent example of wise and efficient water use, including water recycling for potable services. It also has alleviated some of the pressure on the surface water resources in the region, especially with impending impacts of climate change and further population/economic growth. The availability of surface water may eventually be restricted due to the rapid development of the Cape West Coast and the lack of local water resources. Hence, the groundwater resources and the associated water recycling system will remain of critical importance for ensuring a water supply to Atlantis. This, however, requires that the AWSS be managed efficiently. Evidence gathered during this investigation suggests that management and operation of the system can improve:
• The declining abstraction rates and rising groundwater levels require interventions such as de-clogging of existing boreholes through available technologies or drilling and establishment of new production boreholes. Production borehole rehabilitation is urgent from a water level and water quality point of view due to increased losses of water by evaporation from the shallow groundwater table, the excessive growth of vegetation down-gradient of the recharge basins, and the deterioration of water quality due to increased salinity, decreased residence times and reduced contaminant attenuation. The implementation of such interventions would greatly improve the safety of water supply.
• The declining monitoring activities since 2005 only allowed for the computation of an empirical water balance. It is essential that a monitoring programme be maintained for all the water balance components. It is particularly critical to continuously monitor the volume and quality of the feed water into the artificial recharge Basins 7 and 12. Daily storage volumes in Basins 7 and 12 as well as accurate evapotran-spiration and evaporation data from Basins 6, 7 and 12, and the CRBs are also essential. The importance of evaporation and evapotranspiration in the water balance of semi-arid areas suggests that it is imperative that this parameter be included in the water balance assessment. A quarterly to bi-annual groundwater monitoring programme was initiated at points within the study area and additional automatic logging equipment installed at key points. This is not limited to the wellfields and recharge basins, but includes pollution point sources and other hotspots.
• Overall, the AWSS is dependent on sound management of water quality. The poorer quality stormwater runoff and better quality domestic treated effluent are blended and discharged into Basins 7 and 12. The industrial wastewater is treated and discharged separately into the CRBs in order to eliminate risks to human health. Future modifications have to include separate stormwater treatment in a reed bed and direct routing of treated domestic wastewater to recharge Basin 7. It is therefore essential to ensure that industrial wastewater never contaminates the AWSS. From an engineering perspective, certain system modifications can be introduced, such as re-routing of Basin 9 outflow to connect with Basin 10. In addition, it is also essential to ensure that both domestic treated wastewater and stormwater runoff can be diverted to Donkergat River in case of spillages or contamination (Fig. 1).
• Indirect recycling of treated domestic wastewater and urban stormwater runoff via the Atlantis aquifer is a key feature of the AWSS. The aquifer is, however, unconfined and vulnerable to pollution. A groundwater protection plan needs to be drafted and implemented.
• Given that the AWSS will continue to supply water to domestic and industrial users, it is essential to fully implement a risk management plan in the form a Water Safety Plan (based on the HACCP approach). The monitoring plan needs to be updated to prevent risks from new and emerging contaminants (e.g. pathogens, antibiotics, other pharmaceuticals, and personal care products).
• Ultimately, a number of guidelines and manuals have recently been developed (Jovanovic et al., 2014) that can serve for capacity building of CCT staff in the management and operation of the AWSS.
The general success and operation of the AWSS is promising in terms of establishment of similar systems in the arid and semi-arid areas of South Africa and the continent in order to mitigate water stresses. Many lessons learned from the Atlantis experience can be transferred to other potential sites. However, each site will have to design unique engineering and management solutions depending on the specific sources of water, water demand and hydrogeological settings. Proper management and operation of MAR systems is very complex, but it is of utmost importance in order to secure required water volumes and quality.
ACKNOWLEDGMENTS
The authors wish to thank the Utility Services, Bulk Water (Atlantis Water Supply Scheme) Utility Service) and Scientific Services Branches of the City of Cape Town for providing data and insight into the scheme and also for assisting with field work.
REFERENCES
AWWA (2002) Survey and analysis of aquifer storage and recovery (ASR) systems and associated regulatory programmes in the United States. American Water Works Association, USA. [ Links ]
AYUSO-GABELLA MN, BIXIO D, GENTHE B, JEFFREY P, KOPAK I, LE CORRE K, PAGE D, REGEL R, SALGOT M, SAPERAS N and co-authors (2008) Reclaim water, Final report on risk assessment, management and communication in selected case studies including recommendation of standard procedures. Contract-No. 018309. European Commission, Brussels. [ Links ]
BEKELE E, TOZE S, HIGGINSON S, PATTERSON B, BLAIR P, HEITZ A and BROWNE L (2008) Determining requirements for managed aquifer recharge in Western Australia. Progress report. Water for a Healthy County flagship report. CSIRO Australia. [ Links ]
BISHOP R (2002) Proposed set yield and orifice plate size for AWRMS production boreholes. City of Cape Town. Cape Town. [ Links ]
BUGAN RDH, JOVANOVIC NZ and DE CLERCQ WP (2012) The water balance of a seasonal stream in the semi-arid Western Cape (South Africa). Water SA 38 (2) 201-212. [ Links ]
BUGAN RDH, JOVANOVIC N, TREDOUX G and CLARKE S (2014) Provision of professional services for Atlantis water supply scheme artificial recharge scientific and operational support. Hydrogeological resource assessment and water balance. Report to Bulk Water Operations: Bulk Water Branch, Water & Sanitation Department, Utility Services Directorate, City of Cape Town, March 2014, South Africa. [ Links ]
CAVE L (1997) Inventory of Atlantis production boreholes. Report No ENV/S-C97134 B, CSIR, Stellenbosch. [ Links ]
CCT (City of Cape Town) (2001) Bulk water supply infrastructure; background information for WSDP. URL: http://www.capetown.gov.za/water/wsdp/documents/chapter4.pdf (Accessed 2 December 2015). [ Links ]
CCT (City of Cape Town) (2013) 2011 Census - Suburb profiles. Compiled by Strategic Development Information and GIS Department, City of Cape Town, using 2011 Census data supplied by Statistics South Africa. URL: https://www.capetown.gov.za/en/stats/Pages/Census2011.aspx (Accessed 30 November 2015). [ Links ]
CMC, LIEBENBERG & STANDER and CSIR (1995) The Atlantis water resource management scheme - An overview. Cape Metropolitan Council, Cape Town. [ Links ]
DWAF (Department of Water Affairs and Forestry, South Africa) (1995) South African Water Quality Guidelines for Coastal Marine Waters. Volume 1. Natural Environment. Volume 2. Recreation. Volume 3. Industrial Use. Volume 4. Mariculture. Department of Water Affairs and Forestry, Pretoria. [ Links ]
DWAF (Department of Water Affairs and Forestry, South Africa) (1996) South African Water Quality Guidelines, Volume 1: Domestic Use (2nd edn). Department of Water Affairs and Forestry, Pretoria. ISBN 0-7988-5339-5. [ Links ]
DWAF (Department of Water Affairs and Forestry, South Africa) (2006) Best practice guideline H3: Water reuse and reclamation. Department of Water Affairs and Forestry, Pretoria. [ Links ]
DWAF (Department of Water Affairs and Forestry, South Africa) (2007) Artificial recharge strategy: Version 1.3. Department of Water Affairs and Forestry, Pretoria. [ Links ]
DWA (Department of Water Affairs, South Africa) (2010) Strategy and guideline development for national groundwater planning requirements. The Atlantis water resource management scheme: 30 years of artificial groundwater recharge. Report No PRSA 000/00/11609/10 - Activity 17 (AR5. 1). Department of Water Affairs, Pretoria. [ Links ]
HOBBS PJ (2005) Atlantis water resource management scheme - Evaluation of production borehole performance up to September 2005. Report No ENV-S-C 2005-104. CSIR, Stellenbosch. [ Links ]
HUDSON NW (1993) FAO Soils Bulletins-68. Field measurement of soil erosion and runoff. Report No. T0848/E. Silsoe Associates- Ampthill, Bedford (United Kingdom). [ Links ]
HUTCHINSON AS (2013) Report on groundwater recharge in the Orange County Groundwater Basin 2011 - 2012. Orange County Water District, Fountain Valley, CA, USA. [ Links ]
IGRAC (International Groundwater Resource Assessment Centre) (2015) Managed aquifer recharge. URL: http://www.un-igrac.org/areas-expertise/managed-aquifer-recharge-mar#more_about_mar-block-3 (Accessed 23 May 2016). [ Links ]
JOVANOVIC N, TREDOUX G, BUGAN RDH, ISRAEL S, STEYN M and GENTHE B (2014) Provision of Professional services for Atlantis water supply scheme artificial recharge scientific and operational support. Report to Bulk Water Operations: Bulk Water Branch, Water & Sanitation Department, Utility Services Directorate, City of Cape Town, March 2014, South Africa. [ Links ]
PAGE D, DILLON P, TOZE S, BIXIO D, GENTHE B, JIMINEZ CISNEROS BE, and WINTGENS T (2010) Valuing the subsurface pathogen treatment barrier in water recycling via aquifers for drink ing supplies. Water Res. 44 1841-1852. [ Links ]
PAGE D, AYUSO-GABELLA MN, KOPAK I, BIXIO D, DILLON P, DE MARCAY MS and GENTHE B (2012) Risk assessment and risk management in managed aquifer recharge. In: Kazner C, Wintgens T and Dillon P (eds) Water Reclamation Technologies for Safe Managed Aquifer Recharge (eds). IWA Publishing, London. [ Links ]
ROBEY K, TREDOUX G and CHEVALLIER L (2014) Preventing production borehole clogging by in-situ iron removal in South African aquifer systems. WRC Report No. 2070/1/14. Water Research Commission, Pretoria. [ Links ]
RSA (Republic of South Africa) (1984) Requirements for the purifica tion of wastewater or effluent. General and Special Standards for the Treatment of Wastewater Effluent. Government Gazette 18 May 1984 No. 9225. Regulation No. 991 18 May 1984. Government Printer, Pretoria/Cape Town. [ Links ]
ROGERS J (1980) First report on the Cenozoic sediments between Cape Town and Elandsbay. Open File Report 1980 - 0249. Geological Survey, Pretoria. [ Links ]
SABS (South African Bureau of Standards) (2011) SANS241-1. South African National Standards, Drinking Water, Part 1: Microbiological, Physical, Aesthetical, Chemical Determinants. SABS, Pretoria. [ Links ]
SWS (SCHLUMBERGER WATER SERVICES) (2007) Aquachem v.5.1 user's manual. Water quality data analysis, plotting and modeling. Schlumberger Water Services, Waterloo, Ontario, Canada. URL: http://www.scientificsoftwaregroup.com (Accessed 13 August 2015). [ Links ]
SWIERC J, PAGE D, VAN LEEUWEN J and DILLON P (2005) Preliminary hazard analysis and critical control points plan (HACCP) - Salisbury storm water to drinking water aquifer storage transfer and recovery (ASTR) project. CSIRO Land and Water Technical Report No. 20/05, September 2005. CSIRO, Adelaide. [ Links ]
TREDOUX G, ROSS WR and GERBER A (1980) The potential of the Cape Flats aquifer for the storage and abstraction of reclaimed effluent (South Africa). In: Proceedings of the International Symposium on Artificial Groundwater Recharge, 14-18 May 1979, Germany. Z. Dt. Geol. Ges. 131 23-43. [ Links ]
TREDOUX G and CAVE L (1997) Atlantis groundwater management review 1996/97. Report No. ENV/S-C97114. CSIR, Stellenbosch. [ Links ]
TREDOUX G and CAVE L (2002) Atlantis aquifer; a status report on 20 years of groundwater management at Atlantis. Report No ENV-S-C 2002-069. CSIR, Stellenbosch. [ Links ]
TREDOUX G, GENTHE B, STEYN M, ENGELBRECHT JFP, WILSENACH J and JOVANOVIC N (2009a) An assessment of the Atlantis artificial recharge water supply scheme (Western Cape, South Africa). In: Brebbia CA, Jovanovic N and Tiezzi E (eds) Management of Natural Resources, Sustainable Development and Ecological Hazards II. Wit Press, Southampton. 403-413. [ Links ]
TREDOUX G, JOVANOVIC N, GENTHE B, STEYN M and LE CORRE K (2009b) Reclaim water, a specific targeted research project under the thematic priority 'Global Change and Ecosystems'. Deliverable D 4.3, mass balance based sustainability analysis for the Atlantis recharge site. European Commission, Brussels. [ Links ]
TREDOUX G, GENTHE B, STEYN M and GERMANIS G (2011) Managed aquifer recharge in Atlantis, South Africa. In: Kazner C, Wintgens T and Dillon P (eds) Advances in Water Reclamation Technologies for Safe Managed Aquifer Recharge. IWA Publishing, London. [ Links ]
USDA-SCS (1965) Measurement of Irrigation Water. Section 15, Irrigation, Chapter 9. In: National Engineering Handbook. US Department of the Interior, Soil Conservation Service, Washington DC. [ Links ]
VAN DER MERWE AJ (1983) Exploration, exploitation and evaluation of groundwater in the sand deposits in the Atlantis area for water supply to the Atlantis Growth Point (in Afrikaans). MSc thesis, University of the Free State, Bloemfontein. [ Links ]
WRIGHT A (1994) Artificial recharge of urban wastewater, the key component in the development of an industrial town on the arid west coast of South Africa. In: Water Down Under '94. Proceedings of the IAH Congress, Adelaide, Australia, Vol.2, Part A. 39-41. [ Links ]
Received 15 January 2016
Accepted in revised form 6 September 2016
* To whom all correspondence should be addressed.+27 21 888-2502; e-mail: rbugan@csir.co.za

