


Services on Demand
Article
 English (pdf)
 Article in xml format
 Article references
Indicators

Related links
-
 Cited by Google
 -
 Similars in Google
Share

 Permalink
Water SA
On-line version ISSN 1816-7950
Print version ISSN 0378-4738
Water SA vol.42 n.4 Pretoria Oct. 2016
http://dx.doi.org/10.4314/wsa.v42i4.01
Movement of contaminants in the unsaturated zone of the subsurface from a low flush on-site sanitation system in Ivory Park, Johannesburg
MB van RyneveldI, *; AB FourieII; IH PalmerIII
IDepartment of Civil Engineering, University of Cape Town, Private Bag X3, Rondebosch, Cape Town 7701, South Africa
IISchool of Civil, Environmental and Mining Engineering, The University of Western Australia, 35 Stirling Highway, Crawley, Western Australia 6009, Australia
IIIPalmer Development Group, P.O. Box 46830, Glosderry, Cape Town 7702, South Africa
ABSTRACT
This study measured the movement of contaminants in the unsaturated zone of the subsurface from a low-flush on-site sanitation system (also known as an aqua-privy) at three sites in Ivory Park, which at the time that the fieldwork was done was a newly-established informal settlement in Johannesburg. The aim of the study was to provide field data on the movement of contaminants from this sanitation system in a low-income area, in these climatic and subsurface conditions, and to counter a perception that on-site sanitation will inevitably cause pollution. Subsurface conditions consisted nominally of a 1 m thick layer of silty sand with denser gravel at the bottom of it, underlain by a stiff sandy clay (residual granite), with the natural water table more than 15 m below ground surface. In summary, it can be deduced that movement in the unsaturated zone of bacterial indicators, nitrogen and phosphorus from low-flush on-site sanitation systems in low-income areas is very limited, as long as the effluent remains in the subsurface. More specifically, the impact in terms of COD appears to be negligible, with substantial treatment apparently taking place within the soakaway or within the immediate vicinity thereof. With respect to (i) bacteriological indicators, (ii) nitrogen (in the form of ammonium, nitrite and nitrate) and (iii) phosphorus (in the form of Total Phosphorus), using the distilled water washout technique, there is a very rapid drop-off of contamination with distance from the soakaway. At horizontal distances of 3 m from the soakaway, levels of the measured contaminants had dropped to values consistent with the background levels. The results of this study are not confined to this particular sanitation system. By virtue of the higher hydraulic loading, these results provide an upper bound for contaminant movement from dry on-site systems under similar conditions.
Keywords: contaminants, unsaturated zone, subsurface, on-site sanitation
INTRODUCTION
While good progress has been made in the provision of sanitation to all in South Africa since 1994, the target set in the Strategic Framework for Water Services for the provision of at least a basic sanitation service to all by 2010 (DWAF, 2003) remains some way from being achieved. The target was moved forward to 2014 in line with updated housing targets of the Department of Human Settlements (DWA, 2010). More recently, in reply to questions in Parliament, the Minister of Co-operative Governance and Traditional Affairs indicated that a new sanitation baseline of 74% as at April 2015 was proposed, together with a target of 90% sanitation access by 2019 (percentage of households with access to a functional service at acceptable levels as per norms and standards) (PMG, 2016). Sanitation backlogs, particularly in informal settlements, continue to present a challenge even for large metropolitan municipalities such as the City of Johannesburg (CoGTA, 2009; City of Johannesburg, 2010; Kunene, 2010). Both of these points confirm the more general statement in a report prepared for the South African Human Rights Commission (SAHRC) by the Department of Performance Monitoring and Evaluation in The Presidency (DPME et al., 2012), which indicated that at the current rate of delivery of around 300,000 household units annually, [the target of achieving universal access to sanitation services by 2014] will not be achieved' and that the sanitation sector is also faced with ongoing growth of informal settlements, particularly in urban areas, due to the rural-urban migration as well as from population growth and the influx from foreign nationals'.
While higher levels of service remain the long-term objective, the high cost of construction, operation and maintenance of full waterborne sanitation systems compared to on-site sanitation systems (Van Ryneveld, 1994; Pujari et al., 2007; Still et al., 2009; Shivendra and Ramaraju, 2015) may well make on-site sanitation the most viable option for a portion of the population in South Africa for some years to come. All sanitation systems (both on-site and off-site systems) can cause environmental degradation. In order to avoid this in the case of on-site sanitation, the movement of contaminants in the subsurface needs to be understood and given due consideration in the choice and design of the sanitation system (Van Ryneveld and Fourie, 1997; DWAF, 2007).
Various studies have reviewed contamination from on-site sanitation systems (Lewis et al., 1980; Fourie and Van Ryneveld, 1995). More recently, Still and Nash (2004) investigated contamination from pit latrines in a sandy aquifer in Maputaland, with the water table between 5 m and 20 m below the surface, and groundwater being used as a water source. Wright (1999) investigated the use of septic tank systems in the South African coastal zone. Pujari et al. (2007) have investigated the use of on-site sanitation in a basaltic hard rock environment in Bhopal, India, while Shivendra and Ramaraju (2015) have investigated the impact of on-site sanitation systems on groundwater in a range of geological settings in southern India. Recent very specific experimental studies in high-income countries have also investigated movement of contaminants from a range of sources (e.g. Unc and Goss, 2003). However, very few field studies appear to have been carried out on the movement of contaminants from dry or low-flush on-site sanitation systems in low-income settlements, in general, and in the unsaturated zone of the subsurface in the climatic and geological conditions of Johannesburg, in particular.
This paper provides field data on the subsurface movement of contaminants from a low-flush on-site sanitation system (also known as an aqua-privy) in Ivory Park, Johannesburg. The results of this study are not confined to this particular sanitation system, but can be considered to have more general application to other low-flush systems such as the Indian-style pour-flush latrine and dry on-site sanitation systems such as the ventilated pit latrine (VIP). By virtue of the higher hydraulic loading, these results provide an upper bound for contaminant movement from dry on-site systems under similar conditions.
Despite the fact that this field work was carried out over two decades ago, that these particular sanitation systems have since been sewered, and that the City of Johannesburg no longer includes this particular sanitation system as part of its 'level of service' options (Johannesburg Water, nd), a combination of the broad applicability of the results, the paucity of other field work data, and the continued use of on-site sanitation in South Africa suggest the current relevance of the findings.
METHODOLOGY
Description of the study sites
The field work discussed in this paper was carried out in the settlement of Ivory Park, situated approximately midway between Pretoria and Johannesburg in Gauteng Province, about 5 to 10 km east of the N1 highway (see Fig. 1). The settlement was developed between 1990 and 1993 as a 'greenfield' site of about 750 ha (nominally 1.5 km x 5 km) in size, consisting of between 15 000 and 20 000 sites, with an estimated population of between 75 000 and 100 000 people. The area was initially provided with a basic level of service, including standpipes shared between 20 and 25 households, low-flush on-site sanitation systems, and graded roads, with each site having an area of about 200 m2. These were the conditions under which this investigation was carried out.
Over a period of several years, from about 1994 to 2004, the low-flush on-site sanitation systems were replaced by full water-borne systems (Engineering News, 1999, City of Johannesburg, 2005) on the grounds that, in some areas of the settlement, the ground conditions were not sufficiently permeable to retain the effluent, which surfaced in places. There was also no separate provision for greywater disposal. It should be noted that no reports of effluent surfacing were encountered in or near the study sites investigated in this paper.
Mean annual precipitation (MAP) and mean annual evaporation (S Pan) (MAE) in Ivory Park are approximately 700 mm and 1 700 mm, respectively (Midgley et al., 1994). It is a summer rainfall area, with rainfall generally occurring between October and March. Average daily maximum and minimum temperatures for Johannesburg and Pretoria are 22/10°C and 25/12°C respectively (South African Weather Service, 2011). Temperatures for Ivory Park fall about midway between the two (i.e. about 23/11°C).
Three sites in Ivory Park were selected for this study. These sites were chosen to satisfy the following requirements:
• Representative of a 'typical' household
• Located in such a way that test results would not be influenced in any way by latrines on adjacent properties
• Located on a significant slope so as to be able to predict the major direction of movement of the contaminant plume
All three sites had the same type of low-flush on-site sanitation system, which is described as follows and illustrated in Fig. 2 (taken from PDG et al., 1992):
The Atlas aqua-privy has a seat integrated with a flush pedestal having an opening at the bottom; the seat/pedestal can be lifted. Below the flush pedestal/seat is a conical chute similar to the original aqua-privy with the bottom of the chute penetrating just below the water level in the digester tank. Above and behind the flush seat is a water supply tank (30 L) with a 0.8 Lflush tank below. Opening the flush valve discharges the 0.8 L from the flush tank to the flush seat, in a spiral motion washing the faeces through the conical chute to the digester tank. The digester tank has a liquid volume of approximately 150 L. The take-off from the tank to the soakaway is at about 1/3 depth below the [top of the pedestal/ digester tank]. The discharge is piped (50 mm diameter) to a discharge sump box set in the soakaway surrounded by a 20 mm stone [L indicated as 'litre' in source].

Details of the selected sites are given in Figs 3 to 7. The sites were also chosen such that the soil profile at all three sites was similar. In general, it consisted of an upper layer of transported silty sand extending from the ground surface to depths of between 0.4 m and 0.8 m, underlain by angular vein quartz gravel and occasional ferruginous concretions. This layer was usually 0.2 m - 0.3 m thick and was significantly denser than the overlying material. Beneath this layer and extending the full depth of the deepest hole augered was a stiff sandy clay (residual granite). The natural water table was more than 15 m below ground surface. Seven particle-size distribution tests were carried out on soil from the upper layer and all samples were classified as SW, i.e., a well-graded sand. The soil was fairly homogeneous, with no obvious macropores in evidence. Field permeability tests were carried out at 2 of the 3 sites studied, i.e., Stand 4239 and Stand 4687. A Guelph permeameter (Reynolds and Elrick, 1985) was used for the tests. The permeabilities varied between 10-6 and 10-5 m-s-1.
In-situ moisture contents for samples taken up-gradient from the test sites were 9-10%, and the soil was dry to the touch. Full saturation corresponded to about 20% moisture content.
Effluent testing programme
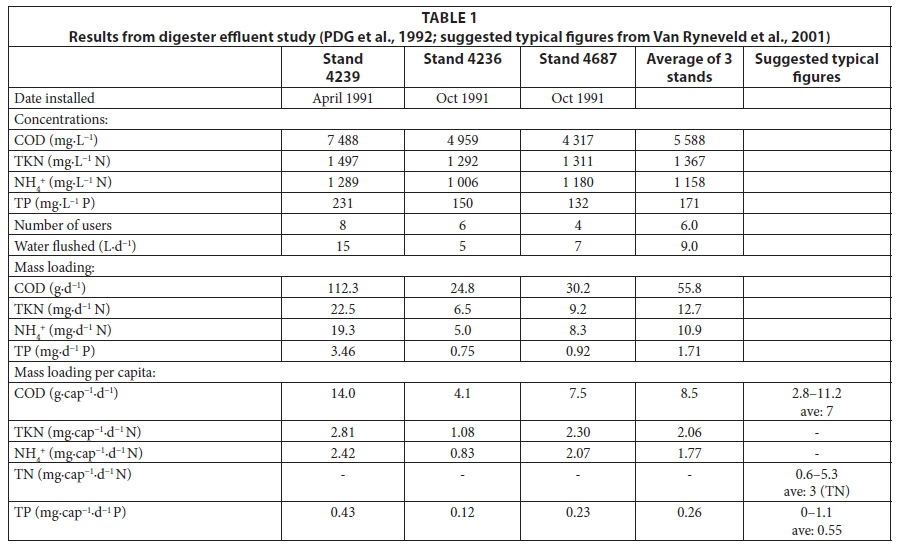
The effluent from the digester tank flows into the soakaway, from where it seeps into the ground. The effluent testing programme was carried out under a separate investigation by PDG et al. (1992). The samples used in the testing were taken at the point where the effluent from the digester flows into the soakaway. (From an experimental point of view, an advantage of this type of sanitation system over a VIP is that the effluent discharged to the soakaway can be sampled and measured much more easily and accurately). A total of 6 samples were taken from each of 3 units, over the period August 1992 to March 1993. The results of the effluent tests, and related information, are summarised in Table 1 below.
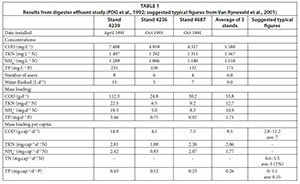
It is evident that there is considerable variability between the three units in terms of concentrations, water use and mass loadings. The unit on Stand 4239 had been in use for longer than the others and was used by more people. Therefore there is the possibility that the digester was full of sludge which would mean that higher loads were being transferred to the soakaway.
Typically, the soakaways at Ivory Park were underdesigned and were flooded. This meant that some further treatment may have been taking place in the soakaway. The soakaways at the three sites were not excavated. However, based on excavations at Duduza (PDG et al., 1992), the designed dimensions of the soak-aways were typically 600 mm x 600 mm (plan) x 300 mm (depth) of 20 mm stone (giving a volume of about 100 L), and extending to a depth of 600 mm below the ground surface. An evaluation of the aqua-privy systems in Ivory Park (PDG et al., 1992) found that '.... [a]t Ivory Park, the units were newly installed and had only been in operation for 4 months. None of the units showed signs of failure. A stand was selected at random ... which had three people using the unit. The tank showed a 10 to 40 mm scum layer and a 30 mm sludge layer. On opening up the soakaway, it was / to ¾ filled with liquid.' This treatment is unlikely to lead to nitrogen and phosphorus losses but the COD may be reduced. Therefore the organic strength of the flow seeping into the ground may be somewhat lower than that flowing into the soakaway.
A further point to be noted when comparing the results from the digester effluent study with the results of the unsaturated zone study is that the samples used in the digester effluent tests were not filtered and so would include particulate COD or other contaminants, whereas, with the exception of the tests carried out directly on the soil, the samples used in the unsaturated zone study were filtered.
Brief explanation of the choice of tests for subsurface samples
Tests on the subsurface samples were carried out on four main groups of contaminants:
• Bacteriological indicators
• Carbon (organic solids and COD)
• Nitrogen (TKN, ammonia/ammonium, nitrate and nitrite)
• Phosphorus (TP and phosphate)
Bacteriological indicators used were:
• Coliforms
• Escherichia coli (E. coli)
• Faecal streptococci
There are two principal groupings of coliform bacteria, namely, the faecal coliforms (FC) (comprising mainly the bacterium Escherichia coli, which may infect the urinary tract of man and cause cystitis), and the total coliform group, that includes the faecal coliforms. An average adult may be expected to excrete approximately 2 x 10⁹ coliform bacteria per day (Mara, 1976). Faecal coliforms are exclusively faecal in origin, whereas total coliforms, although commonly found in faeces, also occur naturally in unpolluted waters and soils. Of the total coliforms found in fresh faeces of warm-blooded animals, generally > 90% are E. coli. Only the faecal coliforms (especially E. coli) are definitive indicators of faecal pollution. E. coli are, however, also found in the intestines of other warm-blooded animals aside from humans.
The faecal streptococci (FS) are a group of bacteria that are mostly found in the intestines of man and other warmblooded animals. Their presence usually therefore indicates faecal pollution, although some strains are non-faecal in nature. Aside from this potential problem, faecal streptococci have some major advantages as faecal indicators. They are less prone to regrowth, and generally survive somewhat longer than faecal coliforms. They may therefore be better indicators of excreted bacterial pathogens that have little regrowth tendency, as well as excreted viruses, (that survive for longer than faecal coliforms in cool water).
The ratio of FC/FS sometimes gives an indication of whether faecal contamination is of human or animal origin, although this has been refuted in certain studies. It should also be noted that whilst the presence of E. coli or FS in samples is an indicator of faecal contamination, the absence of these indicators does not prove that there has been no contamination.
It should also be noted that viruses, being much smaller than bacteria, are likely to travel further than bacteria. However because of the relatively complicated nature of the tests no viral indicator tests were carried out in this study.
Chemical oxygen demand (COD) tests were carried out as an indicator of the organic content of the water samples. There is no simple test that can be performed directly on the soil that is equivalent to the TKN test carried out directly on the soil sample. The closest is the test for measuring the amount of organic (or volatile) solids, in which the organics are burned off in an oven at high temperature. The results are not directly comparable to those of the COD test as they are expressed in g-kg"1 of soil rather than mg-kg"1 O2 of soil. However a relationship between COD and volatile solids (VS) has been established for sludges derived from activated sludge processes treating municipal effluents. It is expressed in terms of a ratio, called the COD/VS ratio, which has been given the symbolf for activated sludge and has been found to remain substantially constant (at 1.48 mg COD-mg"1 VS) (UCT et al., 1984). Whether the same ratio holds for organics in soil has not been established. In spite of this, the organic solids test was carried out on the soil samples in this study and the ratio tentatively used as a basis for comparison of organic content in the soil samples with that of the extracted water samples.
Tests were included on nitrogen in all forms. Total nitrogen is made up of nitrogen measured as total Kjeldahl nitrogen (TKN), nitrate and nitrite. The convention is to express all measurements in terms of the mass of nitrogen in the compound. TKN is a measure of organic nitrogen (nitrogen bound into organic molecules), and nitrogen in the form of ammonia (NH3) and the ammonium ion (NH4+). In measuring ammonium (NH4+), nitrogen in the ammonia form (NH3) is generally included, but at neutral to lower pH the concentration of nitrogen in the ammonia form is likely to be small in relation to the concentration in the ammonium form. Nitrogen in the nitrate form is the likely end product of nitrogen breakdown in the unsaturated zone where conditions would be expected to be aerobic. It is typically in this form that nitrogen will be carried longer distances with the groundwater flow. In water under normal aerobic conditions the concentration of nitrite would be expected to be low, generally negligible, as nitrite is rapidly oxidized to nitrate. The occurrence of high nitrite levels would indicate some oxygen presence, but insufficient to promote the transformation to nitrate.
Total N in the soil is made up of three major forms:
• Organic N associated with the soil humus
• Ammonium N adsorbed by certain clay minerals
• Soluble inorganic ammonium and nitrate compounds
The first form (organic N) is usually the predominant form. However, up to 40% of nitrogen in the soil may be in the form of ammonium adsorbed by clay minerals, although it is usually much lower. Only 1 or 2% occurs in the form of soluble inorganic ammonium or nitrate compounds except where extensively fertilised (Brady, 1984).
In the case of phosphorus, the total phosphorus (TP) measurement includes phosphorus in the phosphate form (PO4) and phosphorus which is bound up in organic molecules (organic P). With bio-degradation P can be expected to be converted from organic P to the phosphate form. Phosphates are generally adsorbed onto soil particles, particularly in clayey conditions.
Preparation and laboratory testing procedure for subsurface samples
The main round of subsurface contaminant movement tests was carried out in December 1992, with a limited round of preliminary tests being carried out in August 1992. The primary purpose of the August tests was to obtain an indication of the magnitude and the extent of the contamination and to develop suitable sampling and testing procedures. A further purpose of these tests was to obtain an indication of levels of contamination at the end of the dry season before the onset of the summer rains.
The objective of the sample preparation was two-fold. It was to obtain samples which:
• Were most accurately representative of the level of contaminants which had originated from the digester tank effluent (rather than the background levels of contaminants in the soil itself) and could be leached out and transported. (It was considered that contaminants that could not be leached out or transported were of no concern.)
• Could be examined using standard methods for the examination of water and wastewater so as to be able to compare results with those performed directly on the digester tank effluent.
Sampling was taken by augering to a depth of about 20 cm above the required sample position using a power auger. The soil sample to be tested was then obtained using a hand auger, which was washed with distilled water after each sample was taken, in order to prevent cross-contamination.
The mechanism of transport of contaminants in the unsaturated zone of the subsurface may be described as follows: As water is introduced into the soil by successive flushings of effluent from the digester to the soakaway, moisture moves through the unsaturated zone by successive wetting fronts, carrying contaminants along with it as it goes. These contaminants may be dissolved in the soil moisture or carried along in suspension (large-sized contaminants being filtered out physically by the soil).
Because the water table was at some depth all the samples taken were in the unsaturated zone. At the moisture contents encountered, they were not water samples but rather slightly moist soil samples. Because of the low moisture content, there was not enough moisture in the soil to centrifuge it out. The contaminants therefore had to be washed out, with known quantities of solute, except where it was possible to carry out direct digestion procedures on the soil itself.
The matter of distinguishing the digester effluent contaminants from the background was addressed by taking background samples to provide a reference point. At each site a background sample was taken at a location assumed to be unaffected by the contaminant plume, on the uphill side of the soakaway at a distance of 3 m from the soakaway.
Laboratory testing procedures followed the Standard Methods for the Examination of Water and Wastewater (APHA et al., 2012).
Bacteriological tests
For the August set of samples, three methods for sample preparation were followed:
• 5 min of agitation by mechanical shaker
• 5 min of agitation by magnetic stirrer
• 1 min of 'stomacher' agitation
Despite the use of a range of magnet sizes, the magnetic stirrer method proved unsuccessful as a result of the high relative density of the soil particles. The 'stomacher' method also proved unsuccessful as the solid particles damaged the plastic containers, resulting in a loss of some of the sample. The mechanical shaker method proved suitable, producing even mixing, and was used for preparation of all the samples tested.
A 1 in 10 dilution (20 g soil + 180 g diluent) was used, and samples for testing were derived from filtering a 50 mL volume of this dilution.
For the December set of samples, only the mechanical shaker method described above was followed. This time, however, a 1 in 5 dilution (50 g soil + 200 g diluent) was used. The mixture was then filtered through a sterile coarse filter paper. 50 mL of the filtrate was then used for each of the microbiological assessments.
Chemical tests
Two methods were used for sample preparation:
• For the August set of samples, 500 mL of distilled water was added to 25 g of soil. It was then shaken on a shaking table for 24 h, centrifuged and filtered through a fine filter paper, before the tests were performed on filtrate. Total Kjeldahl nitrogen (TKN) and total phosphorus (TP) tests were also carried out directly on the soil before washout as well as on the soil after washout.
• For the December set of samples, the same method was followed. Additionally, however, certain tests were carried out using potassium chloride (KCl) instead of distilled water to extract the samples. For this additional set of tests, a smaller sample of soil was used (2.5 g soil + 25 mL KCl) and the sample was shaken for 2 h instead of 24 h. However, this method was considered to be too aggressive to replicate natural leaching of contaminants from the soil.
RESULTS AND DISCUSSION
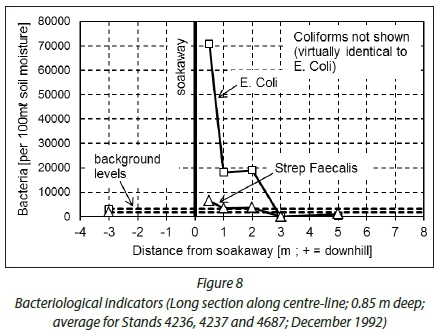
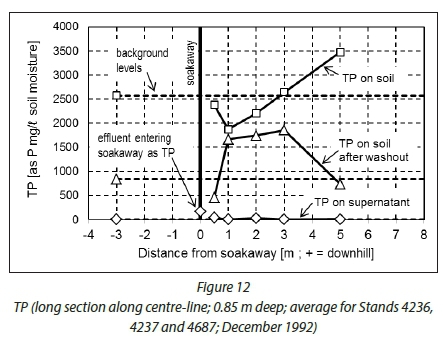
The results of the laboratory tests are summarised in Figs 8 to 12. All figures are long sections along the centre-line, at a sampling depth of 0.85 m (see Fig. 7). Results of the subsurface sampling are the average measurements for Stands 4236, 4237 and 4687, for December 1992.


For all three sites, four additional samples to those reported in the above figures were taken. Two of each of these samples were at a depth of 1.5 m, at distances of 0.5 m and 2 m from the soakaway. The remaining two samples at each site were taken at the reference depth of 0.85 m at a horizontal distance of 1 m from the soakaway, but at perpendicular offsets of 1 m to the left and right of the reference sampling line (see Fig. 7).
Bacteriological indicators
All the results indicate a very rapid drop-off of contamination with distance from the soakaway. At horizontal distances of 3 m from the soakaway, levels of the measured bacteria had dropped to values consistent with the background levels. Results reported in the literature indicate that subsurface movement of faecal bacteria is usually very limited (of the order of 1-2 m) unless both a very shallow water table is present and a high water table gradient exists (and with the nature of the soil immediately in contact with the contamination playing an important part) (Caldwell and Parr, 1937; Caldwell, 1938; Romero, 1972; Lewis et al., 1980; Crane and Moore, 1984). As summarised by Fourie and Van Ryneveld (1995), it appears that as long as there is a relatively thick layer of intact, unsaturated soil between the source of contamination and the groundwater, bacterial contamination will not be a major problem. The same may be true for a saturated soil, where natural processes would reduce bacterial concentrations; however, our work did not investigate this matter, given that we worked in an area where the water table was deep.
It is evident that in one particular case (Stand 4687), the background level of Strep faecalis was high. Noting that the background sampling sites were 3 m up-gradient of the soakaways, this elevated level was attributed to the infiltration of contaminated surface stormwater run-off.
Carbon
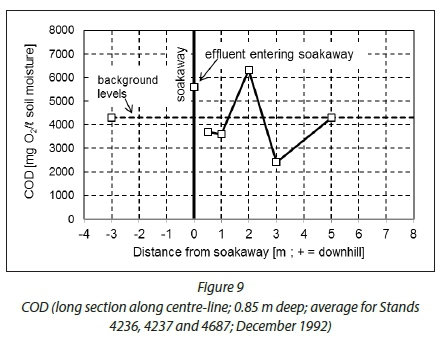
The background levels of COD in the soil were not much different from the digester tank effluent values. The measured digester tank value is indicated as 'effluent entering soakaway' in Fig. 9.
Values of COD measured at all sampling points downhill of the soakaway at all three sites were of the same order as those shown in Fig. 9, with the values for deeper samples usually being about 50% of the average background value. One exception was the deep sample at a distance of 0.5 m from the soakaway of Stand 4687, where a COD of 5.3 g-L-1 of soil moisture was measured. The similarity between the background values, the digester tank effluent values and the values in Fig. 9 seem to indicate that substantial treatment is taking place within the soakaway or within the immediate vicinity thereof. The impact of the on-site sanitation systems in terms of additional oxidisable carbon therefore appears to be negligible.
Nitrogen
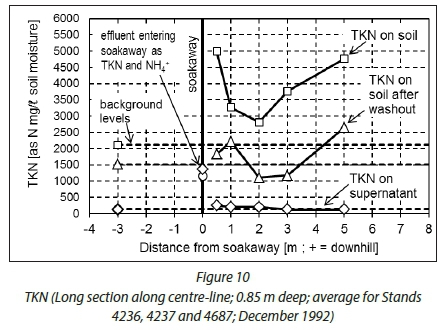
The results of tests in which distilled water was used as diluent are shown in Figs 10 and 11. Figure 10 shows results for TKN, which is a measure of organic nitrogen, nitrogen in the form of ammonia (NH3) and the ammonium ion (NH4+). Figure 11 shows results for nitrogen in the form of ammonium (NH4+), nitrate and nitrite. The two figures should be read in conjunction with one another. Note that the value of ammonium (NH4+) measured in the digester tank effluent is indicated as 'effluent entering soakaway as ... NH4+ on both figures. Note too that the closeness in the values of TKN and ammonium (NH4+) (about 1 350 and 1 150 mg-L-1 N respectively) in the digester tank (both shown in Fig. 11) indicates that most of the TKN entering the soakaway is already in the form of ammonium. Three sets of TKN results are given in Fig. 10: on the soil, on the soil after washout of contaminants, and on the supernatant.
The sum of the TKN values on the supernatant and on the soil after washout should add up to the same as the TKN directly on the soil. They add up to about three quarters of the value. An explanation for this is that the acid digestion of the soil (which is carried out only for the TKN directly on the soil) 'scours' nitrogen from the soil itself which is not released by any wash-out technique.
The background values for nitrogen (in the form of TKN) in the soil are high, which is consistent with values for nitrogen obtained from the literature. Although information in the literature is scant, as a first estimate for soil in a semi-arid climate, Brady (1984) suggests 1 200 mg N-kg-1 for nitrogen. This explains why the TKN value of the soil can be higher than that of the digester tank effluent. It also suggests that TKN tests performed directly on the soil are not representative of the level of contaminants which have originated from the digester tank effluent (rather than the background levels of contaminants in the soil itself) and could be leached out and transported.
The TKN values on the supernatant on the other hand are low compared to those of the digester tank effluent. This would be indicative of considerable nitrification in the vicinity of the soakaway.
As indicated, Fig. 11 shows results for nitrogen in the form of ammonium (NH4+), nitrate and nitrite. The background values for both nitrite and nitrate were zero.
Notwithstanding the values reported in Fig. 11, nitrate and nitrite levels were very low at most sampling locations, e.g., for Stands 4236 and 4687 the readings were mostly zero. Levels of nitrate for Stand 4239, on the other hand, were of the order of 400 mg-L-1 N, with a value of 850 mg-L-1 N at a distance of 1 m from the soakaway and 1 m to the right of the sampling line. The subsurface itself is heterogeneous and hence distributions of contaminants, which are moving in the unsaturated zone, are always going to be heterogeneous as well. In this instance, however, this effect may be attributable to the higher mass loadings applied to the soakaway on Stands 4239 (NH4+ loading of 19.3 mg-d-1 N as opposed to 5.0 and 8.3 mg-d-1 N for Stands 4236 and 4687, respectively).
In summary, the results once again show a general, very rapid decrease in contaminant value with distance from the soakaway, although there are slight exceptions, e.g., at Stand 4239 the peak values of ammonia and nitrate occur at 1 m (rather than 0.5 m) from the soakaway. At all three sites, within 2-3 m from the soakaway the contaminant levels have decreased to levels consistent with the background values.
Nitrate is regarded as a conservative tracer and may migrate into surface water or groundwater bodies under certain conditions, e.g., if a shallow water table is present. It is, therefore, usually considered one of the major contaminants of concern associated with on-site sanitation systems (Lewis et al., 1980).
The present study, however, shows that with a source that is up to approximately 18 months old, the movement of nitrate within a relatively high permeability, unsaturated sand has not been more than 3 m.
The concentrations of nitrogen measured in the subsurface reflect two different processes: firstly, the physical movement of the contaminants in the subsurface, and, secondly, biogeochemi-cal processes, which may include nitrification and/or denitri-fication (and gaseous loss to the atmosphere). With respect to physical movement, it is known that the hydraulic conductivity of the soil decreases very rapidly with decreasing moisture content (Bear and Cheng, 2010). Contaminants will therefore move much more slowly through an unsaturated soil - as in this case - than through a saturated soil. With respect to biogeochemi-cal processes, an unusual finding was the high nitrite levels at a distance of 0.5 m from the soakaway at all three sites. Since the conversion of nitrite to nitrate (nitrification) is extremely rapid under aerobic conditions, this suggests that close to the soaka-way anoxic conditions prevail. A review by Rivett et al. (2008) indicates that the conditions under which denitrification occurs in the subsurface are relatively well known, and require all the following conditions to be met:
• Presence of nitrate, denitrifying bacteria and electron donor (organic carbon, reduced iron and/or reduced sulphur)
• Anaerobic conditions (dissolved oxygen concentrations less than around 1-2 mg-L-1)
• Favourable environmental conditions (e.g. temperature, pH, other nutrients and trace elements)
The review goes on to indicate that the critical limiting factors for denitrification are the presence of anaerobic conditions and the presence of a suitable electron donor (most commonly organic carbon). Furthermore, McKeon et al. (2005) do describe one case of surprisingly rapid denitrification. It is possible that a combination of the subsurface conditions, together with the extended residence time, as the contaminants have travelled further from the soakaway, has facilitated the denitrification process. If denitrification were to occur in the unsaturated zone under these climatic conditions, it would be a significant finding of this study. However, from the field data available, although it is possible, it is not conclusive.
Phosphorus
Figure 12 shows results for TP, which is a measure of organic phosphorus, and phosphorus in the form of phosphate (PO4). Distilled water was used as a diluent. In similar manner to TKN, three sets of TP results are given in Fig. 12: on the soil, on the soil after washout of contaminants, and on the supernatant. The background figures for TP measurements carried out directly on the soil are high, but consistent with values reported in the literature. Brady (1984) suggests a figure of 400 mg-kg"1 P for phosphorus. In similar manner to TKN (Fig. 10), however, the high background levels, as well as the fact that the values of TP measurements carried out directly on the soil are considerably higher than those of the digester tank effluent, indicate that TP tests performed directly on the soil are not representative of the level of contaminants which have originated from the digester tank effluent (rather than the background levels of contaminants in the soil itself) and could be leached out and transported.
Phosphate (PO4) values for samples that used distilled water as a diluent were below detection limits. Additional samples for testing were prepared by mixing 1 N of potassium chloride (KCl) with the soil sample (2.5g soil + 25 mL KCl), which did yield detectable results of about 350-400 mg-L"1 P. However, for similar reasons to the use of TP tests performed directly on the soil, the use of KCl as a diluent was considered too aggressive to replicate natural leaching of contaminants from the soil.
A behavioural observation made during the drilling and sampling programme was that homeowners were frequently observed to discard their grey water onto the ground surface at a reasonable distance from the dwelling. If there was any slight increase in phosphorus with distance from the soakaway, this could be a possible cause.
Discussion of the rate of movement of contaminants in the subsurface
In order to predict the possible rate of subsurface contaminant movement for the case of Ivory Park described above, it could be assumed that an upper bound estimate of movement is provided by assuming that fully saturated flow would occur parallel to the ground surface. This implicitly assumes that there is sufficient water emerging from on-site sanitation systems up-gradient of the point in question to maintain this flow regime. This is clearly an over-simplification of likely conditions and is over-conservative. Nevertheless, it is consistent with the intention of providing a worst-case scenario.
The rate of groundwater movement, v, was estimated from:
V = hi
where: k = saturated hydraulic conductivity and
i = hydraulic gradient (which is the rate of head loss per unit distance of travel; the hydraulic gradient is approximated by the natural ground slope).
In unsaturated soils, i is increased by suction in the soil, i.e., i is not the gradient of the soil surface, but could be much greater. In such conditions, however, both the volume of the moisture and the hydraulic conductivity would be considerably smaller than in saturated conditions. Exactly how the combination of these parameters will affect the contaminant mass flows requires further investigation. Nevertheless, the combination of parameters for saturated conditions (as given above) appears to give high - if not upper-bound - estimates of contaminant flow velocities.
Using values from this investigation for the hydraulic gradient (approximated by natural ground slope, i = 5%) and a saturated hydraulic conductivity (k = 10-5 m-s-1), the methodology yields a flow velocity of 15 m-a"1. By comparison, contaminants as measured in the subsurface at Ivory Park appear to have moved not more than 3 m in 18 months, i.e., not more than 2 m-a-1.
Rate of movement of contaminants by wash-off from the ground surface, and transport within the surface watercourse to an impoundment in Gauteng is likely to be very significantly faster. Contamination of impoundments in Gauteng from surface water run-off is therefore likely to be far more significant than subsurface flows.
Although measurements of the vertical movement of contaminants were more limited, the rate of decrease of the contaminant concentrations in the vertical direction was slightly steeper than the rate of decrease in the horizontal direction: at 1.5 m below ground surface and 0.5 m from the soakaway, the contaminant concentrations were roughly the same as at 0.85 m depth and 2 m from the soakaway. Alternatively, the movement of contaminants was slower in the vertical than in the horizontal direction.
CONCLUSIONS
Despite the large discrepancy between the upper- and lower-bound estimates of contaminants in the soil that might be transported, a comparison of results obtained using various experimental techniques indicated that the contaminant concentrations obtained using the distilled water washout technique were most representative of the level of contaminants which would travel in the subsurface.
The following specific conclusions may be drawn from the results, applicable to these particular climatic and subsurface conditions:
The impact of the on-site sanitation systems in terms of COD appears to be negligible, with substantial treatment appearing to be taking place within the soakaway or within the immediate vicinity thereof.
With respect to (i) bacteriological indicators, (ii) nitrogen (in the form of ammonium, nitrite and nitrate) and (iii) phosphorus (in the form of total phosphorus), using the distilled water washout technique, there is a very rapid drop-off of contamination with distance from the soakaway. At horizontal distances of 3 m from the soakaway, levels of the measured contaminants had dropped to values consistent with the background levels.
As the sanitation systems had been in use for about 18 months, the above values imply a horizontal velocity of movement of contaminants of approximately 2 m-a-1.
Although measurements of the vertical movement of contaminants were more limited, the rate of decrease of the contaminant concentrations in the vertical direction was slightly steeper than the rate of decrease in the horizontal direction. Alternatively, the movement of contaminants was slower in the vertical than in the horizontal direction.
From the above results, it can be deduced that movement in the unsaturated zone of bacterial indicators, nitrogen and phosphorus from low-flush on-site sanitation systems from low-income areas is very limited, as long as the effluent remains in the subsurface.
The results of this study are not confined to this particular sanitation system, but can be considered to have more general application to other low-flush systems such as the Indian-style pour-flush latrine and dry on-site sanitation systems such as the ventilated pit latrine (VIP). By virtue of the higher hydraulic loading, these results provide an upper bound for contaminant movement from dry on-site systems under similar conditions.
ACKNOWLEDGEMENTS
The information contained in this paper emanates from a project funded by the Water Research Commission of South Africa, entitled 'Technical, socio-economic and environmental evaluation of sanitation for developing urban areas in South Africa' (WRC Project No. 385), carried out by Palmer Development Group in association with the Water Research Group at the University of Cape Town. This particular work, which was initially reported on in one of the working papers of the umbrella project (Working Paper B3.4), contributed to the project as a whole, and to the Ivory Park case study more specifically. The funding of the further write-up of this work by the Water Research Commission of South Africa (WRC Project No.K8/784) is also gratefully acknowledged.
REFERENCES
APHA, AWWA and WEF (American Public Health Association, American Water Works Association and Water Environment Federation) (2012) Standard Methodsfor the Examination of Water and Wastewater (22nd edn). Rice EW, Baird RB, Eaton AD and Clesceri LS (eds.). American Public Health Association, Washington, DC. [ Links ]
BEAR J and CHENG AH-D (2010) Modeling Groundwater Flow and Contaminant Transport. Springer, New York. [ Links ]
BRADY NC (1984) The Nature and Property of Soils. MacMillan Publishing Company, New York. [ Links ]
CALDWELL EL and PARR LW (1937) Groundwater pollution and the bored hole latrine. J. Infect. Dis. 61 272-292. [ Links ]
CALDWELL EL (1938) Studies of subsoil pollution in relation to possible contamination of the groundwater from human excreta deposited in experimental latrines. J. Infect. Dis. 62 148-183. [ Links ]
CDE (Centre for Development and Enterprise) (2002) Johannesburg: Africa's World City: A Challenge to Action. CDE Research: Policy in the Making 11. CDE, Johannesburg. October. 13. [ Links ]
CITY OF JOHANNESBURG (2005) Annual Report 2003/04. March. URL: http://www.joburg-archive.co.za/city_vision/performance_report (see Chapter 12: Municipal service entities) (Accessed January 2011). 106-107. [ Links ]
CITY OF JOHANNESBURG (2010) Integrated Development Plan 2010/11. URL: www.joburg.org.za/index.php?option=com_content&task=view&id=5236&Itemid=114 (Accessed December 2010). 190-191, 199. [ Links ]
CRANE SR and MOORE JA (1984) Bacterial pollution of groundwater: A review. Water, Air Soil Pollut.22 67-83. [ Links ]
COGTA (Department of Cooperative Governance and Traditional Affairs, South Africa) (2009) State of local government in South Africa, overview report: National state of local government assessments. URL: www.pmg.org.za/report/20100728-department-co-operative-governance-and-traditional-affairs-local-gove (Accessed January 2011). 24, 39, 43-45, 50. [ Links ]
DPME, DHS AND DWA (Department of Performance Monitoring and Evaluation in the Presidency, in collaboration with The Department of Human Settlements and The Department of Water Affairs) (2012) Sanitation services - quality of sanitation in South Africa: Report on the state of sanitation services in South Africa, executive summary. March 2012. URL: www.sahrc.org.za/home/21/files/Quality%20of%20sanitation%20-%20Exec%20Summary%20%28Fin%29.pdf%20III.pdf (Accessed April 2012). 2, 3. [ Links ]
DWA (Department of Water Affairs, South Africa) (2010) Strategic overview of the water sector in South Africa 2010. Prepared by Directorate: Water Services Planning & Information, DWA, August 2010. 29, 33. [ Links ]
DWAF (Department of Water Affairs and Forestry, South Africa) (2003) Strategic framework for water services. September 2003. DWAF, Pretoria. 6 [ Links ]
DWAF (Department of Water Affairs and Forestry, South Africa) (2007) Protocol to Manage the Potential of Groundwater Contamination from On Site Sanitation. October 2007. Chief Directorate: Sanitation, DWAF. URL: www.dwa.gov.za/dir_ws/waterpolicy (see 'WS/WR Tools and Guidelines': 'Groundwater Protocol') (Accessed January 2011). [ Links ]
ENGINEERING NEWS (1999) Article: Sanitation project hits funds snag, 5 February 1999. URL: www.engineeringnews.co.za/print-version/sanitation-project-hits-funds-snag-1999-02-05 (Accessed January 2011). [ Links ]
FOURIE AB and VAN RYNEVELD MB (1993) Sub-surface impact of low flush on-site anaerobic digesters in Ivory Park. In: Palmer Development Group in association with University of Cape Town Water Research Group (eds.) Technical, socio-economic and environmental evaluation of sanitation for developing urban areas in South Africa. Working Paper B3.4 of WRC Report No. 385/1/93. Water Research Commission, Pretoria, South Africa. [ Links ]
FOURIE AB and VAN RYNEVELD MB (1995) The fate in the subsurface of contaminants associated with on-site sanitation: A review. Water SA 21 (2) 101-111. [ Links ]
GCRO (Gauteng City Region Observatory) (2010) Map: The GCR and adjacent local municipalities. URL: www.gcro.ac.za/maps-gis/basic (Accessed January 2010). [ Links ]
JOHANNESBURG WATER (nd) Service delivery options: Water & sanitation service delivery. URL: www.johannesburgwater.co.za/water-and-sanitation/infrastructure/ (Accessed January 2011). [ Links ]
KUNENE Z (2010) Provision of sanitation in informal settlements in the City of Johannesburg. Proc. WISA Biennial Conference and Exhibition 2010, 18-22 April 2010, Durban. [ Links ]
LEWIS WJ, FOSTER SSD and DRASAR BS (1980) The risk of ground- water pollution by on-site sanitation in developing countries: a literature review. IRCWD Report No. 01/82. International Reference Centre for Wastes Disposal (IRCWD), Duebendorf, Switzerland. [ Links ]
MARA D (1976) Sewage Treatment in Hot Climates. John Wiley and Sons, New York. [ Links ]
MCKEON CA, JORDAN FL, GLENN EP, WAUGH WJ and NELSON SG (2005) Rapid nitrate loss from a contaminated desert soil. J. Arid Environ. 61 119-136. [ Links ]
MIDGLEY DC, PITMAN WV and MIDDLETON BJ (1994) Surface Water Resources of South Africa 1990: Volume I: Drainage Regions A, B, Limpopo-Olifants, Appendices, WRC Report No. 298/1.1/94 (1st edn). Water Research Commission, Pretoria, South Africa. [ Links ]
PDG and UCT (Palmer Development Group and University of Cape Town) (1992) Technical evaluation of on-site low-flush anaerobic digesters in Ivory Park and Duduza. In: Palmer Development Group in association with University of Cape Town Water Research Group (eds.) Technical, socio-economic and environmental evaluation of sanitation for developing urban areas in South Africa, Working Paper B3.1 of WRC Report No. 385/1/93. Water Research Commission, Pretoria. [ Links ]
PMG (Parliamentary Monitoring Group) (2016) Cooperative Governance and Traditional Affairs: Questions to the Minister. URL: https://pmg.org.za/committee-question/2372/ (Accessed 15 April 2016). [ Links ]
PUJARI PP, NANOTI M, NITNAWARE VC, KHARE LA, TAHCKER NP and KELKAR PS (2007) Effect of on-site sanitation on ground- water contamination in basaltic environment - A case study from India. Environ. Monit. Assess. 134 271-278. [ Links ]
REYNOLDS WD and ELRICK DE (1985) In situ measurement of field saturated hydraulic conductivity, sorptivity, and the alpha-parameter using the Guelph permeameter. Soil Sci. 140 292-302. [ Links ]
RIVETT MO, BUSS SR, MORGAN P, SMITH JWN and BEMMENT CD (2008) Nitrate attenuation in groundwater: A review of biogeo- chemical controlling processes. Water Res. 42 4215-4232. [ Links ]
ROMERO JC (1972) The movement of bacteria and viruses through porus media. In: Pettyjohn WA (ed.) Water Quality in a Stressed Environment. Burgess Publishing Company, Minnesota. 200-224. [ Links ]
SHIVENDRA BT and RAMARAJU HK (2015) Impact of onsite sanitation systems on groundwater in different geological settings in peri urban areas. Aquat. Procedia 4 1162-1172. [ Links ]
SAWS (South African Weather Service) (2011) Climate data. URL: www.old.weatherdata.co.za/Climat/Climstats (Accessed January 2011) [ Links ]
STILL D and NASH S (2004) Groundwater Contamination due to pit latrines located in a sandy aquifer: a case study from Maputaland. Unpublished report to Water Research Commission, Pretoria, South Africa. (Still D, personal communication). [ Links ]
STILL D, WALKER N and HAZELTON D (2009) Basic sanitation services in South Africa: Learning from the past, planning for the future. WRC Report No. TT414/09, Water Research Commission, Pretoria. [ Links ]
UNC A and GOSS MJ (2003) Movement of faecal bacteria through the vadose zone. Water, Air Soil Pollut. 149 327-337. [ Links ]
UCT, CITY COUNCIL OF JOHANNESBURG and CSIR NIWR (University of Cape Town, City Council of Johannesburg and CSIR National Institute for Water Research) (1984) Theory, design and operation of nutrient removal activated sludge processes. WRC Report No. TT 16/84. Water Research Commission, Pretoria, South Africa. [ Links ]
VAN RYNEVELD MB (1994) Costs and affordability of water supply and sanitation provision in the urban areas of South Africa, Water SA 21 (1) 1-14. [ Links ]
VAN RYNEVELD MB and FOURIE AB (1997) A strategy for evaluating the environmental impact of on-site sanitation systems. Water SA 23 (4) 279-291. [ Links ]
VAN RYNEVELD MB, MARJANOVIC PD, FOURIE AB and SAKULSKI D (2001) Assignment of a Financial Cost to Pollution from Sanitation Systems, with particular reference to Gauteng. WRC Report No. 631/1/01. Water Research Commission, Pretoria. [ Links ]
WRIGHT A (1999) Septic tank systems in the South African coastal zone. WRC Report No. 597/1/97. Water Research Commission, Pretoria. [ Links ]
Received 12 April 2012
Accepted in revised form 24 June 2016
* To whom all correspondence should be addressed. 083-391 1986; e-mail: mark@markvr.co.za

