


Services on Demand
Article
 English (pdf)
 Article in xml format
 Article references
Indicators

Related links
-
 Cited by Google
 -
 Similars in Google
Share

 Permalink
Water SA
On-line version ISSN 1816-7950
Print version ISSN 0378-4738
Water SA vol.42 n.3 Pretoria Jul. 2016
http://dx.doi.org/10.4314/wsa.v42i3.12
ORIGINAL ARTICLES
Evaluation of an inverse distance weighting method for patching daily and dekadal rainfall over the Free State Province, South Africa
Mokhele Edmond MoeletsiI, II, *; Zakhele Phumlani ShabalalaI; Gert De NysschenI; Sue WalkerIII
IAgricultural Research Council - Institute for Soil, Climate and Water, Private Bag X79, Pretoria, 0001, South Africa
IIRisks AND Vulnerability Assessment Centre, University of Limpopo, Private Bag X1106, Sovenga, 0727, South Africa
IIICrops for the Future, Jalan Broga, 43500 Semenyih, Selangor Darul Ehsan, Malaysia
ABSTRACT
Climate data recorded by national meteorological agencies is either incomplete or faulty for some periods due to a number of reasons. Multi-functional utilization of climate data in complete form necessitates the filling of these gaps. In this study an inverse distance weighting (IDW) method was used to estimate rainfall utilizing neighbouring station data in the Free State Province of South Africa. Six weather stations evenly distributed across the province, and with data for 1950 to 2008, were used to evaluate this patching IDW approach at daily and dekadal time steps. Coefficient of determination (r2), mean absolute error (MAE) and mean bias error (MBE) were the statistics used in the assessment. Firstly, the study conducted a sensitivity analysis of the IDW exponent (p) which showed that the best results are obtained when p is either 2 or 2.5. The estimated values at all six stations were highly correlated with the measured rainfall data with an overall r2 value exceeding 0.70 for both daily and dekadal estimates. MAE showed low miscalculations with values with an average of 1 mm per day and 4.4 mm per dekad. MBE was very low for both daily and dekadal evaluations but the disaggregated data showed underestimation of the IDW mostly for daily rainfall exceeding 10 mm. Thus, IDW methodology proved to be an acceptable approach for estimating both daily and dekadal rainfall in the Free State Province.
Keywords: estimation, missing data, neighbouring stations
INTRODUCTION
Measuring and archiving of different weather elements like rainfall, temperature or humidity is an important exercise. Long-term meteorological data can be used to influence decisions in different sectors including agriculture, aviation, hydrology and engineering. Accurate and complete climatological data is important for the successful design and operation of natural resource management systems (Gyau-Boakye and Schultz, 1994; Jeffrey et al., 2001). Weather data in South Africa dates back to the 1800s with rainfall being the most common element measured. There are a few stations around the country which recorded temperature, humidity and wind in the early 1900s but the number increased significantly from 1950 onwards. With the improvement in technology, automatic weather stations were introduced in South Africa in the 1990s and this helped to address shorter time-scale measurements like minute or hourly values. Increased frequency of measurements means better climate monitoring and understanding of weather occurrences with a life-cycle shorter than 1 day.
Regardless of the technology used to take the recordings, whether manual measurements or the use of electronic sensors, some of the data stored will be either faulty or missing. The gaps in the meteorological archives are caused mainly by absence of observers, vandalism, loss of records, data contamination, data-processing errors, effects of natural disasters like tornadoes or human-induced factors like wars, lack of funds for replacing broken instruments as well as instrument malfunctioning (Tang et al., 1996; Elshorbagy et al., 2000; Smithers and Schulze, 2000; Kim and Ahn, 2009; Villazón and Willems, 2010). Faulty data is mainly caused by observer's negligence, uncalibrated sensors and faultiness of the electronic sensors.
Missing or faulty climate data have to be estimated in order to provide a complete dataset, especially for modelling purposes. The accuracy of the estimations is dependent on a number of factors including the closeness of the stations used and the location of the patching stations in relation to barriers like mountains. There are three main techniques for estimating missing meteorological data, namely, empirical methods, statistical methods and function-fitting methods (Xia et al., 1999). The application of patching methods is dependent on the length of the gap, the season, climatic region, density of stations, and the characteristics of the data archived (Gyau-Boakye and Schultz, 1994).
There are a number of methods used to estimate missing rainfall values. The widely-used patching methods include: closest station, simple arithmetic averaging, inverse distance weighting, multiple regression and normal ratio (Tang et al., 1996; Makhuvha et al., 1997; Xia et al., 1999; Xia et al., 2001). In utilizing the closest station method, the nearest weather station with data corresponding to the period of concern is identified and missing values are either replaced directly by the value at the neighbour station or adjusted by a factor from the ratio of long-term means between the two stations (Xia et al., 2001). In simple arithmetic averaging, the missing data are obtained by arithmetically averaging data of the 2 to 5 closest weather stations around a station (Tang et al., 1996; Xia et al., 1999; De Silva et al., 2007). Inverse distance weighting utilizes the distances from the target station of 2 to 5 neighbour stations, giving more weight to data from the nearest weather station (Tang et al., 1996; Xia et al., 1999; De Silva et al., 2007; Chen and Liu, 2012). The multiple regression model employs step-wise regression to determine the coefficients for all the significant neighbour stations (Makhuvha et al., 1997; Xia et al., 1999), while the normal ratio method utilizes the correlation between the neighbour and target station as well as the number of paired datasets as the weight in estimating values at the target station (Tang et al., 1996; De Silva et al., 2007).
The study aimed to evaluate the use of the inverse distance weighting (IDW) method of estimating rainfall as a possible means of patching missing or faulty rainfall measurements. The method was chosen based on recommendations by Chen and Liu (2012) in a study carried out in Taiwan which yielded a high correlation between measured and estimated values. De Silva et al. (2007) compared the normal ratio, arithmetic averaging and inverse distance methods and concluded that the IDW method performed better than the other two methods in estimating rainfall in all the climate zones of Sri Lanka. Studies by Tang et al. (1996) also revealed that the IDW method has the potential of estimating missing rainfall values with minimum inaccuracy.
METHODOLOGY
The study investigates the use of the IDW method for estimating daily and dekadal rainfall in the Free State Province of South Africa. This is a deterministic estimation method where values at unsampled points are determined by a linear combination of values at known sampled points (Collins and Bolstad, 1996). It employs Tobler's Law by estimating unknown measurements as weighted averages over the known measurements at nearby points, giving the greatest weight to the nearest points (Collins and Bolstad, 1996; Longley et al., 2001; Oluoch et al., 2013). More specifically, IDW assumes that each measured point has a local influence that diminishes with distance and weights change according to the linear distance of the samples from the unsam-pled point (Li and Revesz, 2004). The spatial arrangement of the samples does not affect the weights (Collins and Bolstad, 1996). The weighting function is the inverse of the distance to the given exponent, so that the predicted value for a site is given by:
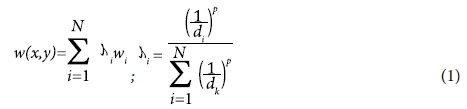
where: w (x,y) is the predicted value at location (x,y), N is the number of nearest known points surrounding (x,y), \i is the weight assigned to each known point value w. at location (xi,yi), di. is the Euclidean distance between each (xi,yi) and (x,y), and p is the exponent, which influences the weighting of wi on w (Li and Revesz, 2004).
If Eq. 1 is used to determine w at a location where w has already been measured it will return the measured value, because the weight assigned to a point at zero distance is infinite; for this reason IDW is described as an exact method of interpolation because its interpolated results honour the data points exactly (Longley et al., 2001). The IDW derived value is an average and it always returns a value that is between the limits of the measured values, i.e., no point in the interpolated surface that is more than the largest measured value or less than the smallest value (Longley et al., 2001).
To assess the method of patching rainfall over the Free State Province, 6 weather stations that are evenly distributed over the province were selected. The other criteria for selecting the stations were based on the percentage of missing data, which had to be less than 10%, and the selected stations were also required to have over 20 years of data records. Table 1 shows geographical information for the target stations while Fig. 1 shows the spatial distribution of all the weather stations in the Free State Province. Daily rainfall data was obtained from the Agricultural Research Council - Institute for Soil, Climate and Water (ARC-ISCW) Agrometeorology database and the South African Weather Service (SAWS).

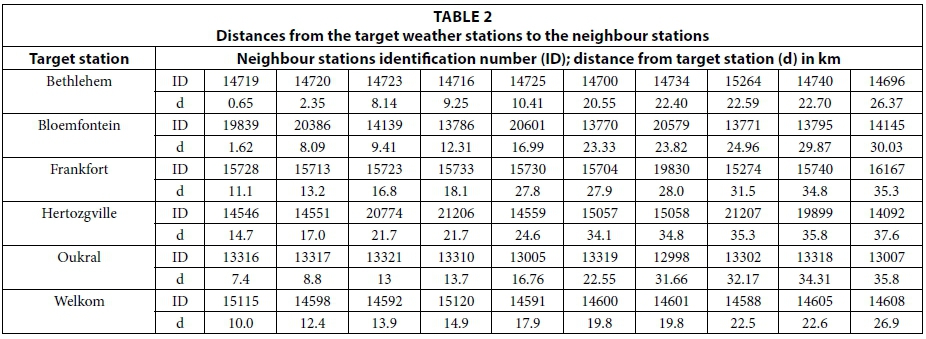
Before using the IDW methodology of patching, the accuracy of the method must first be tested. This was done by estimating daily rainfall data for the entire data range for each of the stations in Table 1 using Eq 1. A minimum of 2 and maximum of 5 nearest weather stations with data on that particular day of estimation were used. The methodology also considered only nearby stations within a 50 km radius of the target station (Table 2).
Sensitivity of the exponent (p)
To assess the sensitivity of the exponent (p) of the IDW equation, rainfall estimates were computed for p values ranging from 1 with an increment of 0.5 to 5. Results for each of the p values per target station were compared with observed rainfall data using coefficient of determination (r2), mean absolute error (MAE) and mean bias error (MBE). The values were ranked by assigning the lowest rank on the value that resembles the observed data. For the r2, the lowest rank was assigned to the exponent that results in the highest correlation. Ranking for the MAE and MBE was done in such a way that the lowest absolute value was assigned the lowest ranking value. An average of all the rankings was then obtained for stations and all the exponents, to determine exponents that result in good estimation of observed rainfall based on r2, MAE and MBE.
Evaluation of estimation of rainfall at different thresholds
The accuracy of estimates was also determined for low rainfall values (below 5 mm), 5-10 mm, 10-15 mm, 15-20 mm and for high rainfall values exceeding 20 mm. Estimated values in days when observed values were at the stipulated thresholds were then compared with measured values using the MAE and MBE.
Statistical analysis
To analyse the performance of the methodology used at each climate station, both daily and dekadal (10-day basis) values were utilized. In crop water modelling, dekadal time steps can be used to assess rainfall effects on crop production (Araya and Stroosnijder, 2011; Moeletsi and Walker, 2012). Daily values were aggregated to dekadal values. The first 10 days of the month are grouped as the 1st dekad of the month, the second 10 days (11-20) as the 2nd dekad and last 8 to 11 days (depending on the month and year) as the 3rd dekad of the month. The estimated daily and dekadal values were then compared with the measured values in days/dekads where there were no missing values. To find the correlation between the measured and estimated values, the r2 statistic was used; for determining the deviations of the estimated values from the measured values, the MAE statistic was used; and to investigate overestimation or underestimation, the MBE statistic was used. The r2 statistic was first determined by correlating all the daily or dekadal values at each of the weather stations to the estimated values and was determined on a monthly basis (dekadal values grouped by months). The MAE of dekadal estimated values against the measured dekadal values was also determined on a monthly basis. The following are the formulas for MAE and MBE (Jacovides and Kontoyiannis, 1995):

where: N is the number of data pairs and diis the difference between the ith predicted daily/dekadal value and the Ith measured daily/dekadal value.

RESULTS AND DISCUSSION
Sensitivity of the inverse distance weighting exponent
Estimation of rainfall using IDW with exponents starting from 1 to 5 resulted in varying rankings across all the weather stations (Table 3). Rankings for r2 are lower for exponents between 1 and 2.5 while high values are evident for exponents between 3 and 5. This indicates that estimating daily rainfall with the IDW equation assigning extremely high weights to the closest stations results in values that are less correlated to the measured data. The rankings for the MAE are low for exponents between 2 and 3.5 while the other exponents have relatively high rankings. Rankings for the MBE did not show any pattern across all the exponents. The average ranking of the r2, MAE and MBE of the different exponents of the IDW equation and all the weather stations is lowest for both 2 and 2.5, with a value of 4.22 for both exponents. The results are contrary to the findings of Chen and Liu (2012), who obtained highly variable optimal exponents. Lowest value denotes top ranking and best estimator as compared to the observed values. The other high-ranked exponents are 1.5, 1 and 3, with average rankings of 4.56, 4.72 and 4.72, respectively. Sensitivity analysis of the exponent of the IDW equation showed the optimal values as 2 and 2.5, and thus for the remainder of the paper the exponent of 2 will be utilized to determine the accuracy of the IDW method in estimating measured rainfall values at the selected six weather stations in the Free State Province.
Performance of daily estimations against measured values
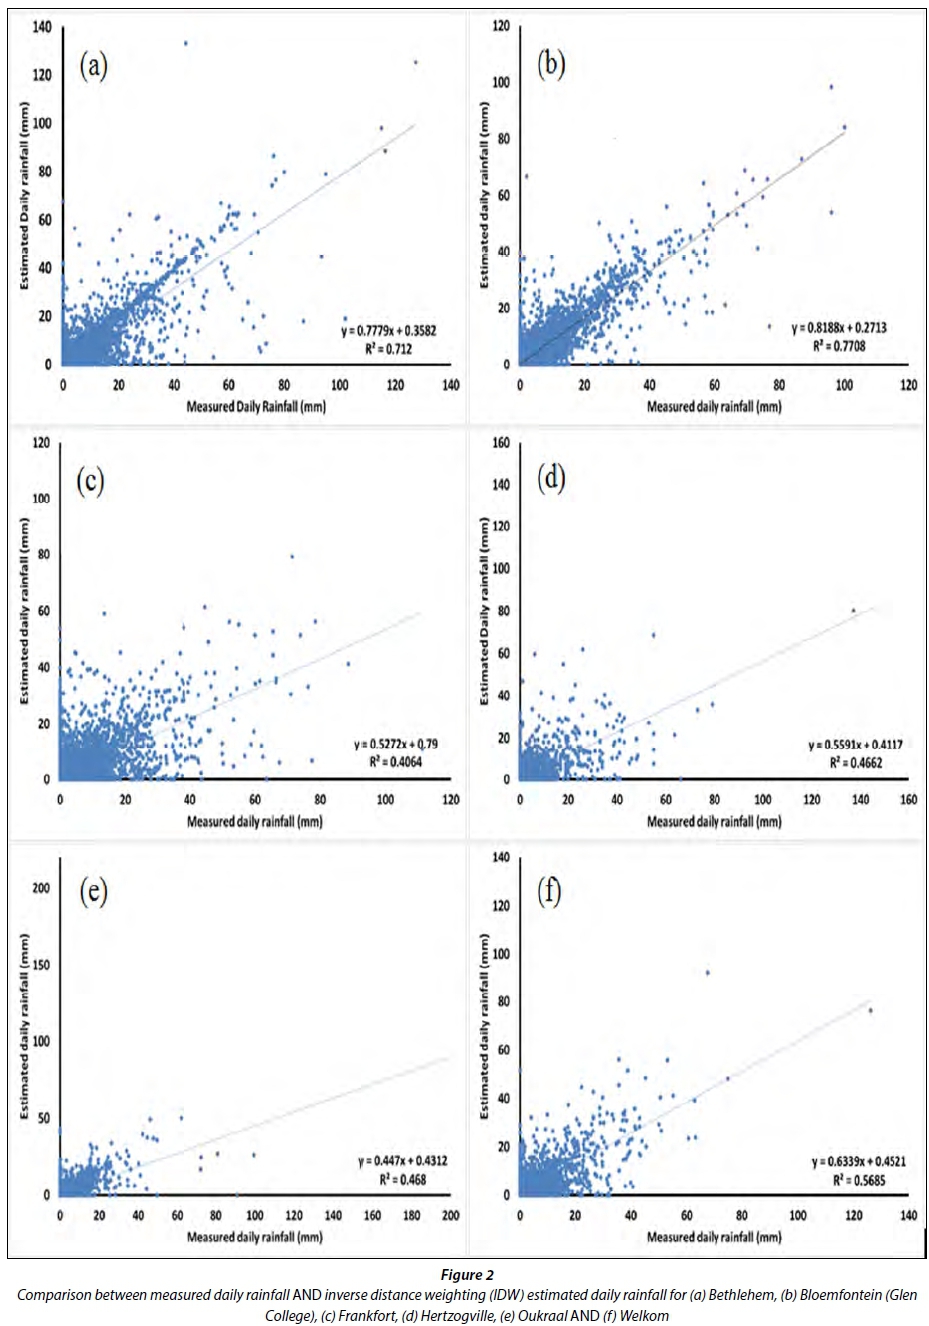
Coefficient of determination (r2) for the comparison of daily measured rainfall and inverse distance weighting estimated values varied from one location to another (Fig. 2). The best correlated estimates were obtained for Bethlehem in the eastern Free State with a r2 value of 0.77, followed by Bloemfontein with 0.71 over the central parts. A moderate r2 of 0.569 was obtained in Welkom corresponding to a correlation coefficient of 0.754. The lowest r2 values were obtained in Frankfort, Hertzogville and Oukraal with 0.406, 0.466 and 0.468 corresponding to correlation coefficients (r) of 0.637, 0.683 and 0.684, respectively. High values of r2 are an indication that the IDW estimates of daily rainfall in the Free State Province resemble the measured daily data. Correlation coefficients (0.63-0.877) obtained in this study are lower than those obtained using IDW in the study by Chen and Liu (2012) in Taiwan where values exceeding 0.9 were attained. The contributing factors to high correlation are mostly the distances of the stations from the target station with stations with low correlation values mostly having relatively distant neighbour stations (Table 2). In contrast, the r2 values obtained from this study are higher than those obtained by Villazón and Willems (2010) in Bolivia.
Mean absolute error (MAE) for estimating all the rainfall values was lower than 1 mm over Bloemfontein, Oukraal and Bethlehem, at 0.70 mm, 0.72 mm and 0.81 mm, respectively (Table 4). Low MAE is an indication that, on average, the magnitude of the estimated values is close to the measured values. MAE values for Welkom and Hertzogville were between 1 and 1.5 mm while the highest MAE of 1.55 mm was attained for Frankfort. In other studies, MAE values of daily rainfall estimates exceeding 2.5 mm were achieved by Villazón and Willems (2010) while Xia et al. (1999) obtained a relatively lower average MAE of 0.75 mm in Germany. Furthermore, Teegavarapu et al. (2009) obtained good performance by the IDW method in estimating daily rainfall with MAE of 0.07 mm in Kentucky, USA.
Highly variable results were obtained when comparing daily rainfall estimates for measured values of less than or equal to 5 mm, between 5 and 10 mm, between 10 and 15 mm, between 15 and 20 mm and exceeding 20 mm (Table 4). MAE for measured rainfall of less than or equal to 5 mm ranged from 0.32 mm in Bloemfontein to 0.81 mm in Frankfort. This is an indication that the IDW method for all the stations estimated low rainfall values well. Measured rainfall in the range of 5 to 10 mm, as compared to estimated values, had MAE of between 2.38 and 5.37 mm with relatively low values at Bethlehem, Bloemfontein and Oukraal. For measured daily values between 10 and 15 mm, MAE ranged from 3.45 to 7.95 mm with an average of 5.69 mm. Measured values of between 15 and 20 mm had the lowest MAE for Bloemfontein and Bethlehem with values not exceeding 5mm, while all the other stations had a relatively higher MAE exceeding 7.5 mm. MAE for measured rainfall exceeding 20 mm was also low for Bloemfontein and Bethlehem with values not exceeding 10 mm, while the highest values of 19.1 mm and 20.1 mm were obtained for Oukraal and Hertzogville, respectively. The results clearly show that the IDW method has a large error in extremely high daily rainfall. This might be caused by the fact that most excessively high rainfall events are obtained from convective clouds which are distinctly localized in most southern African regions (Yakir and Morin, 2011; Blamey and Reason, 2013).
Mean bias error (MBE) for estimated daily rainfall as compared with measured data has a slight negative bias with an average of -0.08 mm (Table 5). All the stations recorded a negative bias of magnitude less than 0.1 mm with the exception of Hertzogville with -0.17 mm. The results differ from findings in a study by Bennett et al. (2007), whereby the IDW method resulted in both negative and positive MBE with magnitude ranging from -0.05 to 0.25. Low bias error is an indication of good performance by the IDW method in estimating daily rainfall. Disaggregated data shows a slight positive bias for measured rainfall of 5 mm or less with an average of 0.32 mm, implying that IDW tends to overestimate daily rainfall for low rainfall values. All the other measured rainfall categories show negative bias indicating underestimation of the IDW method in estimating rainfall exceeding 5 mm. Average biasness is 1.27 mm, 3.68 mm, 4.68 mm and 12.72 mm for 5-10 mm, 10-15 mm, 15-20 mm and greater than 20 mm, respectively. In the upper end of all of the categories, performance of the IDW method at Frankfort, Hertzogville, Oukraal and Welkom is relatively poor as compared to Bethlehem and Bloemfontein.
Performance of dekadal estimations against measured values
The results of the coefficient of determination (r2) for the comparison of the measured dekadal rainfall and the estimated dekadal rainfall for the entire dataset are high at all the stations (Fig. 3). The r2 values range from 0.776 in Frankfort to a high of 0.90 in Bloemfontein (Glen College), with all stations having an r2 exceeding 0.75. This shows that the estimated dekadal rainfall using the IDW method over the Free State results in more than 75% variation in measured dekadal values. The values obtained are higher than that of daily values implying that cumulative rainfall estimates tend to eliminate daily fluctuations resulting in higher correlation. Hence, the IDW method using values from the 2 to 5 nearest stations performs well in estimating actual dekadal rainfall amounts.
Looking specifically at the correlation of this method within different months, one can see a lot of variation in r2 for dekadal estimates from month to month and per station (Table 5). The values are still mostly above 0.70 in all the months for all the stations, indicating a good performance with few exceptions. On average the r2 statistic ranges from 0.71 to 0.88 and in 10 out of 12 months the average exceeded 0.75. Bloemfontein shows consistently high values with all the monthly correlations exceeding 0.80. The monthly r2 values in Bethlehem also exceed 0.75, showing good correlation except in December when the value is below 0.70. In contrast, Frankfort monthly r2 values show a lot of variation between 0.55 and 0.91. The results clearly show that there is a good relationship between estimated and actual rainfall values.
Dekadal MAE values show a lot of spatial and temporal variability over the Free State. Small MAE values were obtained in the winter months due to the low rainfall received, while in the other months the MAE values were relatively large (Table 6). Bethlehem, Bloemfontein and Oukraal show low error with MAE of less than 10 mm/dekad for all of the months. In Frankfort, Hertzogville and Welkom the errors obtained exceed 10 mm/dekad mostly in December to March while in other months there is a relatively low error of less than 10 mm/ dekad. On average the MAE is below 5 mm/dekad.
MBE for dekadal measured rainfall versus dekadal IDW estimated values is mostly negative over all the months and stations denoting a tendency of underestimation (Table 6). The magnitude of underestimation is mostly less than 3 mm per dekad with winter months recording MBE of less than 0.2 mm in absolute terms whereas summer months show values exceeding 1 mm/dekad in magnitude.
The results obtained in evaluating the IDW method's capability for correctly estimating measured rainfall are in line with the findings by Xia et al. (1999), Bennett et al. (2007) and Teegavarapu et al. (2009), which show that IDW estimates rainfall well and is a recommended method of filling in the missing rainfall data. According to these researchers, the method performs best if the density of the stations is high. Similarly, the results also showed relatively lower accuracy at stations like Hertzogville, Oukraal and Frankfort which had distant neighbour stations, as compared to stations like Bethlehem and Bloemfontein where IDW performed very well. Overall, in the Free State there are over 500 rainfall stations with data within the period of 1950 to 2008, which makes it an ideal area for using the IDW method. The only constraint is the varying climate data length and period of recording. Even though IDW is a good estimator of daily rainfall, the number of rainy days increased by 5% to 29% with an average of 17% over the Free State. This is mainly attributed to the localized nature of the rainfall in the region: there are few days of rainfall from stratified clouds which mostly cover a large area, with the rain coming mainly from convective clouds which are generally enhanced by local conditions.
CONCLUSION
The accuracy of the inverse distance weighting (IDW) method of estimating daily and dekadal rainfall in the Free State study area was evaluated using 6 selected stations. The coefficient of determination (r2) for estimated rainfall versus observed rainfall for all the stations shows a good correlation, while mean absolute error (MAE) and mean bias error (MBE) values were low. This is an indication that the IDW method performs well and is thus recommended to fill in the gaps in rainfall data in the Free State Province of South Africa.
ACKNOWLEDGEMENTS
The authors are grateful for funding from the Department of Agriculture, Forestry and Fisheries (Project number: 000544). Authors are thankful to the reviewers for their constructive comments which tremendously enriched the manuscript.
REFERENCES
ARAYA A and STROOSNIJDER L (2011) Assessing drought risk and irrigation needs in northern Ethiopia. Agric. For. Meteorol. 151 425-436. http://dx.doi.org/10.1016/j.agrformet.2010.11.014 [ Links ]
BENNETT ND, NEWHAM LTH, CROKE BFW and JAKEMAN AJ (2007) Patching and disaccumulation of rainfall data for hydrological modelling. In: Oxley L and Kulasiri D (eds) Proceedings of the International Congress on Modelling AND Simulation MODSIM2007. Modelling and Simulation Society of Australia and New Zealand Inc. (MSSANZ), Christchurch. 1526-1532. [ Links ]
BLAMEY RC and REASON CJC (2013) The role of mesoscale convective complexes in Southern Africa summer rainfall. J. Clim. 26 1654-1668. http://dx.doi.org/10.1175/JCLI-D-12-00239.1 [ Links ]
CHEN F and LIU C (2012) Estimation of the spatial rainfall distribution using inverse distance weighting (IDW) in the middle of Taiwan. Paddy Water Environ. 10 209-222. http://dx.doi.org/10.1007/s10333-012-0319-1 [ Links ]
COLLINS FC and BOLSTAD PV (1996) Comparison of spatial interpolation techniques in temperature estimation. In: Proceedings of the Third International Conference/Workshop on Integrating GIS AND Environmental Modeling, 21-25 January 1996, Santa Fe, New Mexico. [ Links ]
DE SILVA R, DAYAWANSA N and RATNASIRI M (2007) A comparison of methods used in estimating missing rainfall data. J. Agric. Sci. 3101-108. [ Links ]
ELSHORBAGY AA, PANU US and SIMONOVIC SP (2000) Group-based estimation of missing hydrological data: I. Approach and general methodology. Hydrol. Sci. J. 45 (6) 849-866. http://dx.doi.org/10.1080/02626660009492388 [ Links ]
GYAU-B OAKYE P and SCHULTZ GA (1994) Filling gaps in runoff time series in West Africa. Hydrol. Sci. J. 39 (6) 621-636. http://dx.doi.org/10.1080/02626669409492784 [ Links ]
JACOVIDES CP and KONTOYIANNIS H (1995) Statistical procedures for evaluation of evapotranspiration computing models. Agric. Water Manage. 27 365-371. http://dx.doi.org/10.1016/0378-3774(95)01152-9 [ Links ]
JEFFREY SJ, CARTER JO, MOODIE KB and BESWICK AR (2001) Using spatial interpolation to construct a comprehensive archive of Australia climate data. Environ. Model. Softw. 16 309-330. http://dx.doi.org/10.1016/S1364-8152(01)00008-1 [ Links ]
KIM T and AHN H (2009) Spatial rainfall model using a pattern classifier for estimating missing daily rainfall data. Stoch. Environ. Res. Risk Assess. 23 367-376. http://dx.doi.org/10.1007/s00477-008-0223-9 [ Links ]
LI L and REVESZ P (2004) Interpolation methods for spatio-temporal geographic data. J. Comput. Environ. Urban Syst. 28 (3) 201-227. http://dx.doi.org/10.1016/S0198-9715(03)00018-8 [ Links ]
LONGLEY PA, GOODCHILD MF, MAGUIRE DJ and RHIND DW (2001) Geographic Information Systems and Science. Wiley, New York. [ Links ]
MAKHUVHA T, PEGRAM G, SPARKS R and ZUCCHINI W (1997) Patching rainfall data using regression methods: 1. Best subset selection, EM and pseudo-EM methods: Theory. J. Hydrol. 198 (1-4) 289-307. http://dx.doi.org/10.1016/s0022-1694(96)03285-4 [ Links ]
MOELETSI ME and WALKER S (2012) Assessment of agricultural drought using a simple water balance model in the Free State Province of South Africa. Theor. Appl. Climatol. 108 425-450. http://dx.doi.org/10.1007/s00704-011-0540-7 [ Links ]
OLUOCH K., MARWAN N, TRAUTH M and KURTH J (2013) Evolving complex networks analysis of space-time multi-scale wave like fields: application to African rainfall dynamics. Geophys. Res. Abstr. 15 EGU2013-13237. [ Links ]
SMITHERS JC and SCHULZE RE (2000) Long duration design rainfall estimates for South Africa. WRC Report No. 811/1/00, Water Research Commission, Pretoria. [ Links ]
TANG WY, KASSIM AHM and ABUBAKAR SH (1996) Comparative studies of various missing data treatment methods - Malaysian experience. Atmos. Res. 42 (1-4) 247-262. http://dx.doi.org/10.1016/0169-8095(95)00067-4 [ Links ]
TEEGAVARAPU RSV, TUFAIL M and ORMSBEE L (2009) Optimal functional forms for estimation of missing precipitation data. J. Hydrol. 374 106-115. http://dx.doi.org/10.1016/j.jhydrol.2009.06.014 [ Links ]
VILLAZÓN MF and WILLEMS P (2010) Filling gaps and daily disac cumulation of precipitation data for rainfall-runoff model. BALWOIS 2010, 25-29 May 2010, Ohrid, Republic of Macedonia. [ Links ]
XIA Y, FABIAN P, WINTERHALTER M and STOHL A (1999) Forest climatology: estimation of missing values for Bavaria, Germany. Agric. For. Meteorol. 96 131-144. http://dx.doi.org/10.1016/s0168-1923(99)00056-8 [ Links ]
XIA Y, FABIAN P, WINTERHALTER M and ZHAO M (2001) Forest climatology: estimation and use of daily climatological data for Bavaria, Germany. Agric. For. Meteorol. 106 (2) 87-103. http://dx.doi.org/10.1016/S0168-1923(00)00210-0 [ Links ]
YAKIR H and MORIN E (2011) Hydrologic response of a semi-arid watershed to spatial and temporal characteristics of convective rain cells. Hydrol. Earth Syst. Sci. 15 393-404. http://dx.doi.org/10.5194/hess-15-393-2011 [ Links ]
Received 16 July 2014
Accepted in revised form 3 June 2016
* To whom all correspondence should be addressed. +27 12 310 2537 / e-mail: nmoeletsim@arc.agric.za /mmoeletsi@hotmail.com

