Services on Demand
Article
Indicators
Related links
-
 Cited by Google
 -
 Similars in Google
Share
Water SA
On-line version ISSN 1816-7950
Print version ISSN 0378-4738
Water SA vol.42 n.3 Pretoria Jul. 2016
http://dx.doi.org/10.4314/wsa.v42i3.10
ORIGINAL ARTICLES
Monetary value of the impacts of filamentous green algae on commercial agriculture: Results from two geographically different case studies
WJ de LangeI, *; A-M BothaII; PJ OberholsterI, III
ICouncil for Scientific and Industrial Research, Stellenbosch, South Africa
IIGenetics Department, Agricultural Sciences Faculty, Stellenbosch University, Stellenbosch, South Africa
IIIBotany and Zoology Department, Science Faculty, Stellenbosch University, Stellenbosch, South Africa
ABSTRACT
This paper presents estimates of the monetary value of the impact of eutrophication (algae) on commercial agriculture in two different catchments in South Africa. A production function approach is applied to estimate the monetary value of the impact of filamentous green algae on commercial agriculture in the Dwars River, Western Cape and the Loskop irrigation area, Groblersdal, in South Africa. The main emphasis was on the impacts of algal growth on farm profitability, which relied on detailed information on the impact, and the extent of the impact, of algae on farming practice. The paper presents the study areas, methodological approach, surveyed pollution impacts and the calculated monetary value of the impacts of such pollution. A short conclusion discusses some potential applications of the results. Initial results point towards a value of R1 887 per hectare per year for the Dwars River area and R2 890 per hectare per year for the Loskop irrigation area. The information can not only be used to compare different eutrophication mitigation strategies within the study areas and, to a lesser extent, similar areas outside these areas, but can also inform a process focusing on assessing the market potential for tradable pollution permits as a mitigation practice to manage water pollution in both catchments.
Keywords: water quality, filamentous algae, economic impact, farming
INTRODUCTION and OBJECTIVE
Sustainable river basin utilisation and management requires information on the economic and ecological consequences of basin policies and managerial strategies. South African policymakers have a much wider variety of environmental protection tools at their disposal than they did 20 years ago, when so-called command-and-control mechanisms to regulate behaviour were the preferred approach. Although these approaches were effective in some areas, they proved to be costly and difficult to enforce for water pollution because of the high level of monitoring required by these methods. Market-based mechanisms have been put forward as potential alternatives to command-and-control mechanisms. These alternative mechanisms could take the form of subsidy reforms, taxes to account for social costs, or the establishment of new markets in which pollution permits can be traded. The latter is of particular interest for this study as it aims to limit pollution at an optimal cost to the polluter. This mechanism facilitates trade in the right to pollute within a predetermined safe pollution standard. Tradable pollution permits create an incentive for companies to reduce pollution relative to their entitlement, since it becomes possible to sell the difference to willing buyers (i.e. a firm who cannot meet their pollution targets). Such trading can lower the cost of compliance and realise pollution prevention benefits. This market-based system capitalizes on the power of the marketplace to reduce pollution cost-effectively and uses economic incentives to promote conservation and the development of innovative solutions to account for an externality such as pollution.
This paper presents the results of an estimate of the monetary value of the impact of nutrient enrichment (filamentous green algae) impacts on commercial agriculture in the Dwars River, Western Cape (De Lange, 2014) and the Loskop irrigation area, Groblersdal (De Lange, 2015), in South Africa. It complements previous work on salinization and bacterial pollution in the same area (see De Lange et al., 2012) and contributes towards having more inclusive decision-making information for setting up the first water pollution permit trading scheme in South Africa. The paper presents the study areas, discusses the methodological approach, reports the surveyed pollution impacts and presents the calculated monetary value of the impacts of such pollution. It concludes with a short interpretation of the results and discusses the potential applications of the results.
APPROACH
A production function approach (Birol et al., 2006; Brouwer and Pearce, 2005; Glazyrina et al., 2006; Pearce, 1994; Pearce, 1993) was applied to estimate the monetary value of the impact of algae on commercial agriculture. The main emphasis was on the impacts of algal growth on farm profitability, which relied on detailed information on the impact(s) and the extent of the impact(s) of algae on farming practice. The input data for the calculations were obtained from interviews with prominent farmers in the study areas and the operations and general managers of both water user associations. The basic valuation procedure followed these steps:
• Representative crop selection and construction of a typical farm profile for each representative crop
• Description and quantification of the impacts of algae on the cultivation practice of representative crops
• Valuation of the impact of algae
• Aggregation and extrapolation to the level of the water user association
Representative crops were selected in terms of hectares under irrigation in each study area. Some of the prominent farmers of the representative crops were interviewed and asked to explain the impacts of algae on their business, focusing specifically on the impacts of algae on the cultivation practice. It is assumed that algae are always present in the water and that a difference in concentration levels is considered the distinguishing factor determining the mitigation strategy and hence cost implications and consequent profitability impacts. Therefore, farmers were asked to try to distinguish between a 'heavy' and a 'normal' algal load scenario.
The cost implications of the impacts of filamentous green algae were determined by systematically accounting for the cost variables involved in mitigating (i.e. managing) the impacts of algae. This process was done in close collaboration with the farmers because mitigation strategies for algae differ between farms. This variance led to the need to derive a representative cost for a particular pollution mitigation strategy in order to represent the cost of algae across farms. Consequently, the cost impacts were structured according to the crop enterprise budget for each representative crop. These budgets present the cost structure for standard cultivation practices of crops and draw from industry data for each study area. For the Loskop area, data were obtained from Grain SA, the citrus growers association and NULANDIS, while industry cost data were obtained for the Dwars River area from Hortgro, SAWIS, VINPRO, NULANDIS and KaapAgri. It was assumed that the standard crop enterprise budget already accounts for 'normal' filamentous green algae load pollution impacts and that the latter could be used as a 'base case' scenario to compare against a 'heavy' pollution load scenario.
The steps in the algae mitigation process were described, while noting the cost implications. These costs were systematically captured in a spreadsheet in order to calculate the total direct cost of the on-farm mitigation pollution process. The total cost of each pollution mitigation strategy is presented on a hectare level and as a percentage of the pre-harvest production cost.
Study areas and representative crops
The Dwars River is a major tributary of the Berg River, with its confluence on the ARC's BienDonne farm about halfway between Franschhoek and Paarl. The source of the Dwars River is in the Banghoek valley which lies between the northern side of the Jonkershoek valley and the Drakenstein Mountain range. This is an area with very high rainfall on the peaks (>3 000 mm-yr-1) but with very steep rainfall gradients. The Dwars River is about 10% of the surface area of G10C quaternary catchment, yet it yields about 23 m. m3-yr-1 or 24% of mean annual runoff of the quaternary catchment. The average rainfall is 877 mm-yr-1.
Commercial agriculture in the Dwars River focuses (in terms of hectares) on deciduous fruit and viticulture. Table 1 presents a breakdown of the hectares under cultivation of the main deciduous fruit groups and vines. While the table is not inclusive, it is representative of the major fruit groups (70% of all deciduous fruit and 52% of the vines).
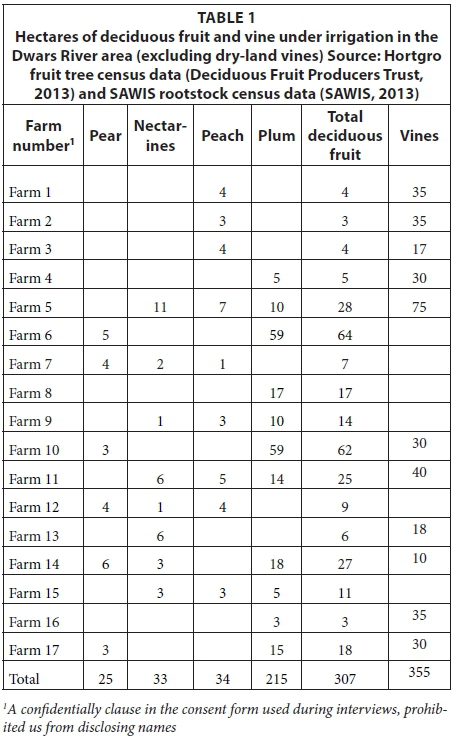
Plums were taken as the representative deciduous fruit crop since they represent 70% of the hectares under deciduous fruit in the study area. There are also approximately 355 ha of irrigated wine grapes in the study area.
The Loskop irrigation area falls within drainage region B3H017 and thus forms part of the Olifants WMA (Fig. 2).
The bulk supply infrastructure servicing the irrigation scheme consists of the Loskop Dam, 7 balancing dams, 135 km of concrete-lined main canal and 345 km of service canals (Pretorius, 2015). The scheme serves 25 410 hectares under irrigation from 16 136 enlisted hectares. The water is managed via a demand-based approach and is supplied via 660 calibrated and registered sluice-gates delivering 197 890 m3 per take-off per year. This represents an allocation of approximately 7 700 m3-ha-1-yr-1 which is charged at R3 500-ha-1-yr-1. Demand scheduling is operated via 8 wards and water users need to request their water from ward managers a week in advance. The scheme is currently fully allocated, with deficit irrigation fast becoming the norm. The main perennial commercial crops under irrigation are presented in Table 2.
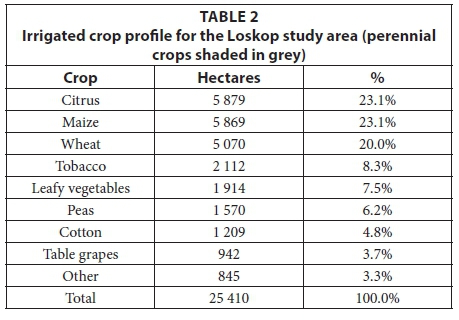
Citrus was taken as the representative perennial crop, while maize represented summer cash-crops and wheat the winter cash-crops. These represented 66% of the total area under irrigation in the study area.
Surveyed pollution impacts
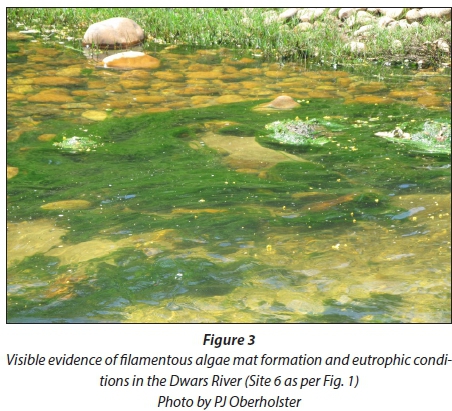
Filamentous green algae thrive under eutrophic conditions due to nutrient enrichment from raw or partially-treated sewage, agricultural effluent and other forms of pollution (Oberholster et al., 2011; Oberholster et al., 2013). Although these kind of algae pose no direct threat to crops, they affect the operational efficiency of irrigation systems and therefore the operation and maintenance costs of irrigation infrastructure.
The surveyed impacts on farmers in the Dwars River were only felt when they irrigated, which implies that survey results are only representative for the irrigation season, extending from the third week of October until the second week of March. Thus, it should be noted that although pollution loads could vary during the year the impacts will only affect farmers during the irrigation season. Most farmers mentioned filamentous green algae -related problems, and were aware of the direct relationship between bio-available phosphate and algae. Farmers were of the opinion that filamentous green algae are a pollution-related impact, affecting their farm profitability directly via increased irrigation costs.
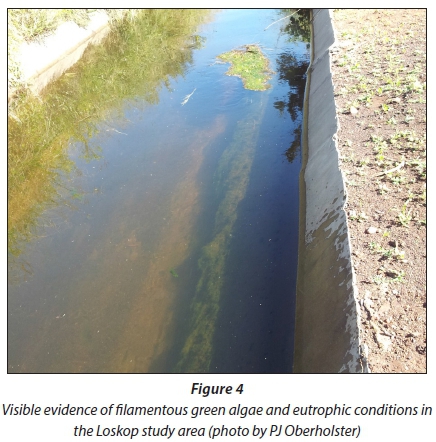
Surveyed impacts within the Loskop area started with high (benthic chlorophyll 30-121 mg-m2) filamentous green algae loads decreasing the volume and flow tempo of the main canal to such an extent that the canal could not serve the weekly demand. Filamentous green algae are controlled chemically by means of dosage with copper sulphate or similar chemicals. Algal mat formation does not occur uniformly throughout the canal and ward managers therefore need to monitor their respective canal section (typically 5 to 8 km) on a regular basis and dose the canal as and when needed. Each dosage affects approximately 5-6 km of canal and it is rarely the case that the whole canal is dosed at the same time. Copper sulphate dosage is however a sensitive issue since it is absorbed by plants and could have health effects on humans and ecosystems; dosage levels are therefore important.
Once the water passes the sluice-gate at the take-off point, the algae becomes the farmer's responsibility. Here algae not only obstructs and clogs strainers, intake valves and manifolds, but also places a higher load on impellers and bearings of pumps, while decreasing the delivery rates leading to a decrease in the volume per pump-hour. Micro-jets and dripper lines are also clogged which leads to uneven and thus suboptimal moisture management in orchards and could affect crop yield if not mitigated. Farmers were acutely aware of the problem and that it affects their profitability via an increase in the operational and maintenance costs (increase in the mechanical and chemical cleaning of the system) to maintain the operational efficiency of irrigation systems. Such cleaning included a more frequent dosage of on-farm balancing dams with copper sulphate, more frequent cleaning of foot valves, intake manifolds, filter-banks, and the nozzles of micro-jets, centre pivots and drippers. Hydrogen peroxide is often used to clean the centre pivot systems, although some farmers argued that peroxide decreases the service life of all plastic components since they becomes brittle.
The cost of eutrophication
The surveyed pollution impacts have indicated that the standard practice to manage the impacts of filamentous green algae is more frequent cleaning of the complete irrigation system. The latter provided the basis for a cost estimate on the impact of algae. However, any irrigation system requires a minimal amount of cleaning and flushing prior to the irrigation season, and the challenge here was to differentiate between costs related to standard practice and costs related to high algae loads. It was consequently decided to distinguish between a 'high' and 'low' filamentous green algae load scenario in order to differentiate the cost. The cost structure for 'low' algae loads were taken as the point of departure to systematically account for the difference in operating and maintenance costs between such and a 'high' load scenario.
Cost of eutrophication in the Dwars River
Farmers were asked to systematically describe the steps taken in their standard protocol for dealing with algae within a typical pump station on their farm. This allowed a differentiation between a 'high' and 'low' load scenario and for the identification of the cost differences between the two scenarios. However, as farmers neither quantify nor keep a record of the volumes of filamentous green algae removed, the exact definition of 'high' remains subjective. The following input variables were used (Table 6 and Table 7 present additional input variables):
• The irrigation season lasts 20 weeks (i.e. 120 days)
• Farm labour cost is R15 per hour
• A typical pump station serving 10 ha consists of a strainer, foot valve, 3.3 kilowatt pump, Conn 80 sand filter and an Arkal disc filter
• Electricity cost is R1.20 per kWh
The service cost of a pump averaged R9 000, which implies that the annual service cost for a pump under low load conditions is approximately R3 000 per year, and R4 500 per year under high load conditions, i.e., a R1 500 per year difference. Filter sand costs R1 875 per filter, which implies an annual cost of R625 for low and R1 875 for high load conditions, i.e., R1 250 per year difference. Table 5 represents the labour cost per activity.
Given an estimated 307 ha of deciduous fruit in the study area, and assuming that all farmers struggle with algae, it was inferred that the above-mentioned R1 887-ha-1-yr-1 (see Table 5) translates to R579 591-yr-1 for deciduous fruit in the study area. Given that the pre-harvest production cost for plums is R61 880-ha-1 (Deciduous Fruit Producers Trust, 2013), the cost of algal pollution represents approximately 3.1% of pre-harvest costs.
Although vines employ drip irrigation while deciduous fruit uses micro-jets, the labour component for cleaning these two types of irrigation systems is essentially the same. Consequently, the mitigation strategy and cost per hectare for managing algae is comparable. Given an estimated 355 ha under vines in the study area, the cost of algae for the wine grapes is estimated at R670 400-yr-1 (assuming comparability in terms of the algae problem across farmers). Pre-harvest production cost for wine grapes is R35 739-ha-1 (Van Niekerk, 2013), which implies that the algae problem represents 5.2% of the pre-harvest cost.
It could thus be argued that the algae problem costs the vine and deciduous fruit industry approximately R1.2 m. per year in the Dwars River.
Cost of eutrophication in the Loskop area
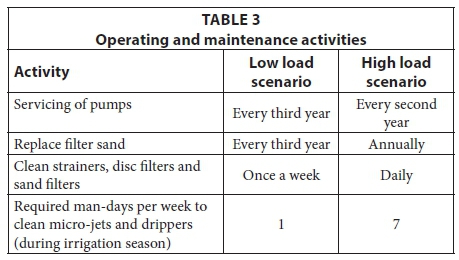
Farmers were again asked to describe the way in which they deal with filamentous green algae within a typical pump station on their farm. They were asked to try to distinguish between a 'high' and 'low' load scenario which enabled the identification of the cost differences between these two situations. Table 6 summarises the stated differences between a 'low' and 'high' load scenario as stated by the respondents. Once again the exact quantity of algae removed is unknown.
The following input variables were identified and consequently used in the calculations:
• R1 600 per 25 kg bag copper sulphate
• R30 per litre for a 30% hydrogen peroxide solution
• The capital outlay for an automated peroxide dosage system capable of dosing 10 L of hydrogen peroxide per week is R76 000
• Farm labour at R150 per 8 h work day
• A typical pump station serving 22 ha consists of a strainer, foot valve, 24 kW pump, Conn 80 sand filter and two disc filters
• Electricity costs R1.20 per kWh
• 9 autoflush cycles per day of 30 s each
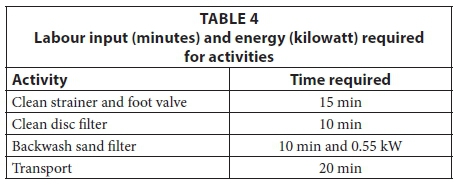
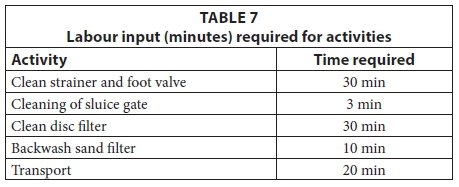
Table 7 summarises the additional labour input required to complete the required maintenance on a typical irrigation pump station as presented in Table 6.
An average of 8 kg copper sulphate is dosed per hectare per year representing a cost of R523- ha-1-yr-1. The capital outlay for an automated hydrogen peroxide dosage station worked out at R304-ha-1-yr-1 (assuming a 20 yr repayment period at a 5% interest rate). Hydrogen peroxide itself added R390-ha-1-yr-1. Additional irrigation system upgrades (i.e. increased nozzle sizing, larger diameter sub-mains) to accommodate higher algal loads added R183-ha-1-yr-1. The additional labour cost component to check and clean faulty drippers and blocked nozzles under a high load scenario was estimated at R890-ha-1-yr-1. The additional electricity cost for flushing filters was R97.06-ha-1-yr-1. Additional labour for cleaning filters of pump stations was estimated at R107-ha-1-yr-1, sluice gates R1.98-ha-1-yr-1 and footvalves R10.95-ha-1-yr-1. Replacement cost of faulty dripper and micro-jets was R41.18-ha-1-yr-1. Additional labour for cleaning balancing dams was R41.18. The direct dosage cost for the Loskop Irrigation Board (excluding the labour component) was R5.43-ha-1-yr-1. Table 8 summarises the additional input costs required for high algae loads.
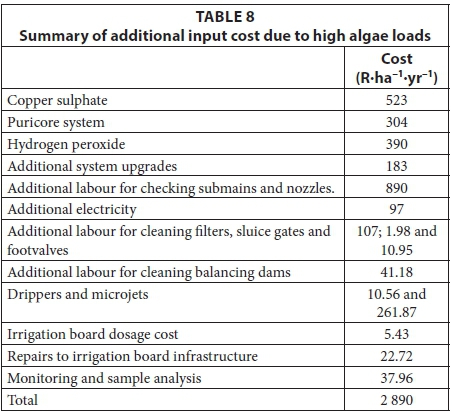
The estimated total direct costs of algae are estimated at R2 890-ha-1-yr-1. Approximately 16 818 ha (or 66% of the total area being served by the scheme) is cultivated under the selected representative crops for this area and represents a total annual cost of R48.6 m. If it is assumed that the representative crops accurately reflect the mitigation practice for all other irrigated crops in the area, the figure increases to R73.4 m.-yr-1. If it is assumed that the costs of algae will be recovered from the enlisted hectares only, the value is approximately R46.2 m.
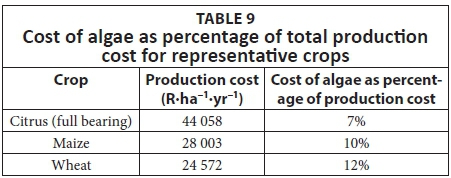
Table 9 presents the cost of filamentous green algae as percentage of the total production cost of the three representative crops chosen for this study.
The costs could also be presented in terms of the volume of water supplied by the Loskop Irrigation Board. Given that the scheme serves an estimated 130 607 400 m3 per year and that almost all irrigation water originates from the scheme, it could be argued that the cost of algae is approximately R0.56-m-3 water supplied. Given 660 take-offs and 530 farmers, the cost is estimated at R111 k per take-off and R138 k per farmer per year. It is interesting to note that the dosage cost represents 44% of the total cost of algae (i.e. R1 285-ha-1-yr-1) and that only R26.51 of the R2 850-ha-1-yr-1 is carried by the irrigation board.
DISCUSSION
This study estimated the monetary value of filamentous algae-related impacts on commercial agriculture in two geographically different areas. The information generated in this study creates an overarching 'management budget' for filamentous green algae in the study areas. Firstly, any overarching algae management strategy will be considered worthwhile from a financial perspective if the cost to mitigate the algae impacts are less than R1.3 m.-yr-1 in the Dwars River or less than R46.2 m.-yr-1 for the Loskop scheme). Secondly, the results also generate valuable information for the market-making process for tradable water pollution permits as a mitigation practice for filamentous green algae.
Further work is currently under way to present the results in terms of Rands per milligram per square meter of ben-thic chlorophyll, which is critical to define a tradable permit. Furthermore, the maximum 'safe' algae load for each river system also needs to be determined and compared with current loads. Research considering a detailed verification process and detailed specification of the terms and conditions underlying water pollution permit trading schemes is also underway. This information will feed into a pilot-scale demonstrator to illustrate and verify the functionality of a tradeable permit system for water pollution in both study areas.
ACKNOWLEDGEMENTS
This work was jointly funded by the Loskop Irrigation Board, a Stellenbosch University NRF grant and CSIR parliamentary grant funding. The authors would also like to thank the representatives from the following organisations for valuable data inputs:
• Grain South Africa
• Citrus Growers Association
• NULANDIS
• HORTGRO
• SAWIS
• VINPRO
• KaapAgri
REFERENCES
BIROL E, KAROUSAKIS K and KOUNDOURI P (2006) Using economic valuation techniques to inform water resources management: A survey and critical appraisal of available techniques and an application. Sci. Total Environ. 365 105-122. http://dx.doi.org/10.1016/j.scitotenv.2006.02.032 [ Links ]
BROUWER R and PEARCE DW (2005) Cost-Benefit Analysis and Water Resources Management. Edward Elgar, Cheltenham. http://dx.doi.org/10.4337/9781845426705 [ Links ]
DECIDUOUS FRUIT PRODUCERS TRUST (2013) Annual key deciduous fruit statistics. Compiled by the Deciduous Fruit Producers Trust (DFPT) and Optimal Agricultural Business Systems (OABS) for the South African Apple and Pear Producers' Association; Dried Fruit Technical Services; South African Stone Fruit Producers Association and the South African Table Grapes Producers' Association. DFPT, Paarl, South Africa. [ Links ]
DE LANGE WJ (2014) The monetary value of the impact of selected pollutants on commercial agriculture in the Dwars River. CSIR Report No. CSIR/NRE/GES/IR/2014/0075/A. CSIR, Pretoria. [ Links ]
DE LANGE WJ (2015) The production cost impact of algae on commercial irrigation in the Loskop Irrigation Board service area, Groblersdal. CSIR Report No. CSIR/NRE/GES/ER/2015/0014/A. CSIR, Pretoria. [ Links ]
DE LANGE WJ, MAHUMANI BK, STEYN M and OELOFSE SHH (2012) Monetary valuation of salinity impacts and microbial pollution in the Olifants WMA, South Africa. Water SA 38 241-248. http://dx.doi.org/10.4314/wsa.v38i2.9 [ Links ]
DEPARTMENT OF WATER AFFAIRS AND FORESTRY (2004) Olifants Water Management Area: Internal strategic perspective. Prepared by GMKS, Tlou and Matji and WMB. DWAF, Pretoria. [ Links ]
GLAZYRINA I, GLAZYRIN V and VINNICHENKO S (2006) The polluter pays principle and potential conflicts in society. Ecol. Econ. 59 324-330. http://dx.doi.org/10.1016/j.ecolecon.2005.10.020 [ Links ]
GOODSTEIN ES (2008) Economics and the Environment. John Wiley & Sons, Lewis & Clark, Portland, Oregon, USA. [ Links ]
NULANDIS (2014) Product information and crop guideline catalogue. Nulandis, Stellenbosch. [ Links ]
OBERHOLSTER PJ and BOTHA AM (2011) Dynamics of phytoplankton and phytobenthos in Lake Loskop (South Africa) and downstream irrigation canals. Fund. Appl. Limnol. 179 (3) 169-178. http://dx.doi.org/10.1127/1863-9135/2011/0179-0169 [ Links ]
OBERHOLSTER PJ, DABROWSKI J and BOTHA AM (2013) Using modified multiple phosphorus sensitivity indices for mitigation and management of phosphorus loads on a catchment level. Fund. Appl. Limnol. 182 (1) 1-16. [ Links ]
PEARCE DW (1993) Economic Values and the Environment. The MIT Press, Cambridge, Massachusetts. [ Links ]
PEARCE DW (1994) Valuing the environment: Past practice, future prospect. Centre for Social and Economic Research on the Global Environment University College London and University of East Anglia, London. [ Links ]
PRETORIUS P (2015) Personal communication, 20 April 2015. P Pretorius, operations manager, Loskop Irrigation Board, Groblersdal. [ Links ]
SAWIS (2013) South African Wine Industry Statistics. South African Wine Industry Information and Systems, Paarl. [ Links ]
SMITH C (2014) Personal communication, 10 October 2015. C Smith, Stone Fruit Breeding And Evaluation, Agricultural Research Council, Stellenbosch. [ Links ]
VAN NIEKERK P (2013) Industry statistics: Production cost for wine grapes. Agricultural Economics Division, VINPRO, Paarl. [ Links ]
Received 3 September 2015
Accepted in revised form 3 June 2016
* To whom all correspondence should be addressed. e-mail: wdelange@csir.co.za


