


Services on Demand
Article
 English (pdf)
 Article in xml format
 Article references
Indicators

Related links
-
 Cited by Google
 -
 Similars in Google
Share

 Permalink
Water SA
On-line version ISSN 1816-7950
Print version ISSN 0378-4738
Water SA vol.42 n.3 Pretoria Jul. 2016
http://dx.doi.org/10.4314/wsa.v42i3.06
ORIGINAL ARTICLES
Occurrence of cyanobacteria genera in the Vaal Dam: Implications for potable water production
Annatoria ChinyamaI, *; George M. OchiengII; Jacques SnymanI; Innocent NhapiIII
IDepartment of Civil Engineering, Tshwane University of Technology, Private Bag X680 Pretoria 0001 South Africa
IIDepartment of Civil Engineering and Building, Vaal University of Technology, Private Bag X021, Vanderbijlpark, 1911 Andries Potgieter Blvd, South Africa
IIIDepartment of Environmental Engineering, Chinhoyi University of Technology, Private Bag 7724, Chinhoyi, Zimbabwe
ABSTRACT
The occurrence of cyanobacteria genera in the Vaal Dam was analysed and the factors that influence its dominance in the particular reservoir were also investigated. The study was motivated by the effects of the secondary metabolites of cyanobacteria genera on potable water production. Cyanobacteria genera have been found to be potentially toxic and capable of producing taste and odour secondary metabolites such as geosmin. Historical data from the Department of Water and Sanitation on percentage composition of cyanobacteria genera in the Vaal Dam, were collected for the 2006, 2007, 2011 and 2012 years. The concentrations of NO2-N and NO3-N and total phosphorus as well as water temperature data were collected from the same sampling point for the study period. This data, together with weather data, was statistically analysed for trends and relatedness between variables. It was found that Microcystis and Anabaena were the dominant cyanobacteria genera in Vaal Dam and they were jointly dominant over other phytoplankton genera during February and March. It was also found that the dominance of cyanobacteria genera significantly correlated with air and water temperature and concentration of NO2-N and NO3-N. It was concluded that the dominance of Microcystis and Anabaena genera among the cyanobacteria genera has significant implications for potable water production as the genera are associated with taste and odour metabolites and toxins. It was recommended that depth profiling be employed in order to identify an abstraction depth in the multilevel intake of the reservoir with relatively low levels of cyanobacteria cells. This would assist in minimising taste and odour events in potable water production.
Keywords: Anabaena, cyanobacteria dominance, environmental conditions, Microcystis, Vaal Dam, water treatment.
INTRODUCTION
The presence of cyanobacteria genera in raw water abstracted for potable water production has been found to increase the cost of treating that water and to impact on the quality of water produced (Wnorowski, 1992; Roux et al., 2010; Hoko and Makado, 2011). Wnorowski (1992) found that all impoundments studied in South Africa (from 1990 to 1991) that were experiencing odour problems had a dominant presence of cyanobacteria genera and odour-free impoundments were dominated by diatom genera. The Vaal Dam was among the impoundments experiencing odour problems at the time of the study (Wnorowski, 1992). Cyanobacteria genera have also been found to be potentially toxic to animal and human health (Harding and Paxton, 2001). Potentially toxic cyanobacteria genera which have been found in South African impoundments in previous studies are Anabaena, Cylindrospermopsis, Lyngbya, Microcystis and Oscillatoria (Harding and Paxton, 2001; Downing and Van Ginkel, 2004).
The percentage population of the different genera of phy-toplankton found in water supply reservoirs will differ from reservoir to reservoir as well as from time to time because of the variability of environmental conditions in the reservoirs (Mhlanga et al., 2006; Mhlanga, 2008; Von Sperling et al., 2008; Davis et al., 2009; Paerl and Paul, 2012). The dominant phyto-plankton genera usually found in eutrophic and hyper eutrophic freshwater are from the cyanobacterial group, especially in temperate climates such as South Africa (Rae et al., 1999; Oberholster and Ashton, 2008). In other parts of Southern Africa, studies have confirmed that the most abundant phy-toplankton group is the cyanobacteria, for example, in Lake Chivero, Zimbabwe (Mhlanga, 2008; Hoko and Makado, 2011). According to Ho et al. (2012) as well as Paerl and Paul (2012), 'cyanobacteria have evolved to adapt to almost every environment' on earth; hence their widespread occurrence in water bodies all over the world.
Factors affecting the dominance of cyanobacteria in water supply reservoirs
Studies, for example, by Mhlanga (2008) and Paerl and Paul (2012) among others, have revealed a number of factors that can explain the dominance of cyanobacteria in water supply reservoirs. Factors such as occurrence at different depths of the water column relate to the physiological nature of the cyanobacteria and factors such as growth relate to the environmental conditions in the reservoir.
The physiological nature of cyanobacteria gives them certain advantages over other phytoplankton genera, enabling them to adapt to different environmental conditions in the reservoir and hence maintain dominance. Cyanobacteria have the ability to move up and down the water column for light and nutrients, thereby out-numbering other immotile genera during nutrient and light deficiency periods (Du Preez and Van Baalen, 2006). This is due to their gas vesicles that enable them to be buoyant and regulate their position in the water column. This ability, however, is only effective when the water column is stable and there is no mixing of the water (Mhlanga, 2008; Westrick et al., 2010). Once established, high prevalence of populations can be promoted by effective utilisation of these physiological advantages in conducive environments.
Conducive environmental conditions can promote the growth and dominance of cyanobacteria in freshwater bodies (WHO, 1999). Growth of phytoplankton genera, in general, is limited by several environment factors, such as light, temperature, and nutrients. The dynamics and dominance of phytoplankton genera at any one time depend on the physical and chemical environment of the water column (Abd El-Monem, 2008; Paerl and Paul, 2012). The most investigated environmental conditions that favour the dominance of cyanobacteria in freshwater reservoirs are shown in Table 1.

The effects of water temperature on cyanobacteria growth are very well supported by studies such as Davis et al. (2009) and Tian et al. (2012), among others. Paerl and Paul (2012) suggest that an increase in global temperatures will promote more dominance of cyanobacteria in the future. This implies that higher water temperatures caused by continued global warming could lead to excessive cyanobacteria blooms and greater concentrations of its secondary metabolites (taste and odour compounds and toxins).
The effects of a low (total nitrogen) TN:TP (total phosphorus) ratio are still debateable as some studies have shown that the dominance of cyanobacteria in water reservoirs is not always linked to low TN:TP ratio (Mhlanga, 2008; Von Sperling et al., 2008). Mhlanga (2008) found that there was a low TN:TP ratio in Lake Chivero, Zimbabwe, at the time of her study but cyanobacteria was not persistently dominant over the period. On the other hand, in Vargem das Flores Reservoir, Brazil, the TN:TP ratio was very high and cyanobacteria were still dominant (Von Sperling et al., 2008). Kosten et al. (2012) argue that total nitrogen concentration or total phosphorus concentration are better predictors of cyanobacteria dominance than the TN:TP ratio. Cyanobacteria are effective users of phosphorus and can survive in phosphorus-limited environments. The high pH and low light energy requirements are also linked to their physiological nature which enables them to survive under these conditions and hence influences their spatial and temporal distribution in the water column.
Cyanobacteria occurrence in South Africa
The focus of phytoplankton research in South Africa has shifted towards expanding knowledge of driving forces behind cyanobacteria blooms and toxins (Mitchell, 2006). Cyanobacteria genera have been found in water supply reservoirs such as Hartbeespoort, Rietvlei and Mockes dams (Wnorowski, 1992; Downing and Van Ginkel 2004; Mohale, 2011). The Vaal Dam (also found on the Vaal River system) is one of the reservoirs in South Africa with eutrophication problems resulting in the occurrence of cyanobacteria. Studies by Downing and Van Ginkel (2004) and Mamba et al. (2007) have indicated the presence of cyanobacteria in the reservoir. Harding (2008) classified the Vaal Dam reservoir as eutrophic based on the total in-lake phosphorus and chlorophyll-α (chl-α) content (Harding, 2008).
There is therefore a need to establish the extent of occurrence of cyanobacteria genera in Vaal Dam in order to inform sustainable management strategies to reduce the risk of the effects of cyanobacteria genera on potable water production. The objective of this study was to analyse the occurrence of cyanobacteria genera in the Vaal Dam and to investigate the factors that influence its dominance in this particular reservoir.
Study area
The reservoir under study was the Vaal Dam situated on the Vaal River. The Vaal River system is one of the most highly impounded river systems in South Africa and about 12 million people (23% of the total population) rely on it for their domestic water supply (Government of South Africa, 2013). The river system is valued as an important basin in the country because industries in the Gauteng Province and adjacent provinces of the Free State and Mpumalanga are supplied from it (Mckenzie and Wegelin, 2009). The Vaal River basin is subdivided administratively into Upper, Middle and Lower Water Management Areas (WMA) in accordance with the water resources management policy of South Africa (Karodia and Weston, 2001). The Vaal Dam is found in the Upper Vaal WMA which is located towards the north-eastern side of the country as shown in Fig 1.
The Upper Vaal WMA is characterised by urban and industrial areas in the northern and western parts of the WMA, with extensive coal and gold mining activities also taking place in the WMA (Braune and Rogers, 1987). The Upper Vaal WMA is economically important to South Africa, contributing nearly 20% of the gross domestic product of the country, which in 2009 wa the second-largest contribution to the national wealth amongst the then 19 WMAs in the country (Herold, 2009). These activities are generating substantial return flow volumes in the form of treated effluent from industry, mines and urban areas which is discharged into the Vaal River system. These discharges contribute to the deterioration of the water quality in the river system. The potential for future economic growth in this WMA remains strong and hence the effects of these discharges are also expected to increase.
Vaal Dam has a full supply level of approximately 1 484 m amsl with a catchment area of 37 100 km2. The capacity of the dam is 2 330 x 106 m3 at a mean depth of 22.5 m and surface area of 321.07 km2, with a hydraulic retention time of 2.1 years (Braune and Rogers, 1987).
The reservoir is fed from two major rivers; the Vaal River from the north east and the Wilge River from the south east, as indicated in Fig. 2.

The Vaal Dam reservoir supplies 80% of the water that is treated at Zuikerbosh Water Treatment Plant for potable use (Van Wyk, 2000; Bamuza-Pemu and Chirwa, 2010; Rand Water, 2011). Water abstracted from the Vaal Dam for treatment undergoes the conventional processes of coagulation, flocculation, sedimentation, rapid sand filtration and chlorination (Ewerts et al., 2013).
METHODS
Data collection
In order to analyse the occurrence of cyanobacteria in Vaal Dam, information on the phytoplankton genera found in the reservoir and their percentage composition was necessary. Information on environmental factors such as weather parameters, water temperature, nitrogen and phosphorus compounds was also required to explain dominance of cyanobacteria over other genera.
Historical data from a sampling point close to the dam wall and the raw water intake point (Fig. 3) was obtained from the Department of Water and Sanitation (DWS), for percentage composition of the phytoplankton, total phosphorus, NO2-N and NO3-N, and water temperature, for the years 2006, 2007, 2011 and 2012.

The years studied were chosenbased on the availability of continuous data for the selected parameters. The sampling point was a monitoring point for the DWS and was deemed suitable for the study because of its proximity to the raw water intake point and also the avalaibility of historical monitoring data. Water quality monitoring using depth-integrated sampling was carried out twice a month yielding 24 datasets for each parameter for each year.
The percentage composistion of the phytoplankton was determined in the DWA water quality laboratory by the phyto-plankton identification and percentage representation inverted microscope method (Truter, 1987). Phytoplankton colonies were identified under the inverted microscope and the percentage representation was estimated in relation to all other phytoplankton present. Total phosphorus and NO2-N and NO3-N concentrations were determined in the DWA laboratory using the 'automated determination of total phosphorus as phosphomolybdate; automated determination of dissolved nitrate by cadmium reduction; automated determination of dissolved nitrite' analysis methods and water temperature was measured in the field with a multimeter (Van Niekerk, 2004).
Historical weather data were obtained from the South African Weather Service (SAWS). Monthly averages of air temperature, rainfall, and wind speed for the years 2006, 2007 and 2011 were collected from a station in Vereeniging, a town near the Vaal Dam (34 km away; there was no weather station at the reservoir) were used in the study.
Data analysis
Statistical analysis was used to analyse the data using STATA V10 and SPSS 16.0. Pearson correlation coefficients were calculated to test for relatedness of a pair of continuous variables at a significance level of 0.05. Time-series analysis was performed to investigate the temporal variations of the dominance of cyanobacteria genera over the study period. The temporal trends were analysed from month to month to establish seasonal differences, as well as from year to year to establish annual differences. Seasonal differences were analysed over the years 2006, 2007, 2011 and 2012, as the monthly data over these years were consistent and continuous. Annual differences were analysed over the years 2006, 2007, 2011 and 2012 by comparing annual means of percentage dominance of cyanobacteria genera.
RESULTS
Occurrence of cyanobacteria in the Vaal Dam
Cyanobacteria genera have been identified among the phyto-plankton genera found in the Vaal Dam. Five genera of cyano-bacteria have been identified. The cyanobacteria genera found were Anabaena, Merismopedia, Microcystis, Nodularia and Oscillatoria. Anabaena and Microcystis occurred more frequently than the other genera (more than 90% of the dataset) and were therefore used in the analysis of dominance.
Dominance of cyanobacteria genera in the Vaal Dam
Results of a statistical analysis of the mean percentage dominance of the cyanobacteria in Vaal Dam in the different months for 4 years are shown in Table 2.
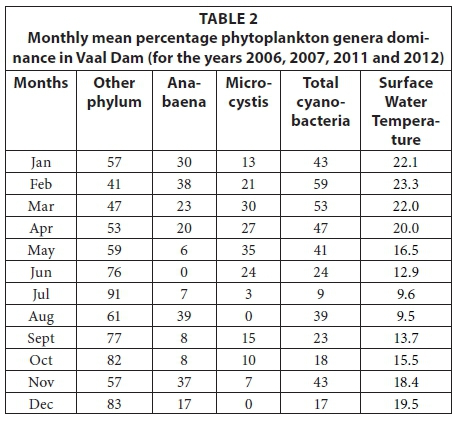
It was found that cyanobacteria genera were collectively dominant (mean of 50% and above) in February and March. Even though the means for January and April were below 50%, (43% and 47% respectively), they represented a substantial dominance of one taxon versus all the other taxa found in the reservoir. The cyanobacterial genera contributing to this dominance were mostly Anabaena and Microcystis. A comparison with mean water temperature measured in the same period showed that dominance of cyanobacteria genera was when mean water temperatures were above 20°C.
Factors affecting dominance of cyanobacteria in Vaal Dam reservoir
Correlations of cyanobacterial dominance with environmental conditions (for parameters where data was continuously available) in and around the reservoir, are shown in Table 3.
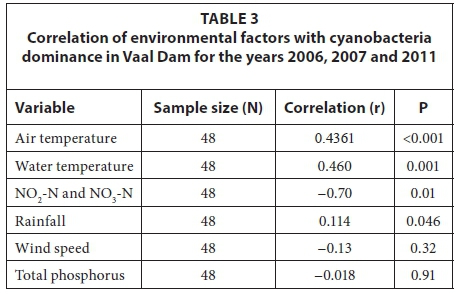
Cyanobacteria dominance was significantly positively correlated to air and water temperatures and negatively correlated to NO2-N and NO3-N concentrations, as also established by previous studies such as Mhlanga (2008), Von Sperling et al. (2008) and Davis et al. (2009). Total phosphorus was not significantly correlated to cyanobacteria dominance. A study by Toerien et al. (1975) found that the primary phytoplankton growth-limiting nutrient for Vaal Dam was nitrogen.
DISCUSSION
Cyanobacterial genera have been observed in the reservoir in all months of the year over the study period, in varying degrees of dominance. A marked seasonal trend was observed for dominance of cyanobacteria genera, with this occurring in the warm months of the year, namely February and March. These months are characterised by relatively high air temperatures which translate to high water temperatures. According to several studies, dominance of cyanobacteria genera is favoured by water temperatures of between 15°C and 25°C (Mhlanga et al., 2006; Davis et al., 2009; Paerl and Paul, 2012). A study by Gyedu-Ababio (2004) on the Vaal Dam found that toxins from phyto-plankton blooms were usually found during the warmer months of the year, confirming the influence of temperature on growth and dominance of cyanobacteria in the reservoir.
The prevalence of cyanobacteria genera over the years has increased and two major genera of Anabaena and Microcystis have dominated the other genera. According to Janse van Vuuren et al. (2006), Microcystis genera usually dominate a habitat and exclude almost all other genera of cyanobacteria. This would seem to be the case in this reservoir as all other genera of cyanobacteria were excluded, with the exception of Anabaena. Downing and Van Ginkel (2004) found Anabaena and Microcystis to be the dominant cyanobacteria genera for the period 1990 to 2000 in Vaal Dam and 15 other dams studied during the same period. The dominant cyanobacteria genera found in impoundments that were experiencing odour problems (including Vaal Dam) in a study by Wnorowski (1992) were Anabaena and Microcystis.
CONCLUSION
• In general, cyanobacteria genera dominated in the warm months of January and February.
• Anabaena and Microcystis, which are associated with taste and odour problems and are capable of producing cyanotoxins, were dominant over all the periods that were investigated.
• Temperature and NO2-N and NO3-N were found to influence dominance of cyanobacteria in the Vaal Dam.
It was recommended that depth profiling of the occurrence of cyanobacteria be done in order to identify an abstraction depth in the multilevel intake of the reservoir that has relatively low levels of cyanobacteria cells. The uptake of cyanobacteria cells would be minimised by selective withdrawal of water at depths with relatively low levels of the cells. This would assist in minimising taste and odour events in potable water production.
ACKNOWLEDGEMENTS
This study was carried out as part of doctoral studies funded by Tshwane University of Technology and Schlumberger Foundation. The Department of Water and Sanitation Resource Quality Information Services (South Africa) and South African Weather Service are acknowledged for providing data. Mr Abellac Chemura and Tom Tom Africa are acknowledged for assisting with the drawing of the figures.
REFERENCES
ABD EL-MONEM AM (2008) Impact of summer thermal stratification on depth profile of phytoplankton productivity, biomass, density and photosynthetic capacity in Lake Nasser (Egypt). Jordan J. Biol. Sci. 1 (4) 173-180. [ Links ]
BAMUZA-PEMU EE and CHIRWA EMN (2010) Photocatalytic degradation of taste and odour causing compounds in natural water sources. Chem. Eng. Trans. 23 387-392. [ Links ]
BRAUNE E and ROGERS KH (1987) The Vaal River Catchment: Problems and research needs. National Scientific Programmes Unit: CSIR, SANSP Report 143. 44 pp. URL: http://researchspace.csir.co.za/dspace/handle/10204/2373 (Accessed 5 January 2014). [ Links ]
CARMICHAEL WW (1985) Freshwater cyanobacteria (blue-green) toxins: isolation and characterization. URL http://www.dtic.mil/dtic/tr/fulltext/u2/a180183.pdf (Accessed 8 May 2014). [ Links ]
DAVIS TW, BERRY DL, BOYER GL and GOBLER CJ (2009) The effects of temperature and nutrients on the growth and dynamics of toxic and non-toxic strains of Microcystis during cyanobacteria blooms. Harmful Algae 8 715-725. http://dx.doi.org/10.1016/j.hal.2009.02.004 [ Links ]
DOWNING TG and VAN GINKEL CE (2004) Cyanobacterial monitoring 1990-2000: Evaluation of SA data. WRC Report No. 1288/1/04. Water Research Commission, Pretoria, South Africa. [ Links ]
DU PREEZ H and VAN BAALEN L (2006) Generic incident management framework for toxic blue-green algal blooms, for application by potable water suppliers. WRC Report No. TT 263/06. Water Research Commission, Pretoria. [ Links ]
DWA (DEPARTMENT OF WATER AFFAIRS, SOUTH AFRICA) (2010) Water Management Area maps, Pretoria, South Africa. [ Links ]
EWERTS H, SWANEPOEL A and DU PREEZ HH (2013) Efficacy of conventional drinking water treatment processes in removing problem-causing phytoplankton and associated organic compounds. Water SA 39 (5) 739-750. http://dx.doi.org/10.4314/wsa.v39i5.19 [ Links ]
GYEDU-ABABIO T (2004) An investigation into the possible sources of nutrients in the Vaal Dam catchment and the cost implications to Rand Water. Paper presented at: Water Institute of Southern Africa (WISA) Biennial Conference 2004, 2 -6 May 2004, Cape Town South Africa. [ Links ]
HARDING WR and PAXTON BR (2001) Cyanobacteria in South Africa: A Review. WRC Report No. TT 153/01. Water Research Commission, Pretoria. [ Links ]
HARDING WR (2008) The determination of annual phosphorus loading limits for South African dams. WRC Report No. 1687/1/08. Water Research Commission, Pretoria. [ Links ]
HEROLD CE (2009) Des Midgley Memorial Lecture: The Water Crisis in South Africa. Presented at: 14th SANCIAHS Symposium. URL: https://www.researchgate.net/publication/229005438_Des_Midgley_Memorial_Lecture_the_Water_Crisis_in_South_Africa (Accessed 8 April 2014). [ Links ]
HO L, SAWADE E and NEWCOMBE G (2012) Biological treatment options for cyanobacteria metabolite removal - a review. Water Res. 46 1536-1548. http://dx.doi.org/10.1016/j.watres.2011.11.018 [ Links ]
HOKO Z and MAKADO PK (2011) Optimization of algal removal process at Morton Jaffray water works, Harare, Zimbabwe. Phys. Chem. Earth 36 1141-1150. http://dx.doi.org/10.1016/j.pce.2011.07.074 [ Links ]
JANSE VAN VUUREN S, TAYLOR J, GERBER A and VAN GINKEL C (2006) Easy Identification of the most common freshwater algae. Department of Water Affairs and Forestry, Pretoria. [ Links ]
KARODIA H and WESTON D (2001) South Africa's new water policy and law. In: Abernethy CL (ed.) Intersectoral Management of River Basins. International Water Management Institute, Colombo, Sri Lanka. [ Links ]
KOSTEN S, HUSZAR VLM, BECARES E, COSTA LS, VAN DONK E, HANSSON L-A, JEPPESENK E, KRUK C, ELL LACEROT GSS, MAZZEO N and co-authors (2012) Warmer climates boost cyanobacterial dominance in shallow lakes. Glob. Change Biol. 18 118-126. http://dx.doi.org/10.1111/j.1365-2486.2011.02488.x [ Links ]
MAMBA BB, KRAUSE RW, MALEFETSE TJ, MHLANGA SD, SITHOLE SP, SALIPIRA KL and NXUMALO EN (2007) Removal of geosmin and 2-methylisorboneol (2-MIB) in water from Zuikerbosch Treatment Plant (Rand Water) using ß-cyclodextrin polyurethanes. Water SA 33 (2) 223-228. [ Links ]
MCKENZIE R and WEGELIN W (2009) Challenges facing the implementation of water demand management initiatives in Gauteng Province. Water SA 35 (2) 168-174. [ Links ]
MHLANGA L (2008) Environmental variables and the development of phytoplankton assemblages in a hyper-eutrophic African reservoir. PhD thesis, University of Cape Town. [ Links ]
MHLANGA L, DAY J, CRONBERG G, CHIMBARI M, SIZIBA N and ANNADOTTER H (2006) Cyanobacteria and cyanotoxins in the source water from Lake Chivero, Harare, Zimbabwe, and the presence of cyanotoxins in drinking water. Afr. J. Aquat. Sci. 31 (2) 165-173. http://dx.doi.org/10.2989/16085910609503888 [ Links ]
MITCHELL S (2006) The effects of pollution on fish and people. Proc. 10th Yellowfish Working Group, 7-9 April 2006, Sterkfontein Dam, Harrismith. [ Links ]
MOHALE LR (2011) Impact of cyanobacterial toxins on water quality and supply. MSc dissertation, University of the Free State. [ Links ]
OBERHOLSTER PJ and ASHTON PJ (2008) State of the Nation Report. An overview of the current status of water quality and eutrophication in South African rivers and reservoirs. URL: http://www.anthonyturton.com/admin/my_documents/my_files/44b (Accessed 19 July 2012). [ Links ]
PAERL HW and PAUL VJ (2012) Climate change: Links to global expansion of harmful cyanobacteria. Water Res. 46 1349-1363. http://dx.doi.org/10.1016/j.watres.2011.08.002 [ Links ]
RAE B, MOOLLAN R and CLARK R (1999) Algal toxins in drinking water supplies. WRC Report No. 549-1-99. Water Research Commission, Pretoria. [ Links ]
RAND WATER (2011) Chlorophyll-a and algal identification report for August 2011. URL: www.reservoir.co.za (Accessed 19 July 2012). [ Links ]
ROUX S, OELOFSE S and LANGE WD (2010) Can SA afford to continue polluting its water resources? With special reference to water pollution in two important catchment areas. Proc. CSIR 3rd Biennial Conference 2010. Science Real and Relevant, 30 August - 01 September 2010, CSIR International Convention Centre, Pretoria. 13 pp. [ Links ]
STATS SA (STATISTICS SOUTH AFRICA) (2013) Mid-year population estimates. URL: www.statssa.gov.za (Accessed 20 May 2014). [ Links ]
TIAN C, PEI H, HU W and XIE J (2012) Variation of cyanobacteria with different environmental conditions in Nansi Lake, China. J. Environ. Sci. 24 (8) 1394-1402. http://dx.doi.org/10.1016/S1001-0742(11)60964-9 [ Links ]
TOERIEN DF, HYMAN KL and BRUWER MJ (1975) A preliminary trophic status classification of some South African impoundments. Water SA 1 (1) 15-23. [ Links ]
TRUTER E (1987) An aid to the identification of the dominant and commonly occurring genera of algae observed in some South African impoundments. Department of Water Affairs, Pretoria [ Links ]
VAN NIEKERK H (2004) South African-UNEP GEMS/Water: Monitoring Programme Design. DWAF-RQS Report No. N/0000/00/REQ0604. Department of Water Affairs and Forestry, Pretoria. [ Links ]
VAN WYK JE (2000) The use of water quality indices during water cycle management: An integrated approach. Paper presented at: WISA Biennial Conference 2000, 28 May - 1 June 2000, Sun City, South Africa. [ Links ]
VON SPERLING E, DA SILVA FERREIRA AC and GOMES LNL (2008) Comparative eutrophication development in two Brazilian water supply reservoirs with respect to nutrient concentrations and bacteria growth. Desalination 226 169-174. http://dx.doi.org/10.1016/j.desal.2007.02.105 [ Links ]
WESTRICK JA, SZLAG DC, SOUTHWELL BJ and SINCLAIR J (2010) A review of cyanobacteria and cyanotoxins removal/inactivation in drinking water treatment. Anal. Bioanal. Chem. 397 1705-1714. http://dx.doi.org/10.1007/s00216-010-3709-5 [ Links ]
WHO (1999) Toxic Cyanobacteria in Water: A Guide to their Public Health Consequences, Monitoring and Management. EandFN Spon, London. [ Links ]
WNOROWSKI AU (1992) Taste and odour forming microorganisms in South African surface waters. WRC Report No. 320/1/93. Water Research Commission, Pretoria. [ Links ]
Received 20 December 2014;
Accepted in revised form 1 June 2016
* To whom all correspondence should be addressed. s +26 378 206 8273 / +27 62 704 6350; e-mail: anchinyama@gmail.com

