


Services on Demand
Article
 English (pdf)
 Article in xml format
 Article references
Indicators

Related links
-
 Cited by Google
 -
 Similars in Google
Share

 Permalink
Water SA
On-line version ISSN 1816-7950
Print version ISSN 0378-4738
Water SA vol.42 n.3 Pretoria Jul. 2016
http://dx.doi.org/10.4314/wsa.v42i3.04
ORIGINAL ARTICLES
Abiotic water quality control on mangrove distribution in estuarine river channels assessed by a novel boat-mounted electromagnetic-induction technique
Melissa A AtwellI, *; Mark N WuddiviraII; Judith F GobinIII
IDepartment of Geography, University of the West Indies, St. Augustine, Trinidad and Tobago
IIDepartment of Food Production, University of the West Indies, St. Augustine, Trinidad and Tobago
IIIDepartment of Life Sciences, University of the West Indies, St. Augustine, Trinidad and Tobago
ABSTRACT
Due to climate change impacts and the resulting sea-level rise, saline waters have been found further inland in tropical riverine estuaries such as the Godineau wetland, Trinidad. The saline water intrusion could constrain mangrove vegetation distribution. We investigated the surface water quality of two river channels (2 km and 6 km), emanating from a tropical wetland and from forest/agriculture at high-tide, respectively. Using a novel boat-mounted geophysical approach, spatially exhaustive river/estuarine salinity data was collected. Water quality parameters - salinity, pH and dissolved oxygen (DO) - were compared with vegetation surveyed along the course of the rivers to determine relationships between plant zonation and water quality. Our findings showed similar trends for salinity and apparent electrical conductivity, which were higher in the 2 km channel (27.10 to 31.80 dS/m) than in the 6 km channel (17.80 to 27.10 dS/m), while pH and DO levels were lower in the 2 km channel than in the 6 km channel due to higher levels of decomposition in the stagnant shorter channel. Red mangrove (Rhizophora mangle) was found in areas with little oxygen, high salinities and high acidity, making it more adaptable to conditions resulting from saline intrusion. Therefore, to replace the mangrove that has been lost due to die-off, the red mangrove maybe used in viable restoration efforts for the protection of inland areas from floods, as well as to provide ecosystem goods and services.
Keywords: electromagnetic-induction, tropical wetland, water quality, mangrove distribution
INTRODUCTION
Tidal inundation is one of the major determinants that have been recognized to influence mangrove distribution as it influences abiotic factors such as salinity, redox potential/oxygena-tion, and water physical and chemical properties (Wan et al., 2014). These factors play an important role in plant composition, productivity, and zonation (Adams, 1963; Mahall and Park, 1976b,c; Adam, 1990; Callaway et al., 1990; Pennings and Callaway, 1992; Atwell et al., 2013; Brechet et al., 2012) and have been the focus of increased research due to rising sea levels as a result of climate change (Feller et al., 2010; Traill et al., 2011; Nitto et al., 2014). Throughout the world the determinants of mangrove distribution are varied and complex (Manson et al., 2003) and have long attracted scientific interest (e.g. Hutchings and Saenger, 1987; Snedaker, 1982; Tomlinson 1986 and Walsh, 1974). Abiotic determinants which explain worldwide mangrove distribution include geomorphic processes (Thom, 1967) and tidal inundation (Clarke and Hannon, 1970). Biotic determinants, however, comprise physiological tolerance and adaptations to salinity (Ball, 1988), interspecific competition (Ball, 1980), differential dispersal and predation of propagules (Rabinowitz, 1978; Smith et al., 1989) and, though less important, forest succession following land building (Louda 1989; Smith, 1992).
Mangrove research in the Caribbean basin, however, indicates that zonation along the intertidal zone is strongly controlled by salinity as the major underlying mechanism responsible for distribution patterns (Cintron et al., 1978; Jimenez, 1990; Pool et al., 1977; Soto and Jimenez, 1982).
One of the challenges to obtaining a better understanding of the underlying mechanisms of zonation in wetlands, and particularly in mangroves in the Caribbean, is the lack of high-resolution spatio-temporal measurements for parameters such as salinity, that are considered to be major controls, especially in complex intertidal systems (Atwell et al., 2013). Small island developing states such as the Caribbean heavily depend on mangrove ecosystems as a source of food, a buffer against storms and a habitat to organisms. Depletion of wetlands has a greater impact on livelihoods and economies in these countries. When considering how best to restore wetlands, data that identifies water quality niches or zones, which represent one factor in species zonation, could help in the planning and targeting of restoration and management efforts.
Electromagnetic-induction (EMI) has been used for the collection of high-resolution spatio-temporal measurements (Abdu et al., 2007; Atwell et al., 2014). The EMI is very effective in detecting salinized locations, mapping salinity extent and intensity, and finding possible sources of salinity (Paine, 2003) and as such can be used to monitor salt water intrusion in estuarine ecosystems. It produces more spatially intensive 'soft data' that can be linked to other water quality parameters (Doolittle et al., 1994; Atekwana et al., 2000) such as salinity. EMI measurements are closely related to salinity (Triantafilis et al., 2000). Many studies have shown a strong correlation between EMI measurements and electrical conductivity of water, soil, therefore EMI signals can be used as proxies of salinity (Cameron et al., 1981; Rhoades et al., 1989; Williams and Fiddler, 1983; Wollenhaupt et al., 1986; McKenzie et al., 1989; Williams and Arunin, 1990; Slavich and Petterson, 1990; Lesch et al., 1992). The EMI's mode of operation depends on coil orientation, spacing and operation frequency (McNeill, 1980; Doolittle et al., 1994; Atwell et al. 2013). The weighted average conductivity measurement or apparent electrical conductivity (ECa) is obtained according to the depth response function of the meter (Doolittle et al., 1994). The EMI-based approach can be used to infer various properties such as salinity (Rhoades et al., 1999; Hendrickx and Kachanoski, 2002), clay content (Triantafilis et al., 2001; Triantafilis and Lesch, 2005; De Benedetto et al., 2010), water content (Haimelin, 2008), carbon content (Martinez et al., 2009), soil water electrical conductivity, soil depth and temperature (Friedman, 2005). It has the advantage of collecting dense geo-referenced spatial measurement coverage non-invasively, rapidly, and time- and cost-effectively (Blöschl and Grayson, 2000; Atwell et al., 2013), while identifying areas of high and low conductivity at a particular depth along a water channel.
This study explores mangrove distribution and its control factors. We hypothesize that saline water intrusion affects the abiotic water quality factors (electrical conductivity, pH, DO, turbidity, temperature) that control Rhizophora mangle (red mangrove), Avicennia germinans (black mangrove) and Laguncularia racemosa (white mangrove) distribution. By adopting an innovative measurement campaign to determine water quality using conventional sensors and high spatial resolution geophysical imaging, the river/estuarine salinity patterns were monitored over the wet and dry seasons; this enabled the assessment of processes within the estuary in great detail. Therefore, our objectives were (i) to evaluate the temporal changes in abiotic water quality factors due to saline water intrusion in a tropical estuarine ecosystem, and (ii) to investigate mangrove distribution based on the temporal changes of abiotic factors along the estuarine channels.
MATERIALS AND METHODS
Location and climate
The Godineau Swamp is located in the Godineau Watershed on the south-western coast of Trinidad, lying roughly between 10° 13-15' N and 61° 30-32' W (Fig. 1). The climate according to the Koppen classification system is a Group A tropical rainforest climate with distinct wet and dry seasons. The wet season occurs from June to December, while the dry season occurs from January to May. Similar to other humid tropical climates, during the wet season in the Godineau watershed groundwater storage accumulates raising the water table and resulting in maximum run-off from the land at the end of the wet season (Mills, 1992). During this period, the river system is dominated by freshwater.

When the dry season sets in and terrestrial runoff is reduced, saline water penetrates further up the river (Mills, 1992). This phenomenon, though typical, has not been substantiated by a systematic investigation in this estuarine ecosystem. The average amount of rainfall per year for the southern part of the island) is approximately 1 800 mm and average temperature is 25°C, with high evapotranspiration rates that account for up to 60% of rainfall received in some parts of the island (The Water Resources Agency, 2001).
Description of study site
The Godineau estuarine/river system comprises of a brackish coastal lagoon sheltered by a sandbar. On the landward side of this estuarine/river system there are mangroves, tidal mudflats and marshes which receive run-off from five major tributaries extending over a total area of approximately 3 200 ha (Fig. 1). These tributaries are the Forty Foot Trench, Cipero River, St. John's River, Trinidad River and Blackwater River. These tributaries all unite in the South Oropouche River which flows into the Gulf of Paria (Ramsundar, 2005).
Within this study region, two tributaries of the South Oropouche River were selected to investigate the plant zona-tion because of their mangrove coverage and accessibility. One tributary is dominated by run-off from forest and agriculture (Blue line in Fig. 1) whilst the other drains from the wetland (Red line in Fig. 1). This allowed for comparison of water quality and vegetation for the different sections of the river draining different land uses, plant communities and niches. The portion of the main channel with the most human influence (as it drains agricultural lands) begins at the Woodland Fishing Facility (Bridge 2. Fig. 1) and ends at the Gulf of Paria (Bridge 1. Fig. 1). This section of the main channel is approximately 6 km in length and 50 m in width (Fig. 1). One of the side channels which emerges in a north-easterly direction off the main channel was also studied. This side channel was approximately 2 km in length and 30 m in width (Fig. 1) and represented the navigable (by boat) portion of the tributary. The study channels in relation to vegetation distribution are also shown in Fig. 1. The vegetation pattern follows the typical structure where mangrove along the coast gives way to sedge, which then gives way to grass with increasing distance inland (Fig. 1).
The study site has been modified extensively to suit the short-term needs of the surrounding communities. In the past 10 years, levees have been built to accommodate a greater volume of water flowing through the river channel and sluice gates installed to regulate the flow of saltwater entering the wetland. It is believed that these sluice gates, which help protect crops from saltwater inundation, no longer function properly (Mills, 1992). The main channel of the South Oropouche River carries the larger volume of water to the Gulf of Paria, which impedes the free flow of the side channel. The side channel tends to carry a lot of run-off from the mangroves and is not flushed as regularly as the main channel.
Field measurements
Field measurements (electromagnetic induction, water quality testing and mangrove identification) were conducted between the months of October 2008 and September 2009. Initially, measurements were conducted on a bimonthly basis, after which they were conducted monthly to capture changes in the river's physicochemical dynamics within and between seasons (dry and wet). The month of September was tested twice, at the beginning and at the end of the month. The measurements at the beginning of the month were done to capture the dynamics in the month of August which was not tested because of extreme weather conditions. To quantify the seasonal processes within the river, monitoring was done at high-tide so that extreme conditions that may contribute to the control of mangrove zonation would be captured. At low tide, conditions that control mangrove zonation are not as pronounced within the river, combined with the regular flushing of the river with freshwater, these controls become more difficult to capture.
Water quality measurements along the South Oropouche River
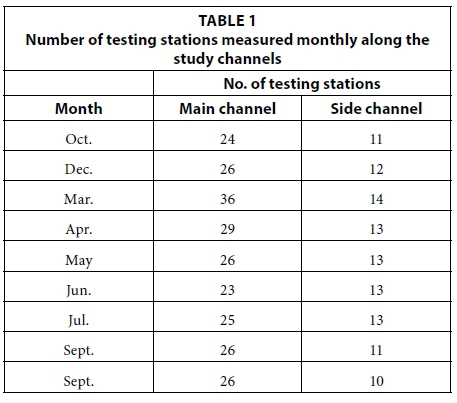
To assess water quality, we collected monthly pH, electrical conductivity, salinity, turbidity, dissolved oxygen and temperature data on the same bimonthly to monthly basis as described above using a boat-mounted Horiba U-10 (Troy, Michigan, USA) sensor at a depth of 50 cm below the water surface, to capture salinity changes at testing stations. A 50 cm depth was chosen to capture the influence of abiotic water quality factors at the region where mangrove prop and feeder roots concentrate. Sampling frequency was approximately every 300 m along the river channels at a boat speed of 3 km/h. All measurement points were geo-referenced using a GPS (3 m accuracy, Royal Tek, Kuei Shan, Tao Yuan, Taiwan). The spatial distribution of the ECa measured by electromagnetic induction (EMI) was used as an indication of the salinity gradient along the river channel. Measurements of water quality using the multiparameter quality sensor were taken based on noticeable changes discriminated by the ECa values. Therefore the number of testing stations varied depending on the freshwater inputs in a particular sampling time (Table 1).
The spatial patterns in salt water tidal inundation up the river over an annual cycle were determined using the EMI device (Dualem 1S, Milton, Ontario, Canada). The device was placed on the bottom of the prow of a fibreglass boat. The sensor has the advantage of facilitating real-time data acquisition and large quantities of data. Therefore, a rapid boat trip down (approx. 15 min, 25 km/h) each of the river channels was adequate to collect EMI data. The EMI instrument was used to measure the apparent electrical conductivity (ECa) of the river channels; it was connected to a field computer (Archer Ultra Rugged Field PC, Juniper Systems Inc. Logan, UT, USA) which logged the data using the HGIS software package (Starpal, Fort Collins, CO, USA) and a GPS receiver (BT GPS Receiver (Royal Tek, Kuei Shan, Tao Yuan, Taiwan) which provided accurate location (accuracy 3 m) and time information for each measurement.
Mangrove identification and percentage cover estimation along the South Oropouche River
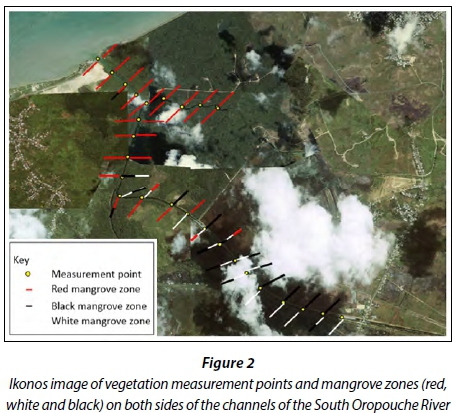
Mangrove identification and per cent cover estimations were conducted along the banks of the river. This was done using the visual estimation method in proportion (%) to the total site area (Pollock et al., 1998), at 500 m transect intervals along the banks of the river. Identification and visual estimations based on field observations of mangrove species stands were performed by the trained staff of The National Herbarium of Trinidad and Tobago and GPS locations recorded. The location of each site where percentage cover was estimated is shown in Fig. 2.
Data analysis
ECa data obtained using the EMI were graphed using the Stanford Geostatistical Modeling Software (SGeMS). These spatial graphs reflected the magnitude of apparent electrical conductivity at different locations within the portions of the river channels studied. Histograms, box plots and scatter plots were produced to determine the distribution and trends within the water quality dataset, while mean separation test among plant species in relation to water quality was conducted using a t-test (two sample assuming unequal variances). Regression analysis was also performed on the water quality dataset within the different mangrove zones to determine their coefficient of determination.
RESULTS AND DISCUSSION
Water quality parameters within the study channels of the South Oropouche River
Very similar trends were observed for each parameter recorded in the main river channel (Fig. 3). Average range of values for pH (7.50), electrical conductivity (38.60 dS/m), dissolved oxygen (5.20 mg/L) and temperature (28.70°C) were all highest towards the seaward edge of the river and decreased further inland with minimum values of approx. pH 7, electrical conductivity 12.90 dS/m, dissolved oxygen 3.20 mg/L and temperature 28°C. This may have been the result of mixing of fresh and sea water towards the seaward edge of the river which increased oxygen levels. Turbidity levels (81.80 NTU), however, were lowest towards the seaward edge of the river and increased further inland (100 NTU). It is suggested that this may have occurred due to sediment run-off from the land, which resulted in the highest turbidity values towards the landward edge of the river. Water temperatures can be higher at river convergences (Kiffney et al., 2006). Therefore, with the 1 000 m mark being the point at which the main and side channel meet, temperatures were higher. The slight drop in dissolved oxygen and turbidity values at the convergence, however, could be attributed to their lower values in the side channel (Fig. 4), which lowers the turbidity and dissolved oxygen values in the main channel at the 1 000 m mark (Fig. 3).
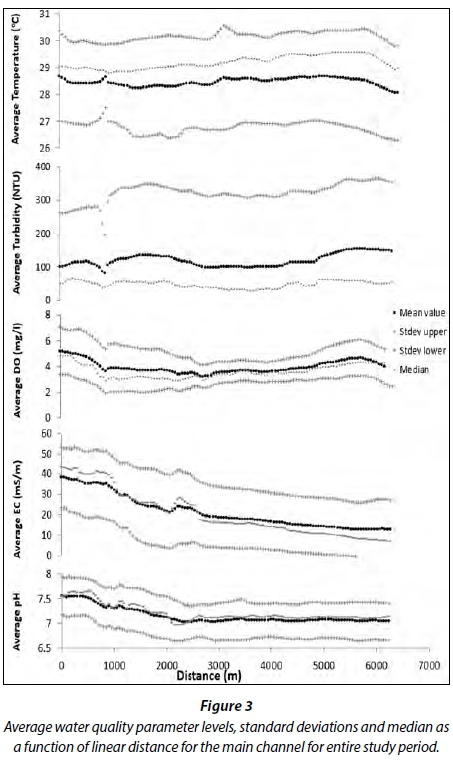
The range of median values for dissolved oxygen (2.90-4.90 mg/L), electrical conductivity (7.60-43.80 dS/m) and pH (6.90-7.70) closely reflected the average values for these water quality parameters indicating the normality of the datasets (Fig. 3). The range of median values for temperature (28.80-29.60°C) and turbidity (29.70-68.60 NTU), however, fell above and below the average values for these parameters, respectively, indicating that the datasets were skewed. The range of standard deviation values for each parameter was found above and below the mean values, indicating that the data set was acceptable. Turbidity, however, showed the most variation, with an upper standard deviation falling within the range of 29.70-68.90 NTU; its lower standard deviation fell below zero.
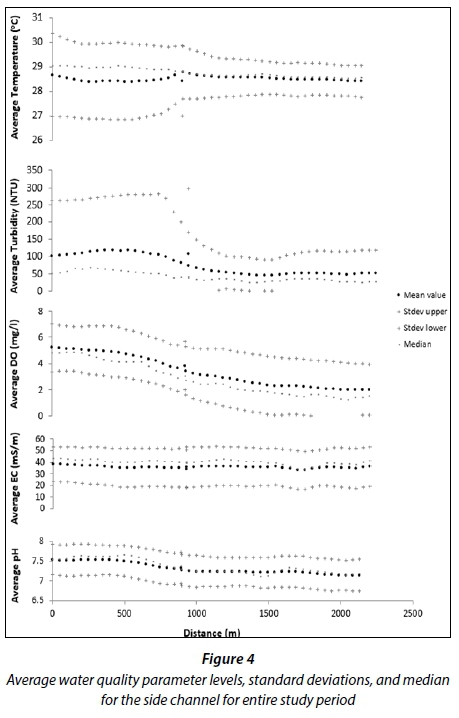
The water quality parameters measured in the side channel (Fig. 4) showed similar changes compared to the main channel when moving from inland waters to the river mouth. Average levels of each parameter, pH (7.50), electrical conductivity (38.60 dS/m), dissolved oxygen (5.20 mg/L), turbidity (117 NTU) and temperature (28.70°C) levels were all highest towards the seaward edge of the river and decreased further into the mangroves (land averages: pH = 7.10, conductivity = 33.20 dS/m, turbidity = 46.10 NTU, dissolved oxygen = 3.20 mg/L and temperature = 28°C). Due to the fact that this water course is sometimes stagnant, there is less variation of values and lower dissolved oxygen and pH levels than what was found in the main channel. These lower DO and pH values may be due to higher mangrove run-off, typically consisting of humic or polyphenolic substances such as humic acid, fulvic acid and tannins (Postma et al., 1976). Direct oxidation of these weak acids lowers pH and DO while raising temperatures. Interactions between polyphenolics and seawater may also lower pH and DO (Boto and Bunt, 1981).
The range of median values in the side channel for dissolved oxygen (2.90-4.90 mg/L), electrical conductivity (33.60-43.70 dS/m), pH (7.10-7.70) and temperature (28.80-29.60°C) closely reflected the average values for these water quality parameters indicating the normality of the datasets. The range of median values for turbidity, however, fell below (26.90-68.60 NTU) the average values for this parameter.
Turbidity showed the most variation with an upper standard deviation falling within the range of 90.60-297.40 NTU, its lower standard deviation of 1.51-6.50 NTU. This was followed by temperature which showed a lot of variation towards the seaward edge of the channel (29.80-30.50°C), and decreasing to moderate variation moving further inland (26.30-27.50°C). Dissolved oxygen, electrical conductivity and pH all showed moderate variation with an upper standard deviation falling within the range of 4.10-7.06 mg/L, 49.40-53.60 dS/m and 7.50-7.90 respectively and a lower standard deviation within the range of 1.90-3.40 mg/L, 6.30-23.70 dS/m and 6.80-7.20.
Comparison of water quality parameters in mangrove zones
A t-test for two populations of unequal variances was performed for those combinations of species that approached normality for each parameter. The mean values of pH for R. mangle and L. racemosa zones presented on Table 2 were significantly different (P = 0.001). This was also true for conductivity (P = 1.16 x10⁻⁷), turbidity (P = 0.01) and dissolved oxygen (P = 0.03). Temperature did not show any significant difference in the means between mangrove zones. The means for pH (7.23) and conductivity (29.25 dS/m) in the R. mangle zone were all significantly higher than that of the L. racemosa zone (pH = 7.08 and conductivity = 15.08 dS/m). The means for turbidity (100.39 NTU) and dissolved oxygen (3.59 mg/L), however, in the R. mangle zone were significantly lower than that of the L. racemosa zone (turbidity = 128.70 NTU and dissolved oxygen = 4.07 mg/L). Ball (1998) reported minimal species diversity in the Adelaide river floodplain, Australia, where areas of high salinity and extreme freshwater resulted in the exclusion of less tolerant species. In the current study, where the scenarios were high salinity and brackish water, the P values suggest the greatest niche differentiation between R. mangle and L. racemosa as the two species occupy physical locations that were furthest apart based on extremes in mean water quality. Furthermore, changes in the physicochemical nature of the river due to saline water intrusion reduce richness as niche differentiation decreases.
Spatial and temporal variability of salinity in the South Oropouche River
The maps showing river water ECa as a function of monthly precipitation for the EMI surveys along the South Oropouche River channels are presented in Fig. 5 and Table 3. The general trend appears to be that as rainfall increased the average ECa decreased (study period October 2008 to September 2009); this was due to tidal flushing of the river by increased freshwater input from rainfall. The month of March experienced the least amount of rainfall (26.92 mm); however, the mean ECa measured was less than what was measured for December (89.92 mm). The sampling for the month of March was conducted at the beginning of the month soon after a large input of rain in the previous month of February (149.60 mm). In the month of September, however, where sampling took place at the end of a month with low rainfall inputs (110.74 mm), ECa values increased in spite of the fact that the month of September followed the highest rainfall input month of August (340.90 mm). The month of December experienced 40 mm less rainfall than what was recorded for October, causing the corresponding mean ECa level to increase to 21.49 dS/m.

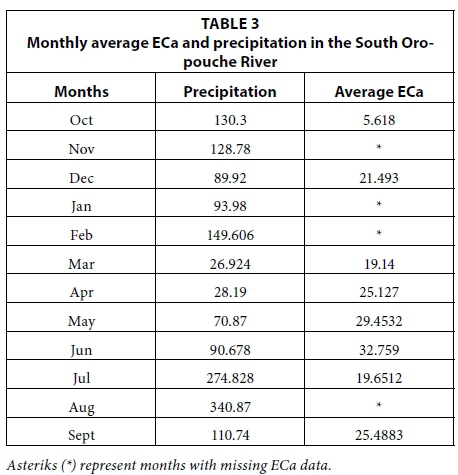
The month of June received 90.70 mm of rainfall and had the highest corresponding mean ECa level (32.80 dS/m). This was probably due to enhanced rainfall infiltration and percolation resulting from decreasing water levels as the hydraulic gradient increases due to the preceding intense dry months of March, April and May. The reduced water inputs lower river and water table levels while rising temperatures increase evaporation and salinity. During the month of July, which was one of the wettest months, approximately 274.80 mm of rainfall was recorded; this corresponded to the mean ECa level of 19.70 dS/m for that month (Table 3).
The movement of saline water further inland showed a clear progression which corresponded with the amount of precipitation in the water channels. In the wetter months of October and December, where freshwater dominated the river channel, less salt water was observed as evidenced by blue pigments indicating lower mean ECa values (Fig. 5). Rainfall for the month of February contributed to the lower mean ECa values observed in March. In the drier months of April, May and June where salt water dominated the river channels moving further inland, red and orange pigments were observed indicating higher mean ECa values.
Since different mangrove species have different tolerances to flooding (He et al., 2007) mangrove morphological adaptations can therefore play a major role in species zonation. R. mangle mangroves contain prop roots which can suspend them out of the water where they take up oxygen from the atmosphere (McKee, 1993). A. germinans mangroves may possess short aerial roots able to withstand less flooding. L. rac-emosa mangroves, however, do not possess this root system and therefore depend on dissolved oxygen from the soil.
Correlations between dissolved oxygen and turbidity within the L. racemosa species may reflect a dependence upon turbid conditions to increase the dissolved oxygen content for mangrove root uptake. As species presence and abundance vary due to habitat differences (Upkong, 1997), it is possible that specific dissolved oxygen habitat differences do exist which may limit the presence and abundance of mangrove species. There is now evidence provided by locals to suggest that t he R. mangle mangroves are also being found further inland. This may suggest an interspecific interaction between these mangrove species, where the R. mangle mangrove may serve as a competitor to the L. racemosa mangrove in these locales.
In the South Oropouche River, R. mangle was found present towards the seaward edge of the river which was characterised by high seawater salinities. R. mangle has been shown to be less tolerant to strongly saline soil (Odum and McIvor, 1990) and therefore prefers the seaward edge because of the regular tidal flushing that reduces the build-up of soil salinity. R. mangle, which normally has lower tolerance for soil salinity, occupies these areas. In the field site, A. germinans and L. racemosa mangroves, which can tolerate higher levels of soil salinity, were located behind the R. mangle mangroves where tidal inundation does not reach as frequently. This was supported by the direct correlation between water salinity and mangrove species zones in the South Oropouche River. Other authors such as McKee (1995) and Odum and McIvor (1990) have also found that A. germinans and L. racemosa zones were found in areas characterized by lower seaward strength salinities. The R. mangle zone was found in this study to be characterised by high seaward strength salinities; this occurrence was also reported by Odum and McIvor (1990).
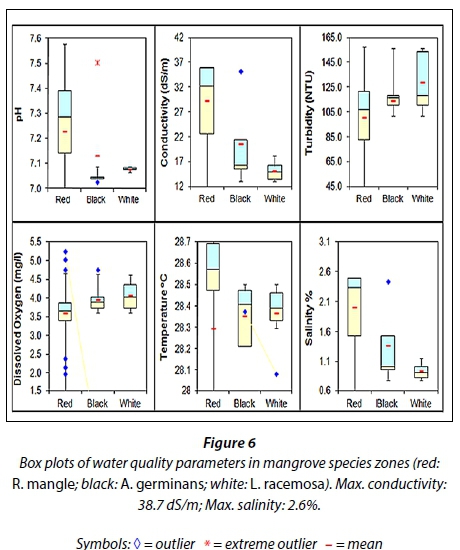
Mangrove species were found to be most dominant in particular niches, with R. mangle and L. racemosa found on the two extremes and A. germinans in the middle (Fig. 6). This distinctive zonation could be seen from the absence of overlap in the median and third quartile values for the parameters of conductivity and salinity (Fig. 6), suggesting that these clear mangrove niches are influenced by conductivity. A. germinans, found in the middle, may exhibit characteristics of each species making them better able to tolerate, to a certain degree, the stresses from each extreme niche. L. racemosa is zoned according to the reciprocal effects of seawater salinity and soil salinity on R. mangle. As the salinity penetrates further upstream with increased tidal inundation due to changes in the river hydrology, modification of environmental stress factors, which different mangrove species build up tolerances against, eventually limits certain species from portions of an environmental gradient (McKee, 1995). This effect can be seen in the South Oropouche River where R. mangle can be observed establishing further upstream where the water levels are higher with increased salinities.
CONCLUSIONS
Using the novel boat-mounted electromagnetic-induction technique (Dualem-1S instrument), the spatial and temporal distribution of salinity along a riverine ecosystem at high-tide was determined. This novel technique has the advantage of navigating small tributaries, typical of inland areas, for the measuring of salinity to access saline water intrusion. Salinity values in the river were higher in the dry season than the wet season due to the constant flushing of the river with freshwater in the wet season. In the dry season salinity values were higher and not different from the seawater, as the salt water was allowed to move further inland without the flushing mechanism found in the wet season. This indicates a high potential of saline water intrusion during the dry season into the surrounding soils, which has implications for agriculture and the riverine ecosystem. Electromagnetic-induction can therefore be applied as a suitable geophysical method to monitor saline water intrusion into the riverine system.
Water quality influenced the zonation of mangrove species along the river. Red mangrove (R. mangle) was the hardiest of the three species found in the Godineau swamp, mainly due to their ability to survive where there was little oxygen, high salinities and high acidity. It was observed that at high water salinities the red mangrove (R. mangle) outcompetes both the white (L. racemosa) and black mangroves (A. germinans), migrating further upstream to occupy new areas. Therefore, because of the need to replace the mangrove that has been lost due to die-off and to contend with the regular flooding within this area, the red mangrove can be used in viable restoration efforts. This is imperative for the protection of inland areas from floods, as well as to provide ecosystem goods and services to the surrounding communities.
REFERENCES
ABDU H, ROBINSON DA and JONES SB (2007) Comparing bulk soil electrical conductivity determination using the DUALEM-1S and EM38-DD electromagnetic induction instruments. Soil Sci. Soc. Am. J. 71 189-196. http://dx.doi.org/10.2136/sssaj2005.0394 [ Links ]
ADAM P (1990) Saltmarsh Ecology. Cambridge University Press, Cambridge, UK. http://dx.doi.org/10.1017/CBO9780511565328 [ Links ]
ADAMS DA (1963) Factors influencing vascular plant zonation in Northern Carolina salt marshes. Ecology 44 445-456. http://dx.doi.org/10.2307/1932523 [ Links ]
ATEKWANA E, WILLIAM A, SAUCK A and DOUGLAS DW (2000) Investigations of geoelectrical signatures at a hydrocarbon contaminated site. J. Appl. Geophys. 44 167-180. http://dx.doi.org/10.1016/s0926-9851(98)00033-0 [ Links ]
ATWELL M, WUDDIVIRA M, GOBIN J and ROBINSON D A (2013) Edaphic controls on sedge invasion in a tropical wetland assessed with electromagnetic induction. Soil Sci. Soc. Am. J. 77 1865-1874. http://dx.doi.org/10.2136/sssaj2013.04.0138 [ Links ]
ATWELL MA, WUDDIVIRA MN and DE CAIRES SA (2014) Seasonal effects on the correlation between electromagnetic-induction signals and the properties of two Trinidad soils. Trop. Agric. 91 187-196. [ Links ]
BALL MC (1980) Patterns of secondary succession in a mangrove forest of southern Florida. Oecologia 44 226-235. http://dx.doi.org/10.1007/bf00572684 [ Links ]
BALL MC (1988) Ecophysiology of mangroves. Trees 2 129-142. http://dx.doi.org/10.1007/bf00196018 [ Links ]
BALL M (1998) Mangrove species richness in relation to salinity and waterlogging: a case study along the Adelaide River floodplain, northern Australia. Glob. Ecol. Biogeogr. 7 73-82. http://dx.doi.org/10.2307/2997699 [ Links ]
BOTO KG and BUNT JS (1981) Dissolved oxygen and pH relationships in northern Australian mangrove waterways. Limnol Oceanogr. 26 1176-1178. http://dx.doi.org/10.4319/lo.1981.26.6.1176 [ Links ]
BRÉCHET L, OATHAM M, WUDDIVIRA M and ROBINSON DA (2012) Determining spatial variation in soil properties in teak and native tropical forest plots using electromagnetic induction. Vadose Zone J. 11 (4) http://dx.doi.org/10.2136/vzj2011.0102 [ Links ]
CALLAWAY RM, JONES S, FERREN JR WR and PARIKH A (1990) Ecology of a Mediterranean-climate estuarine wet-land at Carpinteria, California: plant distributions and soil salinity in the upper marsh. Can. J. Bot. 69 1139-1146. http://dx.doi.org/10.1139/b90-144 [ Links ]
CAMERON DR, DE JONG E, READ DLW and OOSTERVELD M (1981) Mapping salinity using resistivity and electromagnetic inductive techniques. Can. J. Soil Sci. 61 67-78. http://dx.doi.org/10.4141/cjss81-008 [ Links ]
CINTRON G, LUGO A, POOL DJ and MORRIS G (1978) Mangroves of arid environments in Puerto Rico and adjacent islands. Biotropica 10 2110-2121. http://dx.doi.org/10.2307/2388013 [ Links ]
CLARKE LD III and HANNON NJ (1970) The mangrove swamp and salt marsh communities of the Sydney district. Plant growth in relation to salinity and waterlogging. J. Ecol. 58 351-369. http://dx.doi.org/10.2307/2258276 [ Links ]
DE BENEDETTO D, CASTRIGNANÖ A, SOLLITTO D and MODUGNO F (2010) Spatial relationship between clay content and geophysical data. Clay Miner. 45 197-207. http://dx.doi.org/10.1180/claymin.2010.045.2.197 [ Links ]
DOOLITTLE JA, SUDDUTH KA, KITCHEN NR and INDORANTE SJ (1994) Estimating depths to claypans using electromagnetic induction methods. J. Soil Water Conserv. 49 572-575. [ Links ]
FELLER IC, LOVELOCK CE, BERGER U, MCKEE KL, JOYE SB and BALL MC (2010) Biocomplexity in mangrove ecosystems. Ann. Rev. Mar. Sci. 2 395-417. http://dx.doi.org/10.1146/annurev.marine.010908.163809 [ Links ]
FRIEDMAN SP (2005) Soil properties influencing apparent electrical conductivity: A review. Comput. Electron. Agric. 46 45-70. http://dx.doi.org/10.1016/j.compag.2004.11.001 [ Links ]
GRAYSON RB and BLÖSCHL (2000) Spatial observations and interpolation. In: Grayson R and Blöschl G Spatial Patterns in Catchment Hydrology. Cambridge University Press, Cambridge, UK. 17-50. [ Links ]
HAIMELIN R (2008) Mapping soil water content on agricultural fields using electromagnetic induction report. Helsinki University of Technology, Helsinki. [ Links ]
HE BY, LAI TH, FAN HQ, WANG WQ and ZHENG HL (2007) Comparison of flooding-tolerance in four mangrove species in a diurnal tidal zone in the Beibu Gulf. Estuar. Coast. Shelf Sci. 74 254-262. http://dx.doi.org/10.1016/j.ecss.2007.04.018 [ Links ]
HENDRICKX JMH and KACHANOSKI RG (2002) Nonintrusive electromagnetic induction. In: Dane JH and Topp GC (eds) Methods of Soil Analysis, Part 4. SSSA, Madison, WI. 1297-1306 [ Links ]
HUTCHINGS P and SAENGER P (1987) Ecology of Mangroves. University of Queensland Press, St Lucia. [ Links ]
JIMÉNEZ JA (1990) The structure and function of dry weather mangroves on the Pacific coast of Central America, with emphasis on Avicennia bicolor forests. Estuaries 13 182-192. http://dx.doi.org/10.2307/1351588 [ Links ]
KIFFNEY PM, GREENE CM, HALL JE and DAVIES JR (2006) Tributary streams create spatial discontinuities in habitat, biological productivity, and diversity in mainstem rivers. Can. J. Fish. Aquat. Sci. 63 2518-2530. http://dx.doi.org/10.1139/f06-138 [ Links ]
LESCH SM, RHOADES JD, LUND LJ and CORWIN DL (1992) Mapping soil salinity using calibrated electromagnetic measurements. Soil Sci. Soc. Am. J. 56 540-548. http://dx.doi.org/10.2136/sssaj1992.03615995005600020031x [ Links ]
LOUDA SM (1989) Predation in the dynamics of seed regeneration. In: Leck MA, Parker VT and Simpson RL (eds) Ecology of Soil Seed Banks. Academic Press, New York. 25-52. http://dx.doi.org/10.1016/b978-0-12-440405-2.50008-7 [ Links ]
MAHALL BE and PARK RB (1976) The ecotone between Spartina foliosa Trin. and Salicornia virginica L. in salt marshes of Northern San Francisco Bay: II. Soil water and salinity. J. Ecol. 64 (3) 793-809. http://dx.doi.org/10.2307/2258809 [ Links ]
MAHALL BE and PARK RB (1976c) The ecotone between Spartina foliosa Trin. and Salicornia virginica L. in salt marshes of Northern San Francisco Bay: III. Soil aeration and tidal immersion. J. Ecol 64 (3) 811-819. http://dx.doi.org/10.2307/2258810 [ Links ]
MANSON FJ, LONERAGAN NR and PHINN SR (2003) Spatial and temporal variation in distribution of mangroves in Moreton Bay, subtropical Australia: a comparison of pattern metrics and change detection analyses based on aerial photographs. Estuar. Coast. Shelf Sci. 57 653-666. http://dx.doi.org/10.1016/S0272-7714(02)00405-5 [ Links ]
MARTINEZ G, VANDERLINDEN K, ORDONEZ R andMURIEL JL (2009) Can apparent electrical conductivity improve the spatial characterization of soil organic carbon? Vadose Zone J. 8 586-593. http://dx.doi.org/10.2136/vzj2008.0123 [ Links ]
MCKEE KL (1993) Soil physicochemical patterns and mangrove species distribution - reciprocal effects? Ecology 81 477-487. http://dx.doi.org/10.2307/2261526 [ Links ]
MCKEE KL (1995) Mangrove species distribution and propagule predation in Belize - an exception to the dominance predation hypothesis. Biotropica 27 334-345. http://dx.doi.org/10.2307/2388919 [ Links ]
MCKENZIE RC, CHOMISTEK W and CLARK NF (1989) Conversion of electromagnetic inductance readings to saturated paste extract values in soils for different temperature, texture and moisture conditions. Can. J. Soil Sci. 69 25-32. http://dx.doi.org/10.4141/cjss89-003 [ Links ]
MCNEILL JD (1980) Electromagnetic terrain conductivity measurement at low induction numbers. [ Links ]
MILLS L AND ENGINEERING PLANNING AND SURVEYING SERVICES LTD (1992) Oropouche area development project, middle catchment feasibility study. Ministry of Agriculture, Land and Marine Resources of Trinidad and Tobago. [ Links ]
NITTO DD, NEUKERMANS G, KOEDAM N, DEFEVER H, PATTYN F, KAIRO JG, and DAHDOUH-GUEBAS F (2014) Mangroves facing climate change: landward migration potential in response to projected scenarios of sea level rise. Biogeosciences 11 857-871. http://dx.doi.org/10.5194/bg-11-857-2014 [ Links ]
ODUM WE and MCIVOR CC EDS (1990) Mangroves. In: Myers RL, Ewel JJ (eds) Ecosystems of Florida. University of Central Florida Press, Orlando. [ Links ]
PAINE JG (2003) Determining salinization extent, identifying salinity sources, and estimating chloride mass using surface, borehole, and airborne electromagnetic induction methods. Water Resour. Res. 39 (3) 1059. http://dx.doi.org/10.1029/2001wr000710 [ Links ]
PENNINGS SC and CALLAWAY RM (1992) Salt marsh plant zonation: The relative importance of competition and physical factors. Ecology 73 681-690. http://dx.doi.org/10.2307/1940774 [ Links ]
POLLOCK MM, NAIMAN RJ and HANLEY TA (1998) Plant species richness in Riparian wetlands-A test of biodiversity theory. Ecology 79 94-105. [ Links ]
POOL DJ, SNEDAKER SC and LUGO AE (1977) Structure of mangrove forest in Florida, Puerto Rico, Mexico, and Costa Rica. Biotropica 9 195-212. http://dx.doi.org/10.2307/2387881 [ Links ]
POSTMA H, MANUELS MW and ROMMETS JW (1976) Breakdown and production of fluorescent substances in Dutch waters. Neth. J. Sea Res. 10 499-516. http://dx.doi.org/10.1016/0077-7579(76)90025-9 [ Links ]
RABINOWITZ D (1978) Dispersal properties of mangrove propagules. Biotropica 47-57. http://dx.doi.org/10.2307/2388105 [ Links ]
RAMSUNDAR H (2005) The distribution and abundance of wetland ichthyofauna, and exploitation of the fisheries in the Godineau Swamp, Trinidad - case study. Rev. Biol. Trop. 53 11-23. [ Links ]
RHOADES JD, LESCH PJ, SHOUSE PJ and ALVES WJ (1989) New calibrations for determining soil electrical conductivity-Depth relations from electromagnetic measurements. Soil Sci. Soc. Am J. 53 74-79. http://dx.doi.org/10.2136/sssaj1989.03615995005300010014x [ Links ]
RHOADES JD, CHANDUVI F and LESCH S (1999) Soil salinity assessment - methods and interpretation of electrical conductivity measurements. FAO Irrigation and Drainage Paper 57. FAO, Rome. [ Links ]
SLAVICH PG and PETTERSON GH (1990) Estimating average root zone salinity from electromagnetic induction (EM-38) measurements. Aust. J. Soil Res. 28 453-463. http://dx.doi.org/10.1071/SR9900453 [ Links ]
SMITH III TJ, CHAN HT, MCIVOR CC and ROBBLEE MB (1989) Comparisons of seed predation in tropical, tidal forests from three continents. Ecology 70 (1) 146-151. http://dx.doi.org/10.2307/1938421 [ Links ]
SMITH TJ III (1992) Forest structure. In: Robertson AI and Alongi DM (eds) Tropical Mangrove Ecosystems. American Geophysical Union, Washington DC. 101-136. http://dx.doi.org/10.1029/ce041p0101 [ Links ]
SNEDAKER SC (1982) Mangrove species zonation: why? In: Sen DN and Rajpurohit KS (eds) Contributions to the Ecology of Halophytes. Tasks for Vegetation Science Volume 2. Dr W. Junk Publishers, The Hague. 111-125. http://dx.doi.org/10.1007/978-94-009-8037-2_8 [ Links ]
SOTO R and JIMENEZ JA (1982) Analisis fisonomico estructural del manglar de Puerto Soley, La Cruz, Guanascate, Costa Rica. Rev. Biol. Trop. 30 161-168. [ Links ]
THE WATER RESOURCES AGENCY (2001) Integrating the management of watersheds and coastal areas in Trinidad and Tobago. Ministry of the Environment, Trinidad and Tobago. [ Links ]
TRAILL LW, PERHANS K, LOVELOCK CE, PROHASKA A, MCFALLAN S, RHODES JR and WILSON KA (2011). Managing for change: wetland transitions under sea-level rise and outcomes for threatened species. Divers. Distrib. 17 1225-1233. http://dx.doi.org/10.1111/j.1472-4642.2011.00807.x [ Links ]
THOM BG (1967) Mangrove ecology and deltaic geomorphology: Tabasco, Mexico. J. Ecol. 301-343. http://dx.doi.org/10.2307/2257879 [ Links ]
TOMLINSON PB (1986) The Botany of Mangroves. Cambridge University Press, Cambridge, UK. [ Links ]
TRIANTAFILIS J, LASLETT GM and MCBRATNEY AB (2000) Calibrating an electromagnetic induction instrument to measure salinity in soil under irrigated cotton. Soil Sci. Soc. Am. J. 64 1009-1017. http://dx.doi.org/10.2136/sssaj2001.653869x [ Links ]
TRIANTAFILIS J, ODEH IOA and MCBRATNEY AB (2001) Five geostatistical models to predict soil salinity from electromagnetic induction data across irrigated cotton. Soil Sci. Soc. Am. J. 65 869-878. http://dx.doi.org/10.1016/j.compag.2004.11.006 [ Links ]
TRIANTAFILIS J and LESCH SM (2005) Mapping clay content variation using electromagnetic induction techniques. Comput. Electron. Agric. 46 203-237. [ Links ]
UPKONG IE (1997) Mangrove swamp at a saline/fresh water interface near Creak town, South Eastern Nigeria. Catena 29 61-71. http://dx.doi.org/10.1016/S0341-8162(96)00058-6 [ Links ]
WALSH GE (ed) (1974) Mangroves: A Review. Ecology of Halophytes. Academic Press, New York. [ Links ]
WAN Y, WAN C and HEDGEPETH M (2014) Elucidating multi-decadal saltwater intrusion and vegetation dynamics in a coastal floodplain with artificial neural networks and aerial photography. Ecohydrology 8 (2) 309-324. http://dx.doi.org/10.1002/eco.1509 [ Links ]
WILLIAMS BG and FIDDLER F-T (1983) The use of electromagnetic induction for locating subsurface saline material. In: Relation of Groundwater Quantity and Quality. Proceedings of Hamburg Symposium. IAHS Pub. No. 146. 189-196. [ Links ]
WILLIAMS BG and ARUNIN S (1990) Inferring recharge/discharge electrical conductivity profiles using electromagnetic induction areas from multifrequency electromagnetic induction measurements. Soil Sci. Soc. Am. J. 48 288-291. [ Links ]
WOLLENHAUPT NC, RICHARDSON JL, FOSS JE and DOLL EC (1986) A rapid method for estimating weighted soil salinity from apparent soil electrical conductivity measured with an above ground electromagnetic induction meter. Can. J. Soil Sci. 66 315-321. http://dx.doi.org/10.4141/cjss86-032 [ Links ]
Received 27 March 2015
Accepted in revised form 26 May 2016
* To whom all correspondence should be addressed. 051 401 3939; e-mail: melissa.atwell@sta.uwi.edu

