


Services on Demand
Article
 English (pdf)
 Article in xml format
 Article references
Indicators

Related links
-
 Cited by Google
 -
 Similars in Google
Share

 Permalink
Water SA
On-line version ISSN 1816-7950
Print version ISSN 0378-4738
Water SA vol.42 n.1 Pretoria Jan. 2016
http://dx.doi.org/10.4314/wsa.v42i1.14
Potable water use of residential consumers in the Cape Town metropolitan area with access to groundwater as a supplementary household water source
T Wright; HE Jacobs*
Department of Civil Engineering, Stellenbosch University, Private Bag X1, Matieland, 7602, South Africa
ABSTRACT
The potable water use recorded by 3 579 residential consumer water meters in Cape Town, South Africa, was analysed as part of this research. The focus was on selected residential properties in serviced areas, with additional private access to groundwater as a supplementary household water source. Private consumers in South Africa are not normally required to report on, or meter, groundwater use. The research team analysed records of an extensive, compulsory registration process for supplementary on-site water sources that was introduced by the City of Cape Town during the prolonged drought between 2004 and 2005. The main objective of this research was to determine the average annual water demand of residential properties serviced via the potable water distribution system, with additional registered access to a supplementary on-site groundwater source. Geo-referencing was employed to determine the approximate coordinate of each property, with subsequent one-by-one verification of each address. The data set initially contained 4 487 properties, but after filtering and verification 3 579 consumers remained in the data set for further analyses. The unique property code was identified for each verified property in order to link the attributes of consumers with access to on-site groundwater sources to their corresponding water meter records, so that the potable water demand for these stands could be analysed. The annual average water demand of the properties was subsequently obtained and analysed for two separate periods, namely, 2010 and 2014. The water use, categorised according to stand size, was similar for both periods. The results showed that consumers with access to groundwater used only about 65% of the estimated average annual water demand when compared to applicable water demand guidelines.
Keywords: groundwater, garden borehole, residential, water demand
INTRODUCTION
Some earlier studies (Garlipp, 1978; Simpson, 1990; Elphinstone and Van der Linde, 1990; Maclear, 1995) have addressed the issue of private groundwater use and culminated in a limited body of literature. The key motivation behind this research was to gain insight into municipal water consumption by residential properties where groundwater is used as supplementary water source in view of improved future planning of water services. The two main objectives of this study were to assess the spatial distribution of private groundwater use in terms of the number of properties, where such use was registered, and to determine the average annual daily water demand (AADD) from the water distribution system of the corresponding properties, based on consumer water meter readings.
A personal on-site household water source is a supplementary water source to piped municipal supply for residential consumers (Jacobs et al., 2011). Such sources would be privately owned, installed, managed, operated and maintained by the home owner, or occupant. The commissioning and application of supplementary household water sources by private home owners are often drought-driven (Jacobs, 2010). Definitions of groundwater abstraction points used elsewhere are ambiguous, with the term 'garden boreholes' used by Saayman and Adams (2001) considered the most descriptive. The term groundwater abstraction point (GAP) coined by Wright and Jacobs (2010) was adopted in this manuscript to describe any type of structure for groundwater abstraction on a residential stand. The type of GAP was not considered to be important in view of the research objectives and would include relatively deep garden boreholes, shallower well-points and even hand-dug wells. Privately-owned GAPs investigated in this study would have been installed without the knowledge of the local authority prior to the registration process referred to in this paper.
The application of a supplementary water source by a residential consumer would have an impact on the potable water distribution system. The supply of groundwater for garden irrigation from private GAPs would reduce peak flows and the average potable water demand from the water distribution system. The first study addressing the matter of private groundwater use in South African residential areas (Garlipp, 1978) was conducted in the period 1970 to 1977. The sample from the summer-rainfall region of the country comprised a consumer survey of 10 627 properties, of which 1 237 (11.6%) reflected borehole ownership. Garlipp (1978) reported that groundwater was used mainly for garden irrigation.
According to Gebhardt (1975), the rate of evapotranspiration, which varies from one region to the next, is a notable driver of garden water demand. The hot and dry weather conditions during summer months in the Western Cape, accompanied by a high evapotranspiration rate and relatively low rainfall, mean that water demand for irrigation purposes is relatively high during summer. According to Colvin and Saayman (2007), many Cape Town consumers installed GAPs during the water restrictions imposed in 2004 and 2005. Colvin and Saayman (2007) also conducted a consumer survey to establish motives for groundwater use and reported that the most common motive was to consistently maintain a luscious garden without the implication of a high water bill. The water restrictions imposed by the City of Cape Town during 2004 and 2005 prohibited the use of potable water from the water distribution system for garden irrigation during certain times of the day. However, consumers with access to a supplementary household water source were not compelled to comply with the outdoor water restrictions.
At the time, this necessitated the City of Cape Town to initiate an extensive process whereby consumers with access to supplementary water sources were urged to register these against the physical street addresses and plot numbers of the particular properties. Subsequently, the private use of supplementary water sources during the period of water restrictions was only permitted at registered properties. The intention of the registration process was to manage potable water use effectively during the restrictions and not to bill consumers for the groundwater use.
The majority of GAPs were registered during the 12 months between the end of 2004 and 2005, which coincided with notable (Level 2) water restrictions. The water restrictions were eventually called off midway through 2006 and subsequently, the registration process was abandoned as well. Although the City of Cape Town resumed the initiative to register private supplementary water sources again in 2011, the more recent registration data remained partial and confidential at the time of this research.
METHODOLOGY
The research methodology involved the following primary components: (i) a comprehensive literature review was conducted; (ii) properties that registered groundwater use as a private supplementary water source were identified; (iii) spatial characteristics of registered properties were lifted from the data set, categorised and verified; and (iv) verified records were analysed in terms of water use and stand size.
Limitations and assumptions
It was beyond the scope of this study to meter the flow rate or measure the volume of groundwater used at any of the abstraction points. Also, identification of end-uses for application of groundwater and evaluation of groundwater quality and treatment were considered beyond the scope of this study. Limited consumer surveys conducted earlier in South Africa (Jacobs et al., 2011) suggested that garden irrigation was the most common application point for non-potable groundwater.
The research team appreciated the fact that many consumers with access to private groundwater may have been secretive or reluctant to disclose information, in line with earlier reports in Pretoria (Simpson, 1990) and Port Elizabeth (Lomberg et al., 1996). It is likely that more residential stands with GAPs are situated in the Cape Town study area than those identified in this study, because all consumers would not necessarily have registered the supplementary sources. Non-GAP users could not be accurately identified to act as a reference group for comparison of results, because physical inspection of properties was not conducted due to ethical, financial and practical constraints.
This study was based on the following key assumptions to allow for the processing and analysis of the available data:
• Consumers who registered GAPs as part of the official registration process did so honestly and correctly identified their locations by recording verifiable street addresses.
• It was considered appropriate to assume that groundwater was actually used by consumers who registered a GAP and also that all GAPs registered have remained operative since registration. The typical life expectancy of a GAP is 20 years, after which maintenance to the pump seal and bearings may be required to prolong operation (Wright, 2013).
Study area
Cape Town is the second largest metropolitan area in South Africa with a population of about 4 million (Statistics South Africa, 2011). Cape Town is situated in a winter rainfall region, typified by hot and dry summers with corresponding peak garden water demand. Droughts in the Cape normally occur in summer, with the water demand-supply imbalance exacerbated by relatively high demand for garden watering. Water restrictions, which mainly targeted outdoor water use, were imposed across the entire City of Cape Town municipal area during the last prolonged drought, between 2004 and 2005 (Jacobs et al., 2007). A corresponding compulsory registration programme for private supplementary water sources was introduced by the City of Cape Town at the time.
The Cape Town metropolitan area is largely underlain by the extensive primary, unconfined Cape Flats aquifer unit with significant groundwater exploitation potential (Maclear, 1995; Wright and Conrad, 1995). The unconsolidated sand and relatively shallow water table provide ideal conditions for small-scale groundwater abstraction by private home owners. Several home owners in the Cape Town area have capitalised on this over the years and utilise groundwater to supplement potable water supplied from the water distribution system - despite the initial personal expense to install, operate and maintain a garden borehole or wellpoint. The non-potable groundwater is used mainly for garden irrigation (Jacobs et al., 2011).
Data processing
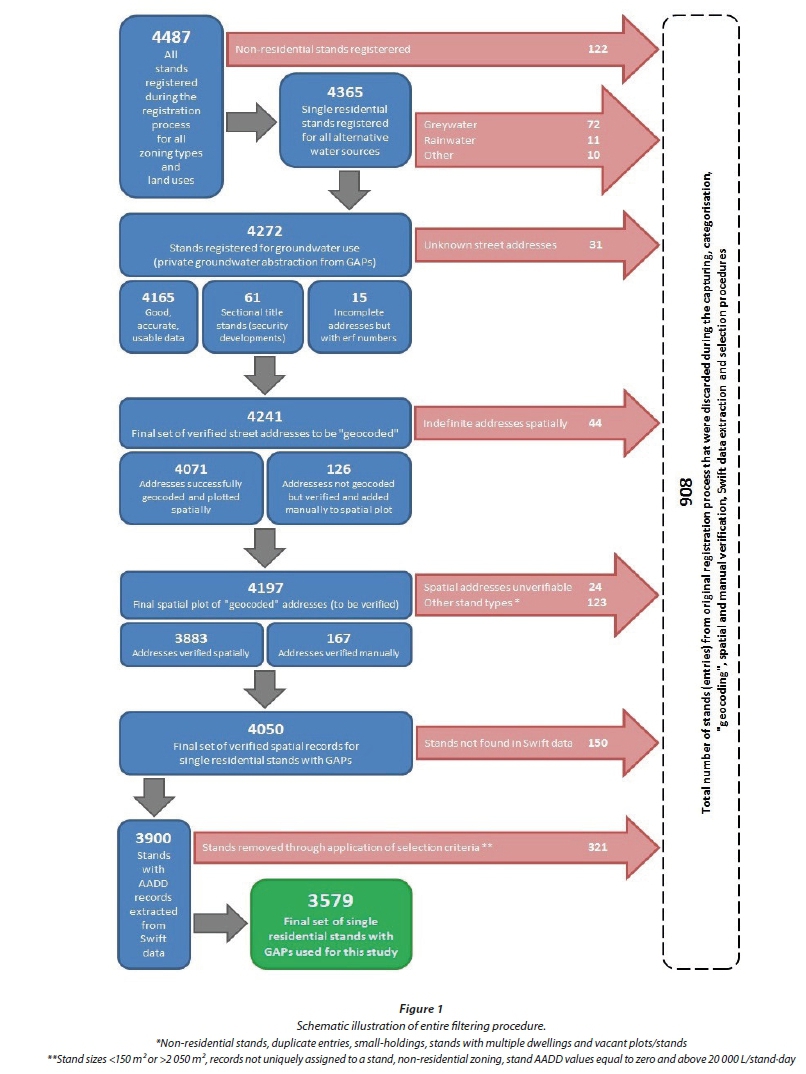
Wright and Jacobs (2010) presented a description of the method used to manually capture, verify, categorise and organise all records from the original registration process. The data was geo-coded, plotted spatially and verified as part of this project. All properties that could not be identified spatially were investigated and verified manually, before each address was linked with the relevant spatial attributes, such as stand size, position (global coordinates) and a unique property code.
A total of 4 487 registration records were initially captured, of which 4 241 residential street addresses could be verified, geo-coded and spatially identified. The geo-coded addresses were subsequently filtered to produce a set of 4 050 records pertaining to single residential properties with registered GAPs. Each of these records contained the property code and stand size, as well as the global coordinates of the property's cadastral polygon shape centre.
Water consumption data
The AADD is commonly used as explanatory variable in South Africa for demand estimation (Jacobs et al., 2013; Van Zyl et al., 2008; Jacobs et al., 2004; CSIR, 1983). In line with other research projects on water use, the AADD for each property was extracted and verified with a commercial software suite called Swift - a process described by Jacobs and Fair (2012). Swift uses water meter readings of the 12 months prior to the extraction date to calculate the AADD of a property.
Two sets of AADD values were obtained for each property in the sample: (i) 1 May 2010 to 30 April 2011 and (ii) 1 September 2013 to 31 August 2014. Both record periods extended over 12 months and thus included a full summer season. These two periods are subsequently referred to in this paper as 2010 and 2014 respectively.
The water consumption records for each of the 4 050 spatially verified properties were extracted via Swift for 2010 and 2014, based on the unique code for each property. The two water consumption data sets were compared and only those properties with water consumption data for both 2010 and 2014 were selected, leaving a total of 3 900 properties with true AADD values.
Filtering procedure
A stringent query, partly adopted from Jacobs et al. (2004), was applied to the 3 900 extracted records for both periods to exclusively select those records that fulfilled the filter criteria shown in Table 1.

The records that fell outside the focus of this study were filtered out and removed from the data sets, leaving a final set of 3 579 records for analysis. A schematic presentation of the filtering process, showing the number of records that survived each step and those that were discarded, is presented in Fig. 1.
RESULTS AND DISCUSSION
Stand size classes
The estimation of AADD in South Africa has relied on models with stand size as the single explanatory variable (Van Zyl et al., 2008; Jacobs et al., 2004; CSIR, 1983). These relatively robust models have found fond application in civil engineering practice over the past few decades. It was considered appropriate to conduct the analyses of water demand in this research with stand size as the single explanatory variable. The data were divided into 19 equally-sized class intervals with a range of 100 m2, based on earlier work by Jacobs et al. (2004). The centre value of each size class was used as plotting position, for example, 1 000 m2 represented the range from 950 to 1 050 m2.
Spatial distribution
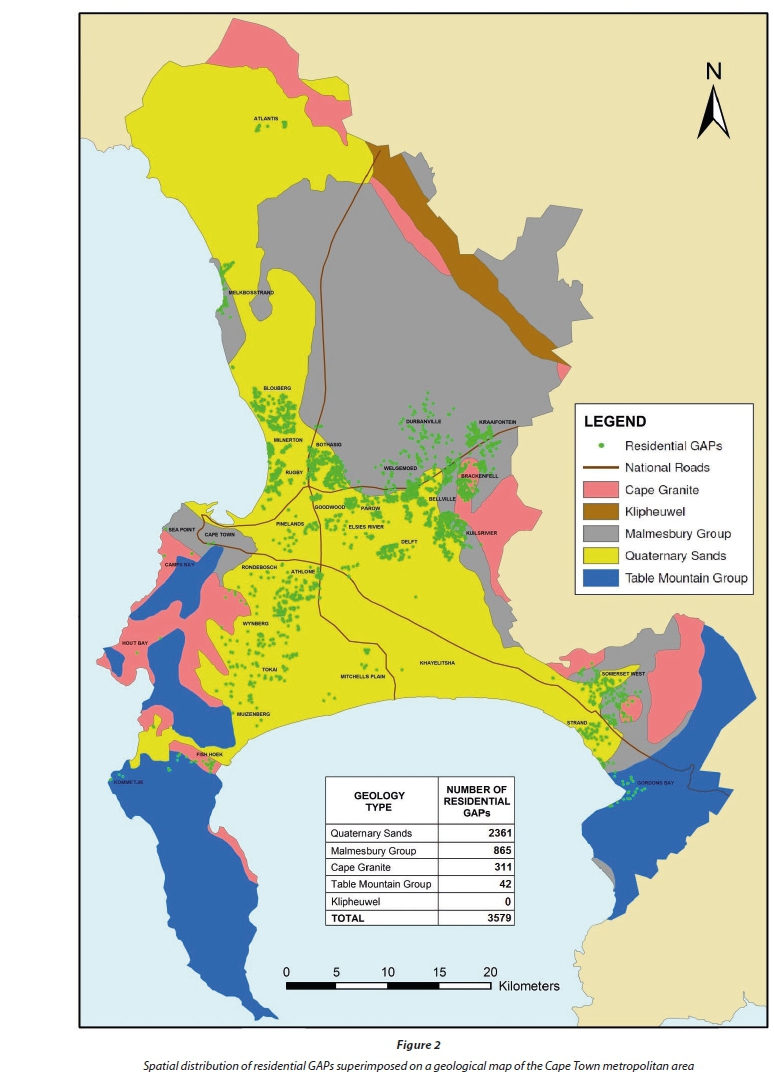
In addressing the first objective, it was necessary to investigate the spatial distribution of residential properties with GAPs. Severe clustering of properties would for example have a more notable localised impact on the water distribution system than the case would be if the properties were evenly spread out. The selected records were superimposed on a simplified geological map of the Cape Town metropolitan area by Council for Geoscience (2013), as presented in Fig. 2.
The GAP distribution is clearly clustered in certain areas with a complete absence of GAPs in other areas. The following two observations were made:
• The underlying geology in the areas with a high density of GAPs consisted mostly of quaternary sands (±66% of the properties with GAPs) and the Malmesbury Group (±24%), which equates to about 90% of all verified properties with GAPs located on these two geology types.
• Virtually no GAPs were located in some residential areas on the same geology. These under-represented regions Future research into the location, spatial distribution and clustering of stands with GAPs could be valuable in terms of explaining these phenomena. With the data at hand, no further progress could be made in explaining the spatial attributes.
Water consumption
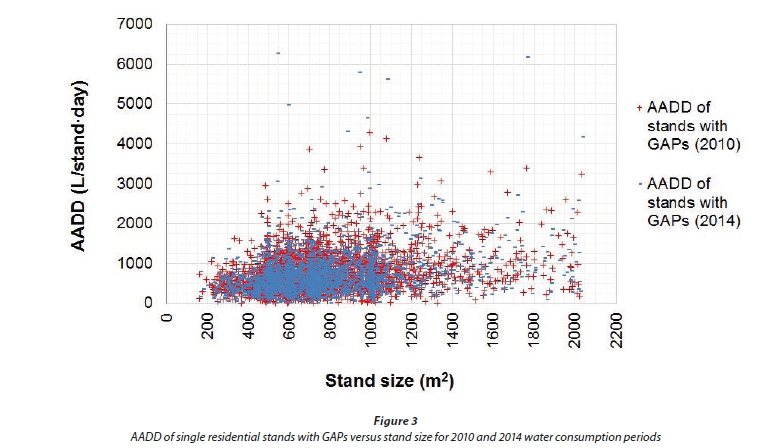
The average AADD for all stands with GAPs in the data set was 715 L/stand-day and 681 L/stand-day for the 2010 and 2014 periods, respectively. A relatively low potable water use could be expected for consumers with access to a private supplementary water source. Earlier studies (Jacobs et al., 2013; Van Zyl et al., 2008) reported positive correlation between stand size and AADD. The AADD for each property was plotted against the corresponding stand size, as shown in Fig. 3.
The results in Fig. 3 show notable scatter, especially for larger stand sizes which is in line with variation in water demand for individual residential stands reported by Jacobs et al. (2004). About 5% of all properties in the sample reported an AADD < 250 L/stand-day for 2010 and 2014, while the water use of nearly 27% of the properties was less than 500 L/stand-day.
A summary of the results is presented in Table 2. The table includes the number of records analysed per stand size class, the actual AADD values for the 2010 and 2014 periods and the estimated AADD values for the corresponding stand sizes based on two recent guidelines. The actual AADD of stands with GAPs was calculated as a percentage of the estimated AADD and included in the last column. The results show relatively low AADD values for all stand size classes when compared to recent guidelines for estimating domestic water demand (Jacobs et al., 2004; Van Zyl et al., 2008), as could be expected for residential properties where supplementary water sources were used.

The guideline by Jacobs et al. (2004) for coastal winter rainfall regions was considered the most appropriate for comparison and was used for this purpose. The guideline by Van Zyl et al. (2008), represented by the 50% confidence limit of the single variable regression model, was also used, although it does not present a regional curve for the Western Cape winter rainfall region. The water use data from the 2014 period, being more recent than that of the 2010 period, were used to calculate the percentages in the last column.
With reference to Table 2 and the actual AADD of stands with GAPs for the 2014 period, as compared to published guidelines, it is apparent that the water use of consumers with GAPs is lower than estimated AADD values for all stand size classes.
The average percentage for all categories, 200 m2 to 2 000 m2, is 65.3%, meaning that on average these consumers report about 65% of the potable water use compared to the expected values according to the most applicable guideline. The percentage per stand size category ranged from as low as 53% to a maximum of 84%, suggesting that consumers at stands with GAPs use less potable water from the municipal distribution system than would be expected.
It was not possible to compare the results to a valid reference group of non-GAP users due to various limitations, as explained earlier. However, the guideline used as comparison was derived from consumer water meter data. In other words, the annual potable water consumption recorded by consumer water meters at stands with GAPs was, on average, about 65% of the estimated AADD for similarly-sized properties.
The mean AADD value for each stand size class was plotted against the centre value of the stand size class, as shown in Fig. 4. A trend of increasing water use with increased stand size is evident, in line with earlier reports of residential water demand as a function of stand size (Jacobs et al., 2004; Van Zyl et al., 2008). Figure 4 also presents the percentage of the actual AADD per stand size category for the 2014 period, as compared to the guideline by Jacobs et al. (2004).
A single GAP could supply the water demand for an entire residential property based on estimates of GAP yield by Jacobs et al. (2011). However, due to household plumbing complexities and water quality concerns, GAPs are commonly used exclusively to meet outdoor needs only, mainly garden irrigation. Residential properties with GAPs use markedly less water from the municipal water distribution system, based on average annual data, than AADD values derived from local guidelines. It would be safe to assume that the finding would be more pronounced in the summer season, when most of the outdoor use such as garden irrigation takes place.
Water meter readings often form the basis of research into water use, such as was the case with recently published AADD-guideline studies (Jacobs et al., 2004; Husselman and Van Zyl, 2006; Van Zyl et al., 2008). Residential stands with GAPs report an artificially reduced consumption from the potable water distribution system. The water consumption recorded at the municipal consumer meter would therefore be lower than that required to sustain the actual level of water use on the property.
CONCLUSION
This research was based on analysis of records from 3 579 properties that registered groundwater as a private supplementary water source with the service provider, City of Cape Town, during the prolonged drought from 2004 to 2005. In total, 4 487 properties registered a supplementary water source, but 908 of these records were filtered out. This research confirmed that residential stands with GAPs were clustered spatially and that these consumers used less potable water than expected, based on the most recent regional guidelines for estimating average annual water demand.
The spatial distribution of residential GAPs corresponded mainly to two types of underlying geology. Almost 90% of all reported GAPs were located on quaternary sands or the Malmesbury Group, which could be expected as these are typically viewed as being relatively suitable aquifers for shallow groundwater abstraction. Future research into the links between the spatial distribution of private GAPs and (i) underlying geology as well as (ii) socio-economic consumer profiles would help to better understand the clustering of private groundwater users.
The AADD per stand size category confirmed an increasing AADD with increasing stand size in line with earlier reports of AADD variation with stand size for residential properties in general. However, the potable water supplied via the water distribution system to stands with GAPs was lower, over the entire stand size range, than expected values based on estimates from guidelines for residential water demand in South Africa. The annual potable water consumption recorded by consumer water meters at stands with GAPs was about 65% of, or 35% lower than, the estimated AADD for similarly-sized properties.
Future research should include the following: (i) assessment of temporal variation in GAP use, since seasonal fluctuations in groundwater use for garden watering could be expected to impact summer peak water use more notably than winter use -particularly in the study area with wet winters and dry summers; (ii) expanding the work to include site visits, which would enable researchers to confirm the presence, use or absence of GAPs, thus allowing for a valid reference group comprising non-GAP users; (iii) detailed spatial analysis of clustering of private GAPs in terms of underlying geology and socio-economic profile; and (iv) identification and grouping of reference stands with and without GAPs located in the same areas so as to compare the AADD of both groups based on stand size.
ACKNOWLEDGEMENTS
The authors, one of whom was employed by the City of Cape Town at the time of writing, would like to express their gratitude to the City of Cape Town for collaborating with Stellenbosch University on this research project. In particular, the authors would like to thank Messrs. J Potgieter, J de Bruyn and D de Witt and also Mmes. K Fair and T Mtsabe for their valuable inputs.
REFERENCES
CSIR (1983) Guidelines for the provision of engineering services in residential townships, The Blue Book. Compiled for the Department of Community Development by the Council for Scientific and Industrial Research. CSIR, Pretoria. [ Links ]
COLVIN C and SAAYMAN I (2007) Challenges to groundwater governance: A case study of groundwater governance in Cape Town, South Africa. Water Polic. 9 (S2) 127-148. [ Links ]
COUNCIL FOR GEOSCIENCE (2013) RSA 1:1 000 000 Geological Data. Council for Geoscience, Pretoria. URL: http://www.geoscience.org.za/index.php/component/content/article?id=386:downloadable-maps-documents-and-files (Accessed 30 January 2013). [ Links ]
ELPHINSTONE C and VAN DER LINDE NJ (1990) Estimating the annual quantity of groundwater abstracted in the Pretoria municipal area and its effect on municipal water consumption. Addendum to WRC Report No. 211/1/90. Water Research Commission, Pretoria. [ Links ]
GARLIPP KDCO (1978) Water consumption patterns in urban areas. Master's thesis, University of Pretoria, South Africa. [ Links ]
GEBHARDT DS (1975) Effects of pressure on domestic water supply including observations on effect of limited garden-watering restrictions during periods of high water demand. Water SA 1 (1) 3-8. [ Links ]
HUSSELMAN ML and VAN ZYL JE (2006) Effect of stand size and income on residential water demand. J. S. Afr. Inst. Civ. Eng. 48 (3) 12-16. [ Links ]
JACOBS HE, SCHEEPERS HM and SINSKE SA (2013) Effect of land area on average annual suburban water demand. Water SA 39 (5) 687-694. http://dx.doi.org/10.4314/wsa.v39i5.13 [ Links ]
JACOBS HE and FAIR KA (2012) A tool to increase information-processing capacity for consumer water meter data. S. Afr. J. Inf. Manage. 14 (1) 1-7. http://dx.doi.org/10.4102/sajim.v14i1.500 [ Links ]
JACOBS HE, WRIGHT T, LOUBSER C, DU PLESSIS JA and KOCK J (2011) Strategic assessment of household on-site water as supplementary resource to potable municipal supply - current trends and future needs. WRC Report No. 1819/1/10. Water Research Commission, Pretoria. [ Links ]
JACOBS HE (2010) Assessing the impact of personal on-site water resources in serviced residential areas on water demand and wastewater flow. Proc. Water Institute of Southern Africa Biennial Conference, 18-22 April 2010, Durban, South Africa. [ Links ]
JACOBS HE, FAIR K, GEUSTYN LC, DANIELS J and DU PLESSIS JA (2007) Analysis of water savings: A Case study during the 2004-2005 water restrictions in Cape Town. J. S. Afr. Inst. Civ. Eng. 49 (3) 16-26. [ Links ]
JACOBS HE, GEUSTYN LC, LOUBSER BF and VAN DER MERWE B (2004) Estimating residential water demand in southern Africa. J. S. Afr. Inst. Civ. Eng. 46 (4) 2-13. [ Links ]
LOMBERG CR, ROSEWARNE PN, RAYMER DA and DEVEY DG (1996) Research into groundwater abstraction in the Port Elizabeth municipal area. WRC Report No. 515/1/97, Water Research Commission, Pretoria. [ Links ]
MACLEAR LGA (1995) Cape Town needs groundwater - a note on the potential of the Cape Flats aquifer unit to supply groundwater for domestic use in the Cape Town Metropolitan Area. Technical Report Gh3868. Directorate Geohydrology, Department of Water Affairs and Forestry, Pretoria. [ Links ]
SAAYMAN IC and ADAMS S (2001) The use of garden boreholes in Cape Town, South Africa: Lessons learnt from Perth, Western Australia. Proceedings of the 2nd WARFSA WaterNet Symposium on Integrated Water Resources Management: Theory, Practice, Cases, 30-31 October 2001, Cape Town. [ Links ]
SIMPSON GC (1990) Research into groundwater abstraction in residential areas. WRC Report No. 211/1/90, Water Research Commission, Pretoria. [ Links ]
STATISTICS SOUTH AFRICA (2011) South African National Census of 2011. Statistics South Africa, Pretoria. [ Links ]
VAN ZYL HJ, ILEMOBADE AA and VAN ZYL JE (2008) An improved area-based guideline for domestic water demand estimation in South Africa. Water SA 34 (3) 381-391. [ Links ]
WRIGHT A and CONRAD J (1995) The Cape Flats aquifer current status. Report No. 11/95, Groundwater Programme, Watertek, CSIR. Council for Scientific and Industrial Research, Stellenbosch. [ Links ]
WRIGHT T and JACOBS HE (2010) Methodology for identifying, verifying and assessing groundwater use in serviced residential areas of the Cape Peninsula. Proc. Water Institute of South Africa Biennial Conference, 18-22 April 2010, Durban, South Africa. [ Links ]
WRIGHT T (2013) Water demand of selected residential properties with access to groundwater in serviced areas of the Cape Peninsula. Master's Thesis, Stellenbosch University, South Africa, http://scholar.sun.ac.za/handle/10019.1/79954 (Accessed 17 September 2013). [ Links ]
Received: 17 February 2015
Accepted in revised form 20 November 2015
* To whom all correspondence should be addressed.+27 21 808 4059, Fax: +27 21 808 4351; e-mail: hejacobs@sun.ac.za

