


Servicios Personalizados
Articulo
 Inglés (pdf)
 Articulo en XML
 Referencias del artículo
Indicadores

Links relacionados
-
 Citado por Google
 -
 Similares en Google
Compartir

 Permalink
Water SA
versión On-line ISSN 1816-7950
versión impresa ISSN 0378-4738
Water SA vol.42 no.1 Pretoria ene. 2016
http://dx.doi.org/10.4314/wsa.v42i1.13
Model simulations of rainfall over southern Africa and its eastern escarpment
Zane DedekindI, *; Francois A EngelbrechtI, II; Jacobus van der MerweI
ICSIR Natural Resources and the Environment - Climate Studies, Modelling and Environmental Health, PO Box 395, Pretoria, 0001, South Africa
IIUnit for Environmental Sciences and Management, North-West University, Potchefstroom, 2520, South Africa
ABSTRACT
Rainfall simulations over southern and tropical Africa in the form of low-resolution Atmospheric Model Intercomparison Project (AMIP) simulations and higher resolution National Centre for Environmental Prediction (NCEP) reanalysis downscalings are presented and evaluated in this paper. The model used is the conformal-cubic atmospheric model (CCAM), a variable-resolution global atmospheric model. The simulations are evaluated with regards to rainfall totals, spatial distribution, seasonality and inter-annual variability. Since both Global Circulation Models (GCMs) and Regional Climate Models (RCMs) are known to have relatively large biases and shortcomings in simulating rainfall over the steep eastern escarpment of southern Africa and in particular Lesotho, the paper has a focus on evaluating model performance over these regions. It is shown that in the reanalysis simulations the model realistically represents the seasonal cycle in rainfall. However, the AMIP simulations are prone to the model overestimating rainfall totals in spring. The spatial distribution of rainfall is simulated realistically; however rainfall totals are significantly overestimated over the escarpment areas of both southern Africa and East Africa. When nudged within the observed circulation patterns of the reanalysis data, the model is capable of realistically simulating inter-annual rainfall variability over the eastern parts of southern Africa.
Keywords: CCAM; conformal-cubic atmospheric model; inter-annual rainfall variability; model simulations; eastern escarpment
INTRODUCTION
Rainfall over southern and tropical Africa
Southern and tropical Africa (STA) are prone to the occurrence of droughts and floods (e.g. Mason and Joubert, 1997; Rouault and Richard, 2003; Lyon and DeWitt, 2012), which constitutes a highly variable climate. The driving mechanisms of this variability include the El Nino Southern Oscillation (ENSO) and regional sea surface temperatures (SSTs) (e.g. Reason and Mulenga, 1999; Landman and Beraki, 2010). The STA region is also marked by pronounced seasonality in rainfall. Tropical West Africa receives up to 7.5 mm/day during August, but for the November-April period yields are as low as 1mm/day. Over Central Africa two rainfall peaks occur, one during November (7.5 mm/day) and another during March (6 mm/day) (Hernandez-Diaz et al., 2013). East Africa's rainfall peaks during January at 6mm/day (Nikulin et al., 2012). The seasonality of rainfall in tropical Africa is driven by the meridional displacements of the Inter Tropical Convergence Zone (ITCZ). During the austral summer when the ITCZ is displaced to the south of the equator, north-easterly flow of low-level moisture takes place around the Indian Ocean High (IOH) into southern Africa (here defined as Africa south of 15°S), forming a convergence zone in combination with the Angola Low (Reason et al., 2006). This region is referred to as the South Indian Convergence Zone, and is associated with the formation of tropical-temperate cloud bands (Taljaard 1986; Walker and Lindesay, 1989; D'Abreton and Tyson, 1995; Todd et al., 2004, Hart et al., 2010). This results in southern Africa being largely a summer rainfall region, with the exception of the south-western Cape and the Cape south coast regions. Moreover, the southern African region exhibits a strong west to east rainfall gradient, especially in South Africa from the Northern Cape in the west to Lesotho in the east (Jury, 2012). Another key feature of the southern African rainfall climatology is the dry slot that extends zonally from southern Namibia over Botswana into the Limpopo river basin of Zimbabwe, South Africa and Mozambique (e.g. Engelbrecht et al., 2002; Engelbrecht et al., 2009).
Rainfall-producing systems of southern Africa
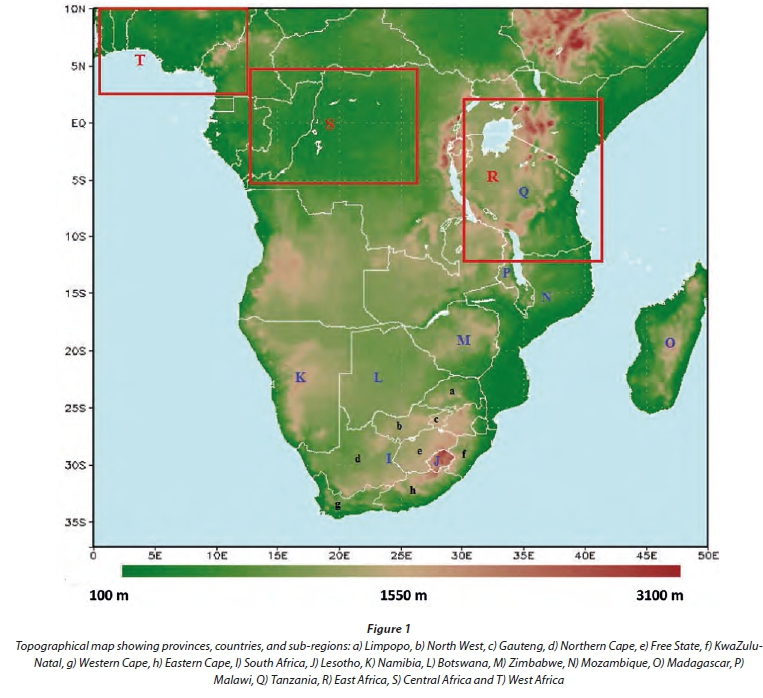
During the austral winter months (June-August) the subtropical high-pressure belt is situated over southern Africa, enforcing large-scale subsidence and suppressing rainfall. This high-pressure belt has a blocking effect on cold fronts, preventing these systems from sweeping over the biggest part of the subcontinent. It is only the southern extremes of the south-western Cape and Cape south coast of South Africa where cold fronts regularly bring winter rainfall. The prevailing pattern in summer is very different as the high-pressure belt is shifted southward and a broad continental trough deepens in lower levels (Tyson and Preston-Whyte, 2000). It is during the summer half-year (October to March) that southern Africa receives the bulk of its rainfall. Most of the rain (about 60%) occurs from tropical-temperate troughs (TTTs) (Harrison, 1984), between spring and autumn. Another important rainfall-producing system is the cut-off low (COL). These systems also receive the bulk of their moisture from the tropics (D'Abreton and Tyson, 1996; Taljaard, 1986), even though they are defined as cold-core depressions of the upper westerlies that deepen to form closed circulations extending to the surface (Tyson and Preston-Whyte, 2000). COLs are often heavy rain- and flood-producing systems, especially over the central interior of South Africa and the south and east coast. They peak in frequency during the transition seasons of autumn and spring (Tyson, 1986; Mason and Jury, 1997). The reader is referred to Reason et al. (2006) and Hart et al. (2010) for more comprehensive discussions of the different synoptic types occurring over southern Africa, including maps showing their typical geographical locations (Fig. 1).
Rainfall over the eastern escarpment of South Africa and Lesotho
In southern Africa cumulus convection is the foremost rainfall-producing process. The dynamics of severe storms are very complicated as they are controlled by the interactions of cloud microphysical processes, meso-scale forcing, diurnal heating and synoptic conditions. Southern Africa has a steep eastern escarpment that peaks in the Maluti Mountains of Lesotho, reaching altitudes of more than 3 km (Engelbrecht et al., 2002). The eastern escarpment region exhibits high annual rainfall totals and often sees the occurrence of deep convection. This, in turn, is the result of complex meso-scale circulation patterns that occur over the region in response to synoptic-scale circulation forcing and topographic forcing.
The development of meso-scale convective complexes (MCCs) occurs under conditions of high moisture content and instability from the surface up to 700 hPa, warm advection and strong surface convergence. MCCs, which are one of several types of meso-scale convective systems (MCSs), around the world are linked to large mountain ranges, such as the Rockies in the United States (e.g. Ashley et al., 2003) and the Andes in South America (e.g. Durkee and Mote, 2009). Over the eastern escarpment MCCs are often triggered by the topographical gradients, while already existing MCSs have the potential to create meso-scale convective vortices over the region (Laing and Fritsch, 1993a; Blamey and Reason, 2009).
At larger spatial scales the eastern escarpment of South Africa and Lesotho interacts with westerly wave propagation and its associated low-level flow. The latter typically consists of a ridging high-pressure system and south-easterly flow (Tyson and Preston-Whyte, 2000), which through topographic lift along the eastern escarpment and westerly wave dynamics lead to the strong ascent of moist air. This synoptic-scale pattern often leads to the development of strong convective storms along the escarpment (Garstang et al., 1987) and contributes to this region being the location of the rainfall maximum over southern Africa (De Coning et al., 1998). That is, the steep topographic gradients induce a steep west-east gradient in rainfall over eastern South Africa (Engelbrecht and Rautenbach, 2000).
Rainfall modelling
Simulating rainfall still proves to be a challenge for Global Circulation Models (GCMs) and Regional Climate Models (RCMs), especially with regards to the diurnal cycle in convective rainfall, due to biases in the intensity, timing and frequency of precipitation during the day (e.g. Shin et al., 2007; Da Rocha et al., 2009; Jeong et al., 2010). An important reason for this situation is that models are generally still applied at relatively coarse resolutions where convection is not explicitly resolved. This forces models to use convective parameterisation schemes, that is, the statistical treatment of convection, which currently seems to be inadequate to represent the diurnal cycle and even convective rainfall totals (e.g. Liang et al., 2004).
Through the Coordinated Regional Downscaling Experiment (CORDEX) the simulations of African precipitation using 10 RCMs on various temporal resolutions have been analysed (Nikulin et al., 2012). Consistent with the findings described above, the realistic representation of the diurnal cycle of precipitation was identified as a major challenge for the RCMs applied over Africa. The currently inadequate simulations seem to be largely the result of the convection parameterisation schemes not realistically representing the convective cycle. However, the RCMs are capable to represent key aspects of the seasonal cycle in rainfall over Africa well (Nikulin et al., 2012), although some models simulate the onset of summer rainfall over southern Africa too early (Nikulin et al., 2012; Sylla et al., 2010).
Zang et al. (2012) showed the differences between reanalyses data sets obtained using different convection schemes and different spatial resolutions over STA. These simulations yielded large overestimations of rainfall over the Great Rift Valley (compared to observations). In fact, models generally overestimate rainfall totals over East Africa and the eastern parts of southern Africa (e.g. Engelbrecht et al., 2009). All ten CORDEX RCMs of Nikulin et al. (2012) overestimate rainfall over the eastern escarpment region of southern Africa.
A noteworthy point from Zang et al. (2012) is that the model that had the highest horizontal resolution (about 38 km), shows the best resemblance to the observed data. The higher resolution also aided in capturing land-based convergence zones over Lake Malawi and Madagascar, and the representation of the intra-annual rainfall cycle was also improved. Models applied at 50 km resolution over Africa show increased biases over Madagascar and countries between the equator and 10°S during summer (Hernandez-Diaz et al., 2013). Thus, the simulation of a number of attributes of the rainfall climatology over southern Africa may be improved through increased model resolution.
The biases exhibited in representing rainfall totals over southern Africa are not limited to RCMs but also occur in numerical weather prediction models. Recent studies show that for the summer months (December to February - DJF) the Conformal Cubic Atmospheric Model (CCAM) has a modest but general wet bias when predicting rainfall over South Africa at short-range time scales. This wet bias is as large as 2 mm/day over the eastern Free State of South Africa (Engelbrecht et al., 2011). The model generally is skilful in predicting the occurrence of rainfall events larger than 10 mm/day in magnitude, but skill is reduced or is absent over the eastern escarpment region of South Africa (Landman et al., 2012). GCMs also exhibit pronounced wet biases over the eastern escarpment region of southern Africa. Jury (2012) analysed the summer climatology of the zonal gradient in the vertical atmospheric humidity profile over the maize belt (25-30° S) in South Africa and found a wet bias in most of the simulations over the eastern escarpment. In some models, this bias extends well to the west over the South African plateau. The causes for such overestimations may be found in the moist layer depth (that is affected by the amount of humid southwest Indian Ocean air drawn from the east), the rate of evapotranspiration over the eastern escarpment and the deposition of vertical uplift in the continent-heated air (Jury, 2012).
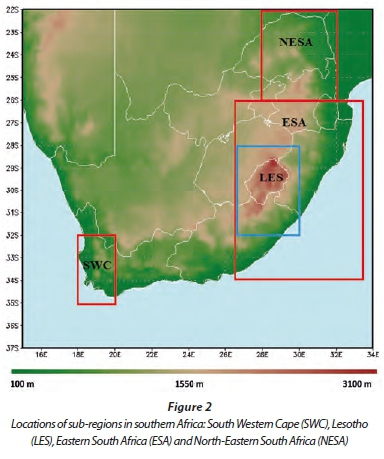
In summary, the steep topography of the eastern escarpment is known for creating problems for climate models as rainfall totals are generally overestimated (Joubert et al., 1999; Engelbrecht et al., 2002; Giorgi, 2005; Christensen et al., 2007; Liang et al., 2008; Engelbrecht et al., 2009; Nikulin et al., 2012; Jury, 2012; Sylla et al., 2012; Hernandez-Diaz et al., 2013). The purpose of this paper is to evaluate the performance of the variable-resolution atmospheric model CCAM in representing rainfall totals over STA and in particular the eastern escarpment region of South Africa and Lesotho. This model is currently applied as a GCM and RCM at the Council for Scientific and Industrial Research (CSIR) in South Africa. Our evaluations are therefore based on simulations where the model is applied at typical GCM resolutions, with alternative simulations exploring the performance of the model at higher RCM resolutions. Of particular interest is the model's ability to simulate rainfall totals, the seasonal cycle of rainfall and inter-annual variability over different regions (Fig. 2).
METHODS
The model applied in this research is the variable-resolution global atmospheric model CCAM, developed by the Commonwealth Scientific and Industrial Research Organisation (CSIRO) in Australia (MgGregor, 2005). CCAM may be applied at quasi-uniform horizontal resolution globally, to function as a GCM, or alternatively in stretched-grid mode as an RCM to provide high resolution over an area of interest (see Engelbrecht et al., 2009). Variable-resolution global modelling avoids the problems caused by the reflections of atmospheric waves at the lateral boundaries of limited-area models (McGregor and Dix, 2001; Wang et al., 2004). When applied in stretched-grid mode, CCAM may be forced only at its lower boundary through the provision of sea-surface temperatures and sea-ice fields of a host model/analysis or, alternatively, may also be nudged within the three-dimensional dynamic and thermodynamic forcing fields (Thatcher and McGregor, 2009; 2010).
CCAM employs a semi-implicit semi-Langrangian method to solve the hydrostatic primitive equations (McGregor, 1996). It contains a comprehensive range of physical parameterisations, including the CSIRO mass-flux cumulus convection scheme (which includes downdrafts and the evaporation of rainfall) (McGregor, 2003), the GFDL parameterisation for long- and short-wave radiation (interactive cloud distributions diagnosed from liquid and ice-water content) (Schwarzkopf and Fels, 1991) and gravity wave drag (Rotstayn, 1997). The model is a highly flexible dynamic downscaling tool for obtaining detailed simulations of present-day climate, and projected future climates, at the sub-continental and continental scale (e.g. Engelbrecht et al. 2009; Engelbrecht et al., 2011; Engelbrecht and Engelbrecht, 2015). Two different types of CCAM simulations are analysed here. Firstly, an ensemble of six Atmospheric Model Intercomparison Project (AMIP) simulations was performed for the period 1979-2005. The AMIP experimental design (Gates, 1992) implies that the model is forced at its lower boundary with observed SSTs and sea-ice, but is free to develop its own atmospheric circulation patterns. In these simulations the model was applied at a quasi-uniform resolution of about 200 km in the horizontal. Each of the six ensemble members was initialised using different initial conditions obtained from reanalysis data, using a lagged-average forecasting approach. A main purpose of CCAM-AMIP simulations is to determine whether the model can realistically represent inter-annual variability in response to the prescribed lower-boundary forcing. The second experiment performed is a so-called reanalysis data downscaling. The National Centre for Environmental Prediction (NCEP) reanalysis data were used to force CCAM simulations performed in stretched-grid mode. The modestly stretched grid provided a resolution of about 50 km over southern and tropical Africa, with the resolution decreasing to about 400 km in the far-field. The model was nudged towards the NCEP reanalysis fields every 6 h, through the application of a digital filter using a 600 km length scale. The filter was applied from 900 hPa upwards.
The simulated monthly and seasonal rainfall totals (rainfall totals and rainfall spatial patterns), intra-annual and inter-annual rainfall variability are compared against the station-based rainfall data of the Climatic Research Unit (CRU). The CRU TS3.1 data have a resolution of 0.5 degrees in latitude and longitude and span the period 1901-2012 (New et al., 1999). The Tropical Rainfall Measuring Mission (TRMM) remotely-sensed precipitation estimates, at a resolution of 0.25° for the period 1998-2012, is also used (Dinku et al., 2007). The CRU and TRMM will collectively be referred to as 'observed data' in the remainder of this paper. It may be noted that no observational data set is a perfect representation of reality - the quality of the CRU data depends on the quality and density of station data. This is a particular concern in the Lesotho region where the density of station data is low. TRMM data are of higher spatial resolution, but the remote sensing of rainfall is also suffering from a range of errors, particularly in regions of steep topography (Nesbitt and Anders, 2009). There is therefore value in assessing more than one observational data set towards estimating reality and to obtain some description, at least qualitatively, of the uncertainty in observing reality. Model biases are therefore calculated separately for each of the observational data sets in the evaluation section of this paper. The simulations are analysed as follows:
• Only rainfall values over the land are used in the analyses.
• The model data and TRMM data are interpolated to the CRU TS3.1 0.5° resolution grid to facilitate quantitative inter-comparisons (the CRU data represents only land points). Bi-cubic interpolation was applied in the case of the model data, whilst the 2-dimensional box-averaging method within the Grid Analysis and Display System was used in the case of the TRMM data. For both the cases of the model (CCAM-AMIP and CCAM-NCEP) and for the TRMM data this approach implies that some ocean points have been applied to obtain estimates of land-based precipitation for those grid points close to the coast line.
• For the CCAM-AMIP simulations the ensemble-average of the six ensemble members is used in the evaluation of rainfall totals and the seasonal cycle in rainfall.
• The pattern correlation is calculated between the simulations and observed fields (Walsh and McGregor, 1995). It is a correlation of 2 spatial fields, xiand op,applied in this paper to monthly, seasonal or annual rainfall averages, as i ranges from 1 to N, where N is the number of grid points in the model domain:
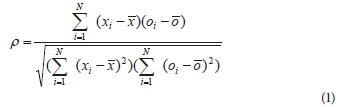
Here  and ōare the domain averages of xiand oi.
•The root mean square error (RMSE) is a measure of the accuracy between a specific forecasted variable from a model and the same observed variable since it is scale dependent (Hyndman and Koehler, 2006).
• The standard deviation is calculated as the measurements for the simulated and observed fields and is an estimate of average uncertainty of those measured values.
• The Spearman rank correlation (SRC) is applied in the research to determine whether model simulation of inter-annual variability (time-series data) has a statistically significant correlation with the corresponding observations. The SRC is calculated on the premise that there are no tied ranks within the data and is then subjected to significance testing.
With the CCAM-AMIP simulations only available for the period 1979-2005, the evaluation of both the CCAM-AMIP simulations and the CCAM-NCEP downscaling are performed for this period. The TRMM data is available only from 1998 onwards and as a result model evaluation data against TRMM data is confined to the period 1998-2005.
RESULTS AND DISCUSSION
Annual rainfall totals
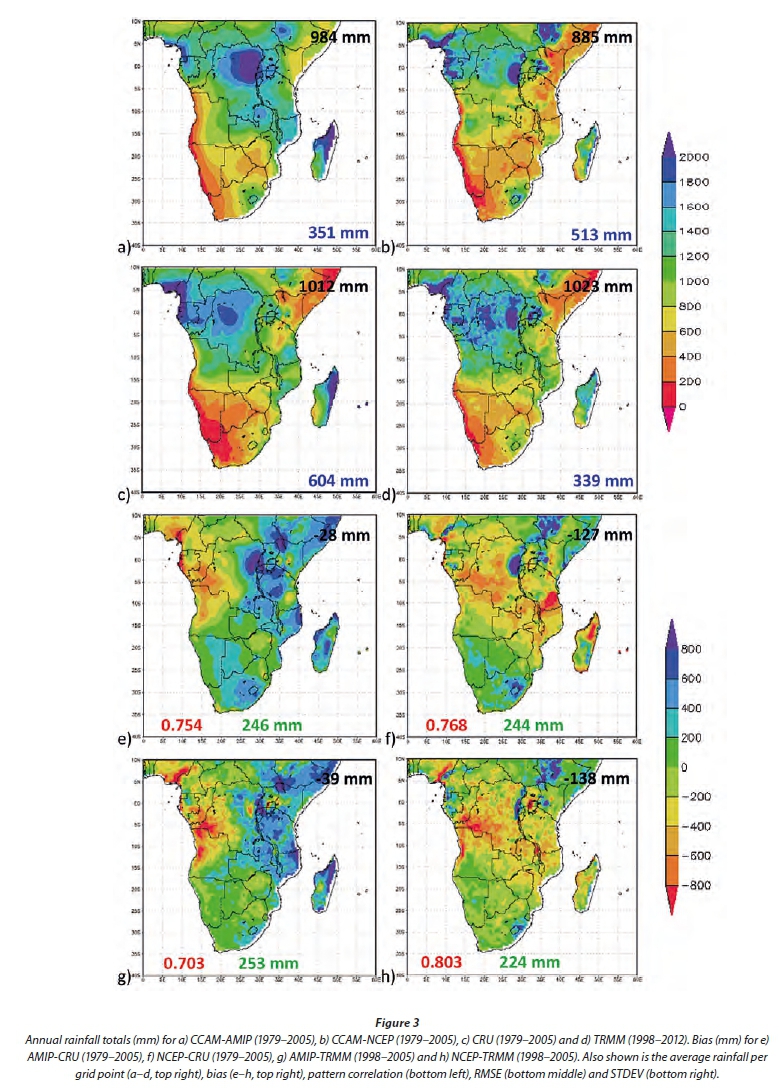
The CCAM-simulated annual rainfall totals for both the CCAM-AMIP simulations and CCAM-NCEP downscaling (Figs 3a and 3b) realistically represent the observed synoptic-scale rainfall features of STA. These include the dry slot (dry conditions in a zonal band) located over Botswana stretching to the Limpopo River basin of South Africa and Zimbabwe, the relatively high rainfall over the tropics that occur in association with the ITCZ (extending from Angola over Zambia into Mozambique) and the west-east rainfall gradient over South Africa. A pronounced rainfall maximum is evident over the Great Rift Valley in both the CCAM-AMIP and CCAM-NCEP simulations, in relation to the complex topography found in this region (e.g. Zhang et al., 2012). This feature is present in the TRMM observations (Fig. 3d), but not in the CRU data (Fig. 3e). One shortcoming of the CRU data is that rainfall patterns may be misrepresented in areas with a low density of weather station data. The higher resolution CCAM-NCEP downscaling has a higher pattern correlation with both the CRU and TRMM observed data sets, compared to the CCAM-AMIP simulations. This can probably be attributed to the higher resolution of the CCAM-NCEP downscaling, which leads to a more realistic representation of complex patterns of topography across the continent. A wet bias is present in the simulations for the biggest part of southern Africa, for both the CCAM-AMIP and CCAM-NCEP simulations (Figs 3e and 3f). This wet bias is the biggest in amplitude over the eastern escarpment region of South Africa, and exceeds 400 mm in some locations. The magnitude of the overall negative bias is largest for the CCAM downscaling of NCEP reanalysis, compared to the CCAM-AMIP simulations. However, the associated RMSEs of the reanalysis simulations are smaller, and the pattern correlations are higher.
Seasonal rainfall totals
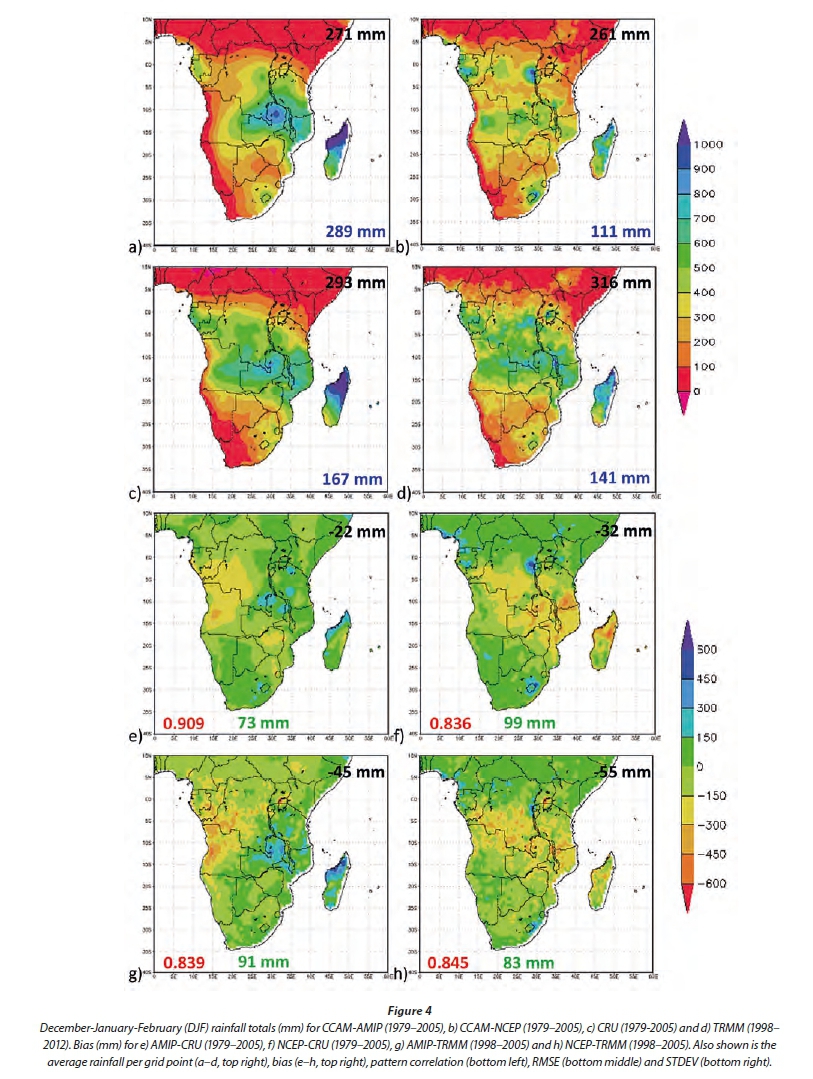
The meridional movement of the ITCZ is a feature that is well represented in the CCAM-AMIP and CCAM-NCEP simulations. The ITCZ is displaced to its most southerly location during DJF, reaching about 20°S (Figs 3c and 3d). It is during this time of the year that southern Africa receives the bulk of its rainfall from tropical-temperate cloud bands. Many of the other regional features of observed DJF rainfall are captured in the simulations, such as the dry slot extending eastward at 20°S from eastern Botswana to Limpopo and southern Zimbabwe. Zimbabwe has very high spatial summer rainfall variability, with totals exceeding 400 mm in the north and 160 mm in south (Fig. 4). Both the CCAM-AMIP and CCAM-NCEP simulations capture this south-north gradient rainfall, but underestimate the ITCZ-induced rainfall over northern Zimbabwe.
The area of high summer rainfall over the eastern escarpment is captured in the model simulations. However, rainfall totals are overestimated, particularly so in the higher resolution CCAM-NCEP simulations. Apart from the wet bias over Lesotho the simulations have a high spatial correlation to the observations (higher than for the annual rainfall totals). Rainfall is underestimated in general across the domain as is evident from the overall negative biases of the simulations (Figs 4e to 4h). The CCAM-NCEP downscaling exhibits a large dry bias over East Africa, which is a recurring shortcoming, also for the other seasons.
Winter (JJA) rainfall is strongly controlled by the strengthening of the sub-tropical high pressure belt in the lower and mid-levels over southern Africa. This circulation change is associated with sinking air and supressed rainfall over the region. Simultaneously, the ITCZ shifts to Africa north of the equator. Rainfall over southern Africa during this season results mostly from cold fronts and cut-off lows that move in over the subcontinent from the south (Figs 5c and 5d). Both the CCAM-AMIP and CCAM-NCEP simulations underestimate winter rainfall over the Cape coast region, with totals represented somewhat more realistically in the higher resolution reanalysis simulations (Figs 5a and 5b). However, over the eastern parts of the Free State a large wet bias is present in the CCAM-NCEP simulations. One of the reasons for the extreme dry bias over the south-western Cape (SWC, Fig. 2) in the CCAM-AMIP simulations is that the regional topographic features are very smooth at 200 km horizontal resolution, implying that the interaction between low-level flow and steep topography cannot be realistically represented.
Monthly rainfall totals
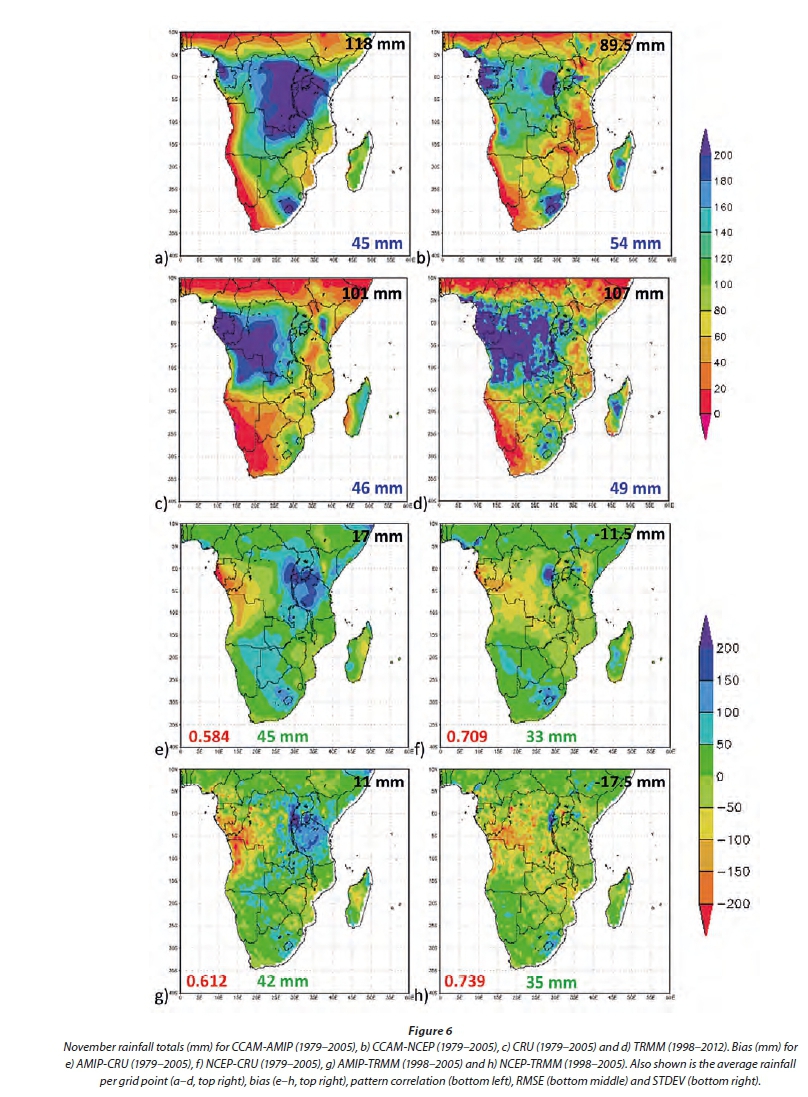
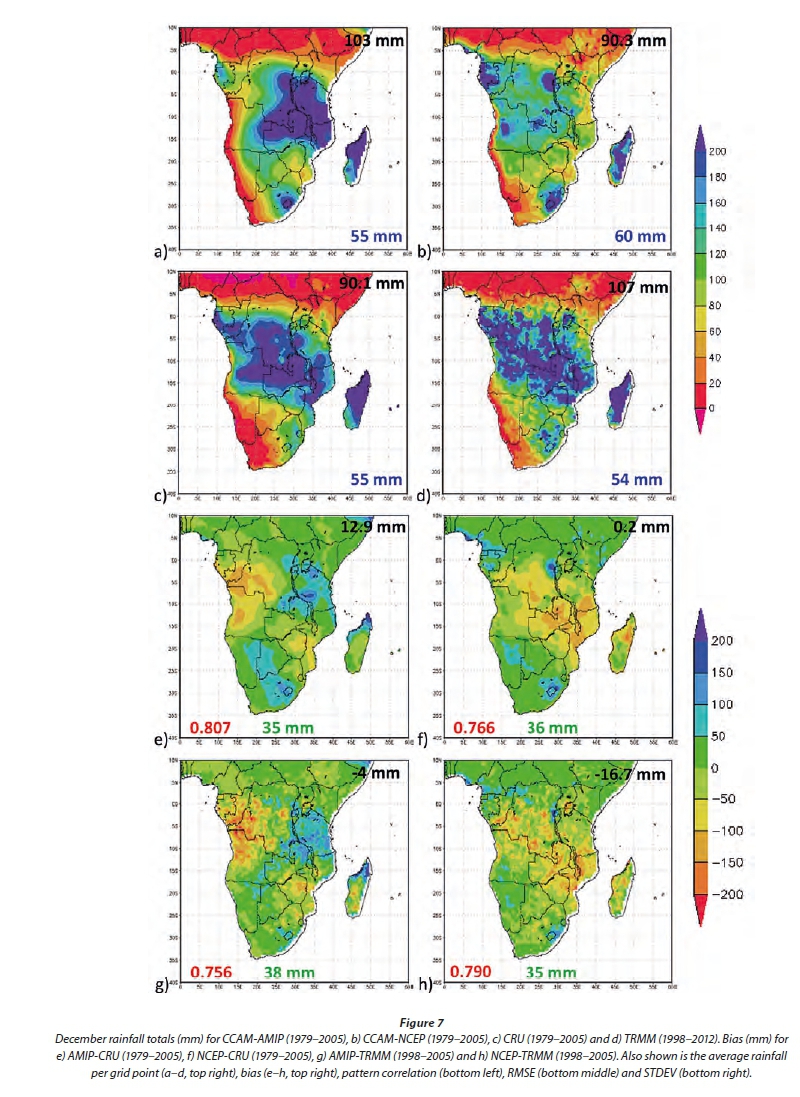
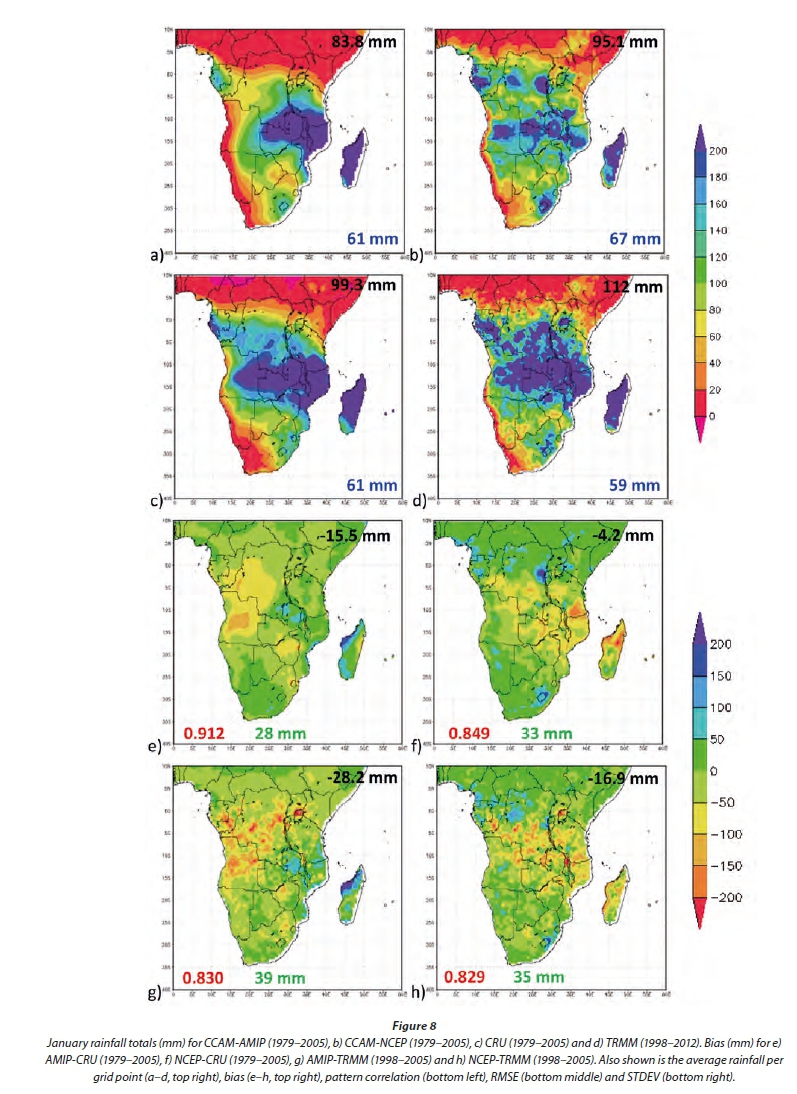
The November rainfall patterns, including the zonal rain band associated with the ITCZ, are represented well in both the CCAM-AMIP and reanalysis simulations. There are a number of areas where the model displays noticeable biases in rainfall totals, with overestimations over the complex topography regions of the Great Rift Valley and the eastern escarpment of South Africa and Lesotho in particular. These biases are also present in the December and January rainfall simulations (Figs 6a, 6b, 7a, 7b, 8a, 8b). The CCAM-AMIP simulations are indicative of too strong tropical-temperate linkages during November. Rainfall totals in excess of 100 mm are simulated across the southern African interior, whereas the observed rainfalls are less than 60 mm. Rainfall totals over the eastern escarpment of South Africa are also drastically overestimated compared to the CRU and TRMM observations. These overestimations are also evident from the area-averaged intra-annual rainfall cycles simulated for Lesotho (LES), eastern South Africa (ESA) and north-eastern South Africa (NESA) (Figs 2, 9a, 9b and 9c). Over much of the summer rainfall region the model incorrectly simulates the peak of the summer rain to occur in November rather than January. The relatively low pattern correlation for this month is partially the result of the overestimation of rainfall totals over the interior. The relatively drier Western and Eastern Cape coastline regions are captured well in the CCAM-AMIP and reanalysis data. However, the inland areas over the Western Cape and the biggest part of Namibia are drier than what the simulations are indicating. During December the ITCZ is displaced more to the south with a general increase in rainfall over much of southern Africa, especially over the eastern parts of southern Africa and Madagascar (Figs 7c and 7d). For this month the CCAM-AMIP runs have a stronger pattern correlation than the CCAM-NCEP simulations. The observed rainfall band linking southern Africa and the tropics, indicative of the occurrence of TTT-induced rainfall, is present in the model simulations, albeit overestimated in intensity. Rainfall is underestimated by the reanalysis run over Mozambique. The same spatial features found in November are again seen in December regarding the severe overestimation of rainfall over complex topography (Figs 7a and 7b). According to the CRU observations there is a slight increase in rainfall over the eastern escarpment of South Africa compared to November. TRMM rainfall shows a larger increase of about 40 mm in Lesotho and to the northeast of Lesotho, in KwaZulu-Natal, from November to December. This increase is overestimated in the model simulations - a steady increase of 20-40 mm is found over the Gauteng, North West and eastern Free State from the previous month in both the CCAM-AMIP and CCAM-NCEP simulations. The overestimation of rainfall for the western part of South Africa and Namibia is still present in the December simulations. These increases in rainfall from November to December show up in the regions for LES, ESA and NESA, where the reanalysis simulations are generally producing smaller pattern correlations than the CCAM-AMIP simulations (Figs 9a, 9b and 9c). During January the rainfall totals associated with the ITCZ are higher than earlier in the season, reaching values of 200 mm. The band is narrower than for the November and December months (Fig. 8c). This pattern and change is well represented in the CCAM-AMIP simulations. The CCAM- NCEP runs capture the increase in ITCZ-related rainfall totals more realistically, and exhibit a high pattern correlation with observations (Figs 8a and 8b). There is an increase in rainfall over the largest part of South Africa indicating that January is the month in which LES, ESA and NESA get the bulk of their rain annually (Figs 9a, 9b and 9c). This is in direct contrast to the simulations that peak rainfall too early. In the model simulations rainfall totals are incorrectly simulated to decrease relative to December, possibly in response to a weakening in the simulated link between the tropics and mid-latitudes (Fig. 8a). This simulation is also a feature of the CCAM reanalysis runs, although to a lesser extent (Fig. 8b).
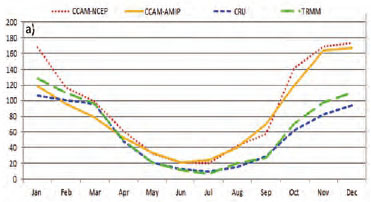
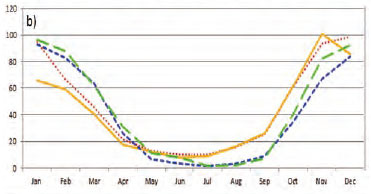
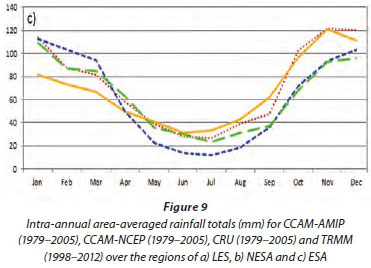
Intra-annual rainfall
A large positive bias in simulating annual, seasonal and monthly rainfall totals have been identified in both the CCAM-AMIP simulations and the CCAM-NCEP downscaling. Moreover, the ensemble of CORDEX RCMs evaluated to date over southern Africa all exhibit rainfall overestimations over this region (Nikulin et al., 2012). For this reason the focus for the following section is the LES, ESA and NESA regions of eastern southern Africa. LES, ESA and NESA are all summer rainfall regions characterised by low rainfall totals during April to August (Figs 9a, 9b and 9c). The CCAM-NCEP downscalings significantly overestimate the observed rainfall totals for the summer half-year (October to March). The CCAM-AMIP simulations exhibit similar over-estimations, with a pronounced overestimation of rainfall totals during the early summer. This may be related to tropical-temperate linkages being overestimated during the early summer (see Fig. 7 and the associated discussion, also see Tozuka et al. (2013)). The largest overestimations occur over LES, which contains the steepest and most complex topography of the three sub-regions. One possible reason for the CCAM overstimations (and those of RCMs in general, when applied over LES), is the inadequate parameterisation of deep convection that occurs over the mountains in the presence of moist easterly low-level flow. It would be interesting to explore the hypothesis, by performing climate simulations at ultra-high resolution over the region, well beyond the hydrostatic limit (e.g. Engelbrecht et al., 2007). Although supercomputing capacity in South Africa is close to reaching the point of making such simulations feasible, this is beyond the scope of the current paper. The CCAM-NCEP simulations have a larger rainfall bias than the CCAM-AMIP simulations for most months, but the intra-annual rainfall cycle is greatly improved overall. That is, the CCAM-NCEP does show January to be the peak of the rainfall season, in correspondence to observations. Note that in the CCAM-NCEP downscalings the model is forced with the synoptic-scale flow patterns every 6 h, implying that no artifical overstimations or underestimations of tropical-temperate cloud band formation are allowed to occur, unlike in the AMIP simulations where the model is allowed to develop atmospheric circulation patterns freely in response to the lower-boundary forcing.
Inter-annual rainfall
The inter-annual area-averaged rainfall variability is analysed for summer rainfall (DJF) over the summer rainfall regions (LES, ESA and NESA) over southern Africa. The overestimation of rainfall by the CCAM-NCEP downscaling over the Lesotho region is a reoccurring feature from 1984 to 2007 (Fig. 10a) even though the SRC calculated is 0.57 and significant at the 99.9% level. The latter result indicates that the CCAM-NCEP simulations have skill in representing inter-annual variability of summer rainfall over the Lesotho region. This is an important result. It implies that if the model simulations reflect the inter-annual variability in circulation realistically (this is forced to be the case in the CCAM-NCEP downscaling), the model's convection scheme is capable of realistically simulating the inter-annual variability in rainfall. The rainfall amounts for NESA and ESA are better fitted with the CRU rainfall in terms of amplitude (Figs 10b and 10c) compared to the LES area, and remain highly correlated to the corresponding observed time-series of inter-annual variability. This is an important result. It implies that if the model simulations reflect the inter-annual variability in circulation realistically (this is forced to be the case in the CCAM-NCEP downscaling through the 6-hourly nudging), the model's convection scheme is capable of realistically simulating the inter-annual variability in rainfall over these three domains in eastern southern Africa.
In the CCAM-AMIP simulations, however, inter-annual rainfall variability is only represented skilfully for the NESA region (at the 95% level of significance). These results may stem from the synoptic-scale inter-annual variability in circulation not well-represented in the CCAM-AMIP runs, or alternatively that the relatively low resolution CCAM-AMIP runs are not skilful in representing rainfall totals over eastern South Africa. It may also be noted that in the case of the CCAM-AMIP simulations, the model is only forced at its lateral boundary with observed sea-surface temperatures and sea-ice distributions, and is initialised only once, at the beginning of the simulation. Internal model variability and natural variability are therefore also factors influencing the simulated inter-annual variability, and it is probably only during seasons of strong ENSO forcing that the CCAM-AMIP runs may be expected to represent the observed circulation and rainfall anomalies realistically (see, for example, Landman and Beraki (2010)).
Although a detailed analysis of observed and simulations of trends in climate over southern Africa falls beyond the scope of this paper, it is interesting to note that an increasing rainfall trend over the three regions is present in both the observations and simulations (Fig. 10). This finding is consistent with the projections of future climate change for DJF of Engelbrecht et al. (2009) and Engelbrecht et al. (2011). Such a rainfall increase is plausible to occur in response to a deepening of the continental trough and the strengthening of the IOH in the low- and mid-levels over the Indian Ocean (Engelbrecht et al., 2009). An alternative reason for the upward trend in rainfall is that the 1982-1984 drought period created an artefact due to the specific time range, but because the previous finding is consistent with Engelbrecht et al. (2009) and Engelbrecht et al. (2011) the artefact creating the trend seems less likely.
CONCLUSIONS
Present-day CCAM-AMIP simulations and CCAM-NCEP downscaling were performed using a variable-resolution GCM, CCAM. Important synoptic-scale features of the observed rainfall climatology are well captured in the CCAM simulations, including the west-east gradient in rainfall over South Africa and the meridional movement of ITCZ-induced rainfall bands. The dry slot, extending eastward at 20° S from eastern Botswana to Limpopo and southern Zimbabwe, found during the summer and annually, is another important feature that both simulations captured remarkably well. A couple of shortcomings were also identified in the model simulations. Rainfall totals are significantly overestimated for the eastern escarpment areas of southern Africa, despite a general negative rainfall bias over the larger SAT region. The model simulations generally represent the seasonality of rainfall over southern Africa well, although spring rainfall is significantly overestimated in the CCAM-AMIP simulations, over the eastern parts of southern Africa. This leads the peak in summer rainfall to be simulated to occur too early in the CCAM-AMIP simulations. Significant SRC between the CCAM-NCEP rainfall simulations and observations indicate that inter-annual rainfall variability is skilfully simulated over the LES, ESA and NESA regions. This result implies that if the model simulations reflect the inter-annual variability in circulation realistically (this is forced to be the case in the CCAM-NCEP downscaling through 6-hourly nudging), the model's convection scheme is capable of realistically simulating the inter-annual variability in rainfall. The CCAM-AMIP simulations represent the inter-annual variability only with skill over NESA. The difference in general between the CCAM-AMIP and CCAM-NCEP simulations can to some extent be attributed to the difference in resolution even though the CCAM-NCEP simulations were also forced with synoptic-scale atmospheric circulations. In particular, the CCAM-AMIP simulations are only forced through SSTs and sea-ice at the model's lower boundary and, except for seasons of strong ENSO forcing, are unlikely to reflect the observed inter-annual variability (e.g. Landman and Beraki, 2012). Further investigation is needed to understand the effect of increasing the resolution in the model and if the already large overestimations in rainfall seen in the coarse resolution simulations over strenuous topography can be improved. To this end, the authors foresee that improvements in supercomputing in South Africa, primarily through the supercomputers of the Centre for High Performance Computing (CHPC) of the CSIR, will over the next few years make feasible the first climate simulations performed beyond the hydrostatic limit, over the eastern escarpment areas of South Africa.
ACKNOWLEDGEMENTS
The first author would like to thank the Applied Centre for Climate and Earth System Studies (ACCESS) for funding his MSc research. Roelof Burger is thanked for his comments on the paper. The comments of two anonymous referees were also most valuable in improving the paper. All model simulations have been performed on the computer clusters of the Centre for High Performance Computing (CHPC) in South Africa.
REFERENCES
ASHLEY WS, MOTE TL, GRADY DIXON P, TROTTER SL, POWELL EJ, DURKEE JD and GRUNDSTEIN AJ (2003) Distribution of mesoscale convective complex rainfall in the United States. Mon. Weather Rev. 131 3003-3017. http://dx.doi.org/10.1175/1520-0493(2003)131<3003:DOMCCR>2.0.CO;2 [ Links ]
BLAMEY RC and REASON CJC (2009) Numerical simulation of a mesoscale convective system over the east coast of South Africa. Tellus 61A 17-34. http://dx.doi.org/10.1111/j.1600-0870.2008.00366.x [ Links ]
CHRISTENSEN JH, HEWITSON B, BUSUIOC A, CHEN A, GAO X, HELD I, JONES R, KOLLI RK, KWON W-T, LAPRISE R, MAGANA RUEDA V, MEARNS L, MENENDEZ CG, RAISANEN J, RINKE A, SARR A and WHETTON P (2007) Regional Climate Projections. In: Climate Change 2007: The Physical Science Basis. Contribution of Working Group I to the Fourth Assessment Report of the Intergovernmental Panel on Climate Change [Solomon S, Qin D, Manning M, Chen Z, Marquis M,Averyt AB, Tignor M, Miller HL (eds)]. Cambridge University Press, Cambridge and New York. [ Links ]
COOK KH (2000) The South Indian convergence zone and interannual rainfall variability over southern Africa. J. Clim. 13 3789-3804. http://dx.doi.org/10.1175/1520-0442(2000)013<3789:TSICZA>2.0.CO;2 [ Links ]
D'ABRETON PC and TYSON PD (1995) Divergent and non-divergent water vapour transport over southern Africa during wet and dry conditions. Meteorol. Atmos. Phys. 55 47-59. http://dx.doi.org/10.1007/BF01029601 [ Links ]
D'ABRETON PC and TYSON PD (1996) Three-dimensional kinematic trajectory modelling of water vapour transport over Southern Africa. Water SA 22 297-305. [ Links ]
DE CONING E, FORBES SG and POOLMAN E (1998) Heavy precipitation and flooding on 12-14 February 1996 over the summer rainfall regions of South Africa: Synoptic and isentropic analyses. Nat. Weather Dig. 22 25-36. [ Links ]
DINKU T, CECCATO P, GROVER-KOPEC E, LEMMA M, CONNOR SJ and ROPELEWSKI CF (2007) Validation of satellite rainfall products over East Africa's complex topography. Int. J. Remote Sens. 28 (7) 1503-1526. http://dx.doi.org/10.1080/01431160600954688 [ Links ]
DURKEE JD and MOTE TL (2009) A climatology of warm-season mesoscale convective complexes in subtropical South America. Int. J. Climatol. 30 418-431. [ Links ]
ENGELBRECHT CJ and ENGELBRECHT FA (2015) Shifts in Köppen-Geiger climate zones over southern Africa in relation to key global temperature goals. Theor. Appl. Climatol. http://dx.doi.org/10.1007/s00704-014-1354-1 [ Links ]
ENGELBRECHT FA, McGREGOR JL and RAUTENBACH CJ deW (2007) On the development of a new nonhydrostatic atmospheric model in South Africa. S. Afr. J. Sci. 103127-134. [ Links ]
ENGELBRECHT FA and RAUTENBACH CJ deW (2000) Perspektief vir genestelde klimaatmodellering oor suidelike Afrika. S. Afr. Tydskrif Wetenskap Kuns 19 47-51. [ Links ]
ENGELBRECHT FA, RAUTENBACH CE deW, MCGREGOR JL and KATZFEY JJ (2002) January and July climate simulations over the SADC region using the limited-area model DARLAM. Water SA 28 361-374. http://dx.doi.org/10.4314/wsa.v28i4.4909 [ Links ]
ENGELBRECHT FA, MCGREGOR JL and ENGELBRECHT CJ (2009) Dynamics of the Conformal-Cubic Atmospheric Model projected climate-change signal over southern Africa. R. Meteorol. Soc. 29 1013-1033. http://dx.doi.org/10.1002/joc.1742 [ Links ]
ENGELBRECHT FA, LANDMAN WA, ENGELBRECHT CJ, LANDMAN S, BOPAPE MM, ROUX B, MCGREGOR JL and THATCHER M (2011) Multi-scale climate modelling over Southern Africa using a variable-resolution global model. Water SA 37 637-658. http://dx.doi.org/10.4314/wsa.v37i5.2 [ Links ]
GARSTANG MB, KELBE E, EMMIT GD and LONDON WB (1987) Generation of convective storms over the escarpment of NE South Africa. Mon. Weather Rev. 115 429-443. http://dx.doi.org/10.1175/1520-0493(1987)115<0429:GOCSOT>2.0.CO;2 [ Links ]
GATES WL (1992) AMIP: The Atmospheric Model Intercomparison Project. Bull. Am. Meteorol. Soc. 73 1962-1970. http://dx.doi.org/10.1175/1520-0477(1992)073<1962:ATAMIP>2.0.CO;2 [ Links ]
HARRISON MSJ (1984) A generalized classification of South African rain-bearing synoptic systems. Int. J. Climatol. 4 547-560. http://dx.doi.org/10.1002/joc.3370040510 [ Links ]
HART NCG, REASON CJC and FAUCHEREAU N (2010) Tropical-extratropical interactions over Southern Africa: Three Cases of Heavy Summer Season Rainfall. Mon. Weather Rev. 138 2608-2623. http://dx.doi.org/10.1175/2010MWR3070.1 [ Links ]
HERNANDEZ-DIAZ L, LAPRISE R, SUSHAMA L, MARTYNOV, WINGER K and DUGAS B (2013) Climate simulation over CORDEX Africa domain using the fifth-generation Canadian Regional Climate Model (CRCM5). Clim. Dyn. 40 1215-1433. http://dx.doi.org/10.1007/s00382-012-1387-z [ Links ]
HYNDMAN RJ and KOEHLER AB (2006) Another look at the measure of forecast accuracy. Int. J. Forecasting 22 679-888. http://dx.doi.org/10.1016/j.ijforecast.2006.03.001 [ Links ]
JEONG J H, WALTHER A, NIKULIN G, JONES C and CHEN D (2011) Diurnal cycle of precipitation amount and frequency in Sweden: observation versus model simulation. Tellus A 63 http://dx.doi.org/10.1111/j.1600-0870.2011.00517.x [ Links ]
JOUBERT AM, KATZFEY JJ, McGREGOR JL and NGUYEN KC (1999) Simulating mid-summer climate over southern Africa using a nested regional climate model. J. Geophys. Res. 104 19015-19025. http://dx.doi.org/10.1029/1999JD900256 [ Links ]
JURY MR (2012) An intercomparison of model-simulated east-west climate gradient over South Africa. Water SA 38 467-478. http://dx.doi.org/10.4314/wsa.v38i4.1 [ Links ]
LANDMAN WA and BERAKI A (2010) Multi-model forecast skill for mid-summer rainfall over southern Africa. Int. J. Climatol. 32 303-314. http://dx.doi.org/10.1002/joc.2273 [ Links ]
LAING AG and FRITSCH JM (1993a) Mesoscale convective complexes in Africa. Mon. Weather Rev. 1212254-2263. http://dx.doi.org/10.1175/1520-0493(1993)121<2254:MCCIA>2.0.CO;2 [ Links ]
LIANG XZ, KUNKEL KE, MEEHL GA, JONES RG, WANG JXL (2008) Regional climate models downscaling analysis of general circulation models present climate biases propagation into future change projections. Geophys. Res. Lett. 35 L08709 http://dx.doi.org/10.1029/2007GL032849 [ Links ]
LIANG XZ, LI L, DAI A and KUNKEL KE (2004) Regional climate model simulation of summer precipitation diurnal cycle over the United States. Geophys. Res. Lett. 31http://dx.doi.org/10.1029/2004GL021054 [ Links ]
LYON B and DEWITT DG (2012) A recent and abrupt decline in the East African long rains. Geophys. Res. Lett. 39 L02702 http://dx.doi.org/10.1029/2011GL050337 [ Links ]
MASON SJ and JURY MR (1997) Climatic change and variability over Southern Africa: A reflection on underlying processes. Prog. Phys. Geog. 21 23-50. http://dx.doi.org/10.1177/030913339702100103 [ Links ]
McGREGOR JL (1996) Semi-Lagrangian advection on conformal-cubic grids. Mon. Weather Rev. 124 1311-1322. http://dx.doi.org/10.1175/1520-0493(1996)124<1311:SLAOCC>2.0.CO;2 [ Links ]
McGREGOR JL (2003) A new convection scheme using a simple closure. In: Current Issues in the Parameterization of Convection. BMRC Res. Rep. 9333-36. [ Links ]
McGREGOR JL (2005) C-CAM: Geometric aspects and dynamical formulation. CSIRO Atmospheric Research, Dickson ACT, Australia. [ Links ]
McGREGOR JL and DIX MR (2001) The CSIRO conformal-cubic atmospheric GCM. In: Hodnett PF (ed.) IUTAM Symposium on Advances in Mathematical Modelling of Atmosphere and Ocean Dynamics. Kluwer, Dordrecht. 197-202. http://dx.doi.org/10.1007/978-94-010-0792-4_25 [ Links ]
McGREGOR JL, KATZFEY JJ, NGUYEN KC and THATCHER MJ (2011) Some recent developments for dynamical downscaling of climate. Proc. 27th Annual Conference of the South African Society for Atmospheric Sciences, September 2011, Hartebeeshoek. [ Links ]
NESBITT SW and Anders AM (2009) Very high resolution precipitation climatologies from the Tropical Rainfall Measuring Mission precipitation radar. Geophys. Res. Lett. 36 (15) L15815. http://dx.doi.org/10.1029/2009gl038026 [ Links ]
NICHOLSON SE (1986) The nature of rainfall variability in Africa south of the equator. J. Clim. 6 515-530. http://dx.doi.org/10.1002/joc.3370060506 [ Links ]
NICHOLSON SE (2000) The nature of rainfall variability over Africa on time scales of decades to millennia. Glob. Plann. Change 26 137-158. http://dx.doi.org/10.1016/S0921-8181(00)00040-0 [ Links ]
NIKULIN G, GIORGI F, ASRAR G, BUSHNER M, CEREZO-MOTA R, CHRISTENSEN OB, DEQUE M, FERNANDEZ J, HANSLER A and VAN MEIJNGAARD E (2012) Precipitation climatology in an ensemble of CORDEX-Africa regional climate simulations. J. Clim. 25 6057-6078. http://dx.doi.org/10.1175/JCLI-D-11-00375.1 [ Links ]
REASON CJC and MULENGA H (1999) Relationships between South African rainfall and SST anomalies in the southwest Indian Ocean. Int. J. Climatol. 19 1651-1673. http://dx.doi.org/10.1002/(SICI)1097-0088(199912)19:15<1651::AID-JOC439>3.0.CO;2-U [ Links ]
REASON CJC, LANDMAN W and TENNANT W (2006) Seasonal to decadal prediction of southern African climate and its links with variability of the Atlantic Ocean. Bull. Am. Meteorol. Soc. 87941-955. http://dx.doi.org/10.1175/BAMS-87-7-941 [ Links ]
ROCHA DA, MORALES CA, CUADRA SV and AMBRIZZI T (2009) Precipitation diurnal cycle and summer climatology assessment over South America: An evaluation of Regional Climate Model version 3 simulations. J. Geophys. Res. 114D10108. http://dx.doi.org/10.1029/2008JD010212 [ Links ]
ROTSTAYN LD (1997) A physically based scheme for the treatment of stratiform clouds and precipitation in large-scale models. I: Description and evaluation of the microphysical processes. Q. J. R. Meteorol. Soc. 1231227-1282. [ Links ]
SCHWARZKOPF MD and FELS SB (1991) The simplified exchange method revisited: an accurate, rapid method for computation of infrared cooling rates and fluxes. J. Geophys. Res. 969075-9096. http://dx.doi.org/10.1029/89jd01598 [ Links ]
SHIN DW, COCKE S and LAROW TE (2007) Diurnal cycle of precipitation in a climate model. J. Geophys. Res. 112DOI: 10.1029/2006JD008333. http://dx.doi.org/10.1029/2006JD008333 [ Links ]
SYLLA MB, COPPOLA E, MARIOTTI L, GIORGI F, RUTI PM, DELL'AQUILA A, BI X (2010) Multiyear simulations of the African climate using a regional climate model (RegCM3) with the high resolution ERA-interim reanalysis. Clim. Dyn. 35 231-247. http://dx.doi.org/10.1007/s00382-009-0613-9 [ Links ]
TALJAARD JJ (1986) Change of rainfall distribution and circulation pattern over southern Africa in summer. J. Clim. 6579-592. http://dx.doi.org/10.1002/joc.3370060602 [ Links ]
THATCHER M and McGREGOR JL (2009) Using a scale-selective filter for dynamical downscaling with the conformal cubic atmospheric model. Mon. Weather Rev. 137 1742-1752. http://dx.doi.org/10.1175/2008MWR2599.1 [ Links ]
THATCHER M and McGREGOR JL (2010) A technique for dynamically downscaling daily-averaged GCM datasets over Australia using the Conformal Cubic Atmospheric Model. Mon. Weather Rev. 139 79-95. http://dx.doi.org/10.1175/2010MWR335L1 [ Links ]
TODD M, WASHINGTON R and PALMER PI (2004) Water vapour transport associated with tropical-temperate trough systems over southern Africa and the southwest Indian Ocean. Int. J. Climatol. 24555-568. http://dx.doi.org/10.1002/joc.1023 [ Links ]
TOZUKA T, BABATUNDE JA and ENGELBRECHT FA (2013) Impacts of convection schemes on simulating tropical-temperate troughs over southern Africa. Clim. Dyn. http://dx.doi.org/10.1007/s00382-013-1738-4 [ Links ]
TYSON PD (1986) Climatic Change and Variability over Southern Africa. Oxford University Press, Cape Town. [ Links ]
TYSON PD and WHYTE RA (2000) The Weather and Climate of South Africa. Oxford University Press Southern Africa, Cape Town, 212-213. ISBN: 0 19 571806 2. [ Links ]
WALKER ND and LINDESAY JA (1989) Preliminary observations of oceanic influences on the February-March 1988 floods in central South Africa. S. Afr. J. Sci. 85164-169. [ Links ]
WANG Y, LEUNG LR, MCGREGOR JL, LEE D-K, WANG W-C, DING Y, KIMURA F (2004) Regional climate modeling: progress, challenges, and prospects. J. Meteorol. Soc. Jap. 82 1599-1628. http://dx.doi.org/10.2151/jmsj.82.1599 [ Links ]
WALSH K and McGREGOR JL (1995) January and July climate simulations over the Australian region using a limited area model. J. Clim. 8 2387-2403. http://dx.doi.org/10.1175/1520-0442(1995)008<2387:JAJCSO>2.0.CO;2 [ Links ]
ZHANG Q, KORNICH H AND HOLMGREN K (2012) How well do reanalyses represent the southern African precipitation? Clim. Dyn. http://dx.doi.org/10.1007/s00382-012-1423-z [ Links ]
Received: 10 November 2014
Accepted in revised form 18 August 2015
* To whom all correspondence should be addressed. e -mail: ZDedekind@csir.co.za

