


Servicios Personalizados
Articulo
 Inglés (pdf)
 Articulo en XML
 Referencias del artículo
Indicadores

Links relacionados
-
 Citado por Google
 -
 Similares en Google
Compartir

 Permalink
Water SA
versión On-line ISSN 1816-7950
versión impresa ISSN 0378-4738
Water SA vol.42 no.1 Pretoria ene. 2016
http://dx.doi.org/10.4314/wsa.v42i1.08
Climate influences on upper Limpopo River flow
Mark R JuryI, II, *
IPhysics Dept, University of Puerto Rico Mayagüez, PR 00681, Puerto Rico
IIUniversity of Zululand, PB X1001, KwaDlangezwa 3886, South Africa
ABSTRACT
This study demonstrates how the regional climate affects river flow in the upper Limpopo Valley of southern Africa (21-24.5S, 26-30E). The catchment basin receives inflow from the Crocodile, Marico, Mahalapse and Lotsane Rivers, and lies on the eastern fringe of the Kalahari plateau, known for water-deficit conditions. Different ways to represent the surface water balance are compared. The annual cycle of gains from precipitation (P) spikes upward in late summer (Jan-Mar), while losses from evaporation have a broad peak in early summer (Oct-Dec). Different formulations of the surface water balance yield a range of values from -0.21 to -1.69 mm/day, depending on how evaporation is quantified. An analysis of global climatic influences on the Limpopo River found that high flow coincides with Pacific La Nina, low pressure over the central Atlantic and local upper easterly winds that draw tropical moisture from the Mozambique Channel. There is little trend in Limpopo River flow during the study period 1959-2014; however, CMIP5 model projections exhibit a downtrend in the surface water balance. A new insight is that evaporation losses are well represented by sensible heat flux in semi-arid environments.
Keywords: Limpopo Valley, hydro-meteorology, surface water deficit
INTRODUCTION
The Limpopo River meanders across the arid Kalahari plateau between South Africa, Botswana and Zimbabwe, before descending to the humid lowlands of Mozambique. The upper catchment and its tributaries (Marico-Crocodile-Mahalapse-Lotsane) constitute a broad valley extending from 21-24.5 S and 26-30 E, with a gentle slope initially northward then eastward toward the Indian Ocean, from 895 m at 26 E to 423 m at 30 E. The area has been occupied by nomadic farmers over past millenia and there is a history of drought impacts on vegetation (Ekblom et al., 2012). Monthly river flow records reveal peak discharge of ~ 1 000 m3/s that declines to near zero in winter (Jul-Sep) and remains < 10 m3/s in multi-annual drought. The hydrology is regulated by barrages and reservoirs which exert a steady demand on water resources (UNDP, 2007), particularly within South Africa. Total run-off is about 500 M m3/yr, of which the Crocodile River contributes about half (LBPTC, 2010).
The upper Limpopo Valley has a crop area > 1 M ha that is mostly rainfed and a population of ~ 5 M. The climate is subtropical dry savanna, with the following mean annual values: temperature 22°C, wind speed 4 m/s, rainfall ~ 350 mm, potential evaporation > 1 200 mm and soil moisture ~ 21%. Most rain falls between November and March, concentrated in ~ 7 rain days per month. Seasonal rainfall fluctuates from year to year (Tyson et al., 2002; Venter et al., 2003; Tadross et al., 2005): the coefficient of variation is 0.35, a constraint to crop production. Climate change research using CMIP3 model projections suggest a decline in summer run-off of 15% (Zhu and Ringler, 2010).
The objective of this paper is to characterize the surface water budget of the upper Limpopo River valley using direct measurements and model estimates, to analyse seasonal and multi-annual variability, and to demonstrate how the large-scale climate influences regional hydrological conditions.
DATA AND METHODS
Limpopo River monthly peak flow data were obtained via the South African Department of Water and Sanitation's hydrology service website for the gauge at Groblersbrug (23S, 28E, cf. Fig. 1a) in the period 1959-2014. Pan evaporation measurements are obtained from Mokolo (917 m), Glen Alpine (822 m) and Nzhelele (628 m) (cf. Fig. 1b), and averaged together for comparison with model estimates. Supplementing the in-situ hydrological record are area-averaged (21-24.5S, 26-30E) latent heat flux (LHF) and sensible heat flux (SHF) from the Global Land Data Assimilation System (GLDAS, Rodell et al 2004) NOAH hydrological model. Area-averaged LHF/SHF and climatic fields are derived from ECMWF and MERRA reanalysis models (Dee et al., 2011; Rienecker et al., 2011). Monthly gauge rainfall observations interpolated to 50 km grid are obtained from GPCC (Schneider et al., 2013) and the CRU potential evapo-transpiration (PET) is utilized, based on the Penman-Monteith calculation (Hargreaves and Samani, 1982; Harris et al., 2013). Additional datasets include MODIS satellite infrared surface temperatures and vegetation colour fraction at 1 km resolution (Huete et al., 2002), and naturally cover a period more recent than the in-situ measurements.


The temporal record of river flow was filtered to remove cycles < 18 months and wavelet spectral energy was calculated to search for significant oscillations. Regional climate influences on the upper Limpopo water balance were studied by cross-correlation (cf. Glad, 2010). With 65 degrees of freedom, 90% confidence is reached with r > |0.20|. To focus on the less manipulated peak summer flow, Jan-Apr discharge was cross-correlated with Dec-Mar reanalysis fields of surface temperature, air pressure and upper zonal wind (cf. Potter et al., 2004). At the climate change time scale, CMIP5 model simulations of Limpopo annual precipitation minus SHF were analysed using the rcp6 scenario. The models and scenarios are described in Taylor et al. (2012). CMIP5 outputs consistent with observed values were identified (cf. Jury, 2012) and projections were evaluated for trends (cf. Kumambala and Ervine, 2010). Case studies were analysed for a drought (Dec-Mar 1992) and flood (1-13 Mar 2014), to understand the climate and weather influences. The flood analysis makes use of daily river flow and satellite rainfall (Joyce et al., 2004), HYSPLIT airflow trajectories, regional sea surface temperature and 200 hPa geopotential height anomalies.
RESULTS
Limpopo hydro-climate
Figure 1a-c introduces the Limpopo River basin topography and tributaries, and the mean patterns of satellite vegetation fraction and day-time surface temperatures. It is evident that the upper Limpopo Valley is broad and drains eastward from the Kalahari Desert. It borders 3 countries: Botswana, South Africa and Zimbabwe. Water abstraction for urban consumption (e.g. Gaborone, Gauteng) and agricultural production has been relatively steady (UNDP, 2007), so peak river flow tends to follow climatic anomalies. The Limpopo area-averaged mean vegetation fraction is 36% and the day-time surface temperature is 38°C. The mean soil moisture fraction is ~ 21%, depending on data source, indicating water deficit conditions.
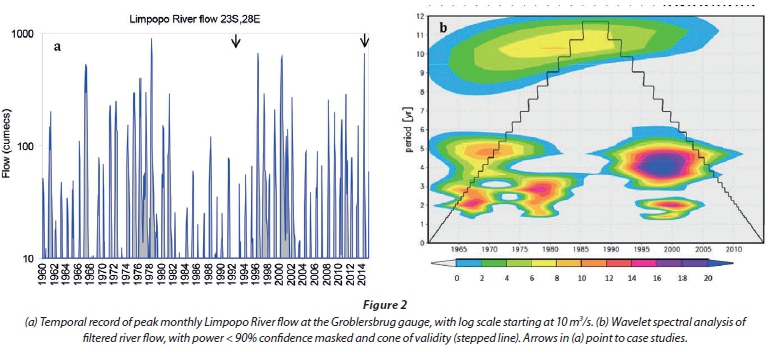
The temporal record of monthly peak flow at the Groblersbrug gauge is given in Fig. 2a. It shows a seasonal spike each year that rises in the late 1970s, diminishes in the 1980s to early 1990s and rises again in the 2000s. There is a no significant overall trend. A good portion of the flow derives from the Crocodile River (LBPTC, 2010) that is abstracted within South Africa and joins the Limpopo below Gaborone.
Oscilations in the Limpopo River flow are revealed in the wavelet spectral energy of filtered river flow anomalies (Fig. 2b). There is significant cycling from 2-5 years and 10-11 years. The faster cycling obtains higher amplitude during the wet spells of the 1965-1980 and 1996-2000, while the slower cycling is most pronounced in the dry 1980s.
Annual cycle
The annual cycle of precipitation (P) minus evaporation (E) is studied using LHF or SHF (respectively, P-EL, P-ESwhere: L=latent, S=sensible). Mean annual values (mm/day) are: P = 1.11, LHF = 1.32, SHF = 2.80, P-E = -0.21 using LHF or -1.69 using SHF. The P-ELreveals neutral conditions and a flat seasonal shape (Fig. 3a) with a small peak in Nov-Dec and weak deficit in Apr-May. The P-Es resolves a water deficit < -3 mm/day in Sep-Oct when river flow ceases. Peak river flow (100 m3/s) in the annual cycle occurs in Feb-Mar, following a month behind the peak of P-Es.
In Fig. 3b the mean annual cycle of model estimated latent and sensible heat flux is compared with PET and vegetation fraction. The SHF is below PET but exhibits a similar shape, rising in Sep-Nov and dipping in May-Jul when frost occurs in the upper Limpopo Valley. In contrast, LHF peaks in Jan-Mar in conjunction with vegetation fraction. The LHF is far below SHF in the spring season (Sep-Nov). Scatterplot comparisons between monthly pan evaporation averaged at 3 stations (cf. Fig. 1b) and model-estimated heat fluxes are given in Fig. 3c, d. The LHF r2 is low (0.15) and exhibits a weak relationship with measured pan evaporation (15% of variance). The sensible heat flux, parameterized as wind speed times surface minus air temperature, fits the pan evaporation very well (69% of variance).
Hydrological features
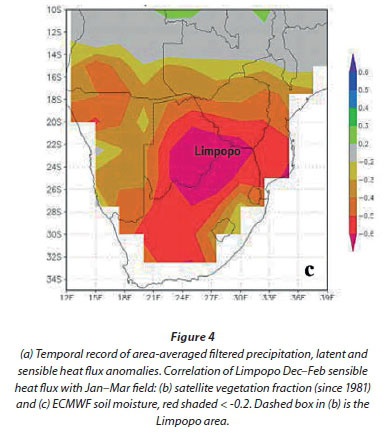
The smoothed anomalies of rainfall and heat fluxes are given in Fig. 4a. It is apparent that LHF follows rainfall with a 1-2 month lag. Its amplitude is flatter in the 1996 and 2000 wet spells. The sensible heat flux is almost a mirror image of rainfall, being low during wet spells and high in dry spells, one of which (1992) is analysed below. The Dec-Feb SHF in the upper Limpopo Valley is negatively correlated with Jan-Mar satellite vegetation index and ECMWF soil moisture (Fig. 4b, c), both locally and across the Kalahari Desert. The widespread N-S oriented correlation pattern suggests that tropical moisture sources are disconnected from sub-tropical troughs during periods of dessication.


A case of drought
While earlier studies have outlined the origin of South African drought, here the case of highest SHF is studied: Dec 91-Mar 92. The atmospheric circulation anomalies in that summer are illustrated as east-west and north-south slices in Fig. 5a, b. The zonal overturning circulation shows upper level westerly wind anomalies incoming from the Atlantic Ocean with a sinking component from 300 to 800 hPa over and east of the Limpopo Valley, corresponding with relative humidity anomalies < -15%. A similar pattern was found in the 1983 drought by Taljaard (1989). The meridional circulation anomalies are dominated by upper level divergence south of Africa that provide a northward sinking flow over the Limpopo Valley.
Maps of SHF and 500 hPa vertical motion anomalies averaged Dec 91-Mar 92 illustrate the impact of sinking motions and high surface temperatures (Fig. 5c,d). The normal summer inflow of moist air from the Mozambique Channel was disrupted (Jury and Pathack, 1995). Summer rainfall and LHF collapsed in the Limpopo Valley; consequently South Africa's 1992 maize production value was 1 000 times below normal (FAOstat, 2014). This drought persisted until 1996, similar to 1965-1967 and 1982-1987.
A case of flood
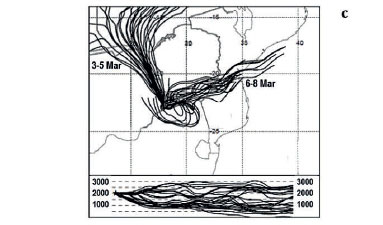
The flood case study focuses on the summer of 2014, when Limpopo River daily flow reached 555 m3/s on 16 March (Fig. 6a) following heavy rain from 1-13 March. The spatial pattern of rainfall and low level winds (Fig. 6b) reveals a NW cloud band extending from Angola across Botswana into the Limpopo Valley. Northeast winds fed moist air from the SW Indian Ocean into the cloud band. Airflow back-trajectories on 3-5 March 2014 'funnelled' from Zambia (Fig. 6c), whereas trajectories were from the Mozambique Channel on 6-8 March. The flood was underpinned by a standing wave pattern in the upper level circumpolar westerly winds. High amplitude trough-ridge anomalies (Fig. 6d) caused repeated NW cloud bands.


At regional scale, sea surface temperature anomalies were -2°C in the northern tropics and +2°C in the southern sub-tropics (Fig. 7a). This 'pushed' the equatorial trough south of its normal position. The vegetation fraction was > 50% to the northeast of the Limpopo, so incoming air received additional moisture from evapotranspiration. A hovmoller analysis of daily rainfall in Limpopo latitudes (Fig. 7b) shows that numerous easterly waves crossed from Madagascar to southern Africa before the flood (c ~ -.7 m/s). During and after the flood westerly waves became frequent (c ~ +11.3 m/s). Over the Limpopo there was a wet spell in early February and a dry spell in mid-February. However during the early March flood, a dry spell developed around Madagascar and tropical cyclone formation diminished <en.wikipedia.org/wiki/2013%E2%80%9314_South-West_Indian_Ocean_ cyclone_season>.
Climate influence and trend
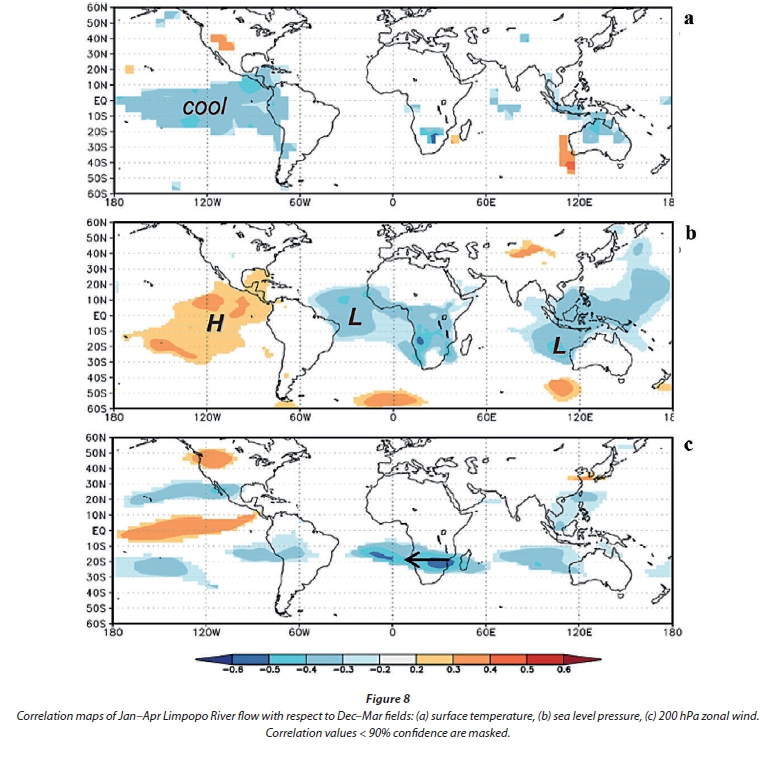
Global climatic influences on Jan-Apr Limpopo River flow are demonstrated in Fig. 8a-c by correlation with respect to Dec-Mar surface temperature, air pressure and upper zonal wind. Increased flow coincides with cool ocean temperatures in the east Pacific consistent with La Nina conditions. Locally there are cool temperatures in the Limpopo region as expected. Air pressure correlations reveal negative values (lower) over the central Atlantic and east Indian Ocean, while positive values (higher) prevail over the east Pacific. In the upper zonal wind pattern, there is a strong negative (easterly) axis stretching across southern Africa that links to the SW Indian Ocean. There is also a banded pattern over the Pacific consistent with La Nina conditions there.
Climatic trends and impacts are considered via Botswana maize yield (FAOstat, 2014) and Limpopo area-averaged summer maximum temperatures in Fig. 9a. There is a 0.029°C/yr uptrend in temperature (13% of variance) while the maize yield shows a downtrend of 80 kg/ha (30% of variance). To study whether global warming may induce further dessication, CMIP5 model projections of P-ES in the upper Limpopo Valley are considered (Fig. 9b). Five out of forty CMIP5 models are close to observed (-1.69 mm/day) and their average P-ESexhibits a downtrend of -0.0066 mm/day per year with the rcp6 scenario. Our projections may be compared with similar analyses: (DeWit and Stankiewicz, 2006; Zhu and Ringler, 2010; Jury, 2013; Ngongondo et al., 2013). If soil moisture becomes depleted, the viability of water-intensive crops such as maize is questionable.
CONCLUDING DISCUSSION
This study has demonstrated how regional climate influences river flow in the upper Limpopo Valley. Sophisticated high-resolution and remotely-sensed datasets were compared with in-situ measurements over a longer record. Rainfall from the GPCC interpolated dataset was contrasted with evaporation losses via SHF. Matsoukas et al. (2011) describe how surface water loss can be characterized by adjusted pan evaporation measurements and Penman-Monteith calculated PET. Here P-ESwas seen to lead river flow across the annual cycle (cf. Fig. 3a), producing a deficit -1.69 mm/day consistent with soil moisture ~ 21%. LHF followed rainfall and vegetation; and P-ELgave a neutral water balance inconsistent with deficit conditions.
An analysis of climatic influences on the Limpopo River found that east Pacific La Nina and high pressure favour increased flow, as expected from earlier studies. Here new features were uncovered with regard to low pressure over the central Atlantic and east Indian Ocean, and local upper easterly winds. While dry spells coincide with subsident upper westerly winds (cf. Fig. 5a), floods relate to NW cloud bands (cf. Fig. 6b).
Long-term trends in river flow and the surface water budget were insignificant in the study period 1959-2014; however, CMIP5 model projections exhibited a downtrend in P-ES that suggest additional pressure on water resources. Declining maize yields and warmer temperatures will necessitate conservative planning, innovative engineering and recycling efforts (UNDP, 2007) to meet the needs of a growing population. Further research is recommended to quantify run-off on the northern flank of the Limpopo Valley (Botswana, Zimbabwe), supported by remote sensing observations.
ACKNOWLEDGEMENTS
The author thanks South Africa's Department of Water and Sanitation for hydrological data distributed by Internet. Satellite and model interpolated data were analysed from the KNMI Climate Explorer, IRI Climate Library, NASA Giovanni and NOAA READY-ARL websites. SAPSE support from the South African Department of Higher Education and Training is acknowledged.
REFERENCES
DEE DP, UPPALA SM, SIMMONS AJ, BERRISFORD P, POLI P, KOBAYASHI S, ANDRAE U, BALMASEDA MA, BALSAMO G, BAUER P and co-authors (2011) The ERA-Interim reanalysis: configuration and performance of the data assimilation system. Q. J. R.l Meteorol. Soc. 137 553-597. http://dx.doi.org/10.1002/qj.828 [ Links ]
DeWIT M and STANKIEWICZ J (2006) Changes in surface water supply across Africa with predicted climate change. Science 301 1917-1921. http://dx.doi.org/10.1126/science.1119929 [ Links ]
EKBLOM A, LINDESAY G, RISBERG J and HOLMGREN K (2012) Rainfall variability and vegetation dynamics of the lower Limpopo Valley Southern Africa, 500 AD to present. Palaeogeogr. Palaeoclimatol. Palaeoecol. 363 69-78. http://dx.doi.org/10.1016/j.palaeo.2012.08.015 [ Links ]
FAOstat (2014) Food and Agricultural Organization statistical database. http://faostat.fao.org/ (Accessed 20 August 2015). [ Links ]
GLAD PA (2010) Meteorological and hydrological conditions leading to severe regional drought in Malawi. MSc thesis, Dept Geoscience, University of Oslo. 129 pp. [ Links ]
HARGREAVES GH and SAMANI ZA (1982) Estimating potential evaptranspiration. J. Irrig. Drain. Div ASCE 108 225-230. [ Links ]
HARRIS I, JONES PD, OSBORN TJ and LISTER DH (2013) Updated high-resolution grids of monthly climatic observations Int. J. Climatol. http://dx.doi.org/10.1002/joc.3711 [ Links ]
HUETE A, DIDAN K, MIURA T, RODRIGUEZ EP, GAO X and FERRIERA LG (2002) Overview of the radiometric and biophysical performance of the MODIS vegetation indices. Remote Sens. Environ. 83 195-213. http://dx.doi.org/10.1016/S0034-4257(02)00096-2 [ Links ]
JOYCE RJ, JANOWIAK JE, ARKIN PA and XIE PP (2004) CMORPH: A method that produces global precipitation estimates from passive microwave and infrared data at high spatial and temporal resolution. J. Hydrometeorol. 5487-503. http://dx.doi.org/10.1175/1525-7541(2004)005<0487:CAMTPG>2.0.CO;2 [ Links ]
JURY MR and PATHACK BMR (1995) Climatic patterns associated with the 1992 drought over southern Africa, observations and GCM results. J. Afr. Meteorol. Soc. 2 1-7. [ Links ]
JURY MR (2012) An inter-comparison of model simulated east-west climate gradients over South Africa. Water SA 38 1-11. http://dx.doi.org/10.4314/wsa.v38i4.1 [ Links ]
JURY MR (2013) Climate trends in southern Africa S. Afr. J. Sci. 109 53-63. [ Links ]
KUMAMBALA PG and ERVINE A (2010) Water balance model of Lake Malawi and its sensitivity to climate change. Hydrol. J. 4152-162. [ Links ]
LBPTC [LIMPOPO BASIN PERMANENT TECHNICAL COMMITTEE] (2010) Joint Limpopo River Basin study, Scoping report. LBPTC, Maputo. 91 pp. URL: http://www.limcom.org/_system/writable/DMSStorage/1031en/LIMCOM2010_ScopingStudy_Eng.pdf (Accessed 15 September 2015). [ Links ]
MATSOUKAS C, BENAS N, HATZIANASTOUSIOU N, PAVLAKIS KG, KANAKIDOU M and VARDAVAS I (2011) Potential evaporation trends over land between 1983-2008: driven by radiative fluxes or vapour-pressure deficit? Atmos. Chem. Phys. 117601-7616. http://dx.doi.org/10.5194/acp-11-7601-2011 [ Links ]
NGONGONDO C, LI L, GONG L, XU C-Y and ALEMAW BF (2013) Flood frequency under changing climate in the upper Kafue River basin, southern Africa: a large scale hydrological model application. Stoch. Environ. Res. Risk. Assess. 27 1883-1898. http://dx.doi.org/10.1007/s00477-013-0724-z [ Links ]
POTTER C, ZHANG P, KLOSTER S, GENOVESE V, SHEKHAR S and KUMAR V (2004) Understanding controls on historical river discharge in the world's largest drainage basins. Earth Interactions 81-21. http://dx.doi.org/10.1175/1087-3562(2004)008<0001:UCOHRD>2.0.CO;2 [ Links ]
RIENECKER MM, SUAREZ MJ, GELARO R, TODLING R, BACMEISTER J, LIU E, BOSILOVICH MG, SCHUBERT SD, TAKACS L, KIM G-K and co-authors (2011) MERRA: NASA's Modern-Era Retrospective Analysis for Research and Applications. J. Clim. 24 3624-3648. http://dx.doi.org/10.1175/JCLI-D-11-00015.1 [ Links ]
RODELL M M, MITCHELL K, WALKER PJ, MENG CJ, GOTTSCHALCK J, LOHMANN D, HOUSER PR, JAMBOR U, ARSENAULT K, COSGROVE B and co-authors (2004) The Global Land Data Assimilation System. Bull. Am. Meteorol. Soc. 85 381-394. http://dx.doi.org/10.1175/BAMS-85-3-381 [ Links ]
SCHNEIDER U, BECKER A, FINGER P, MEYER-CHRISTOFFER A, ZIESE M and RUDOLF B (2013) GPCC's new land surface precipitation climatology based on quality-controlled in-situ data and its role in quantifying the global water cycle. Theor. Appl. Climatol. http://dx.doi.org/10.1007/s00704-013-0860-x [ Links ]
TADROSS MA, HEWITSON BC and USMAN MT (2005) The inter-annual variability of the onset of the maize growing season over South Africa and Zimbabwe. J. Clim. 18 3356-3372. http://dx.doi.org/10.1175/JCLI3423.1 [ Links ]
TALJAARD JJ (1989) Climate and circulation anomalies in the South African region during the dry summer of 1982/3. SA Weather Bureau Tech Paper 21. South African Weather Bureau, Pretoria. 45 pp. [ Links ]
TAYLOR KE, STOUFFER RJ and MEEHL GA (2012) An overview of CMIP5 and the experiment design. Bull. Am. Meteorol. Soc. 93 485-498. http://dx.doi.org/10.1175/BAMS-D-11-00094.1 [ Links ]
TYSON PD, LEE-THORP J, HOLMGREN K and THACKEREY JF (2002) Changing gradients of climate in southern Africa during the past millennium: implications for population movements. Clim. Change 52 129-135. http://dx.doi.org/10.1023/A:1013099104598 [ Links ]
UNDP (UNITED NATIONS DEVELOPMENT PROGRAMME) (2007) Limpopo Basin plan for reducing vulnerability to floods and drought. UNDP, Geneva. 25 pp. [ Links ]
VENTER FJ, SCHOLES RJ and ECKHARDT HC (2003) The abiotic template and its associated vegetation pattern. In: Du Toit JT, Rogers KH and Biggs HC (eds) The Kruger Experience: Ecology and Management of Savanna Heterogeneity. Island Press, Washington. 83-129. [ Links ]
ZHU T and RINGLER C (2010) Climate change implications for water resources in the Limpopo River Basin. IFPRI Report 00961. IFPRI, Washington, DC. 16 pp. [ Links ]
Received: 24 November 2014
Accepted in revised form 17 November 2015
* To whom all correspondence should be addressed.e-mail: mark.jury@upr.edu

