


Services on Demand
Article
 English (pdf)
 Article in xml format
 Article references
Indicators

Related links
-
 Cited by Google
 -
 Similars in Google
Share

 Permalink
Water SA
On-line version ISSN 1816-7950
Print version ISSN 0378-4738
Water SA vol.42 n.1 Pretoria Jan. 2016
http://dx.doi.org/10.4314/wsa.v42i1.18
A study of seasonal effects on metal-NOM interactions and the impact of CaCO3 precipitation potentials using Visual MINTEQ, in raw and cooling water
Heena ParshotamI, II; Gerhard GerickeII; J Catherine NgilaI; Shivani MishraIII
IDepartment of Applied Chemistry, University of Johannesburg, P.O Box 17011, Doornfontein 2028, Johannesburg, South Africa
IISustainability Department, Applied Chemistry and Microbiology, Eskom, Private Bag X40175, Cleveland, 2022, South Africa
IIINanotechnology and Water Sustainability Unit, College of Science, Engineering and Technology, University of South Africa, Florida Campus, Johannesburg, South Africa
ABSTRACT
This paper reports on a study of calcium carbonate (CaCO3) precipitation potentials of cooling water (CW) at Eskom power stations. It is important to understand the complexation reaction between calcium and dissolved organic carbon (Ca-DOC) because the natural organic matter (NOM) affects the precipitation potentials of CaCO3. Secondly, it is necessary to understand the nature of the organic matter in the cooling and raw water. This study was carried out in raw and cooling water samples collected from Lethabo and Kriel power stations. These power stations obtain their cooling water from the Vaal River and Usuthu schemes, respectively. The DOC concentration in both water systems was higher in winter (little/no rainfall) as compared to spring (more rainfall). Specific ultraviolet absorption (SUVA) was calculated for the raw and cooling water for both stations. The SUVA results obtained for the raw water (RW) indicated that the NOM had a high degree of aromaticity (humic substances), whereas for the recycled CW the NOM present was found to be less aromatic. The Visual MINTEQ data for the winter sampling indicated that both Lethabo and Kriel were supplied by raw water that was under-saturated with respect to CaCO3, with saturation indices (SI) of -0.29 and -0.43, respectively. In addition, the % Ca-DOC in the raw water at Lethabo was 2.01 compared to 3.08 in the raw water at the Kriel plant. Therefore this study gives an indication that % Ca-DOC is one of the factors that affect the CaCO3 precipitation potentials. The difference in SUVA-254 values for both stations has been identified and requires further investigation. The SUVA values help in identifying the type of fractions that make up the NOM. The interaction between calcium/magnesium and NOM determines the potential for CaCO, to form scale in condenser tubes carrying cooling water in the power generation plants at Eskom.
Keywords: cooling water, calcium-NOM complexation, precipitation potentials, SUVA, Visual MINTEQ
INTRODUCTION
The presence of natural organic matter (NOM) in raw water (RW) is mainly due to the degradation of organic substances arising from agricultural as well as human activity (Zazouli et al., 2007). Over the past 5 to 10 years, the concentration of NOM in natural water sources has greatly increased, due to an increase in domestic, industrial and agricultural activities in most catchments; raw water quality has thus deteriorated (Nkambule et al., 2012). The effects of this phenomenon have been experienced by Eskom, South Africa's national power utility.
The cooling water (CW) systems at most Eskom power stations are open evaporative wet-cooled systems. The water in these systems becomes concentrated as there is water loss due to evaporation. The chemical indicator for this concentration is generally measured by the concentration of sulphate, chloride and alkalinity. Make-up water (raw water) is added to the cooling water system to control the chemistry of the cooling system. This concentration mechanism is referred to as cycles of concentrations (COC) and is governed by the system design and the supplied raw water quality.
The identification of NOM in the raw water is important as these compounds form complexes with metals such as calcium and magnesium in the CW (Gericke, 2002; Wu et al., 2004). The metal-dissolved organic carbon (DOC) complex affects the precipitation potential of the CW as complexation with NOM will leave less of the 'free metal' in solution to cause scaling in the condenser tubes. Scaling in the condenser tubes needs to be minimized as it affects their heat transfer and efficiency (Madhav and Gericke, 2011; Wu et al., 2004; Zhou et al., 2005).
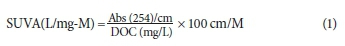
To understand the impact of NOM on CW chemistry, it is important to study the various fractions of organics in the raw and cooling water, as this enables better understanding of metal-DOC complexation and hence of the precipitation potential of the CW. NOM can generally be divided into two components, namely, hydrophobic or humic substances (HS) and hydrophilic or non-humic substances (non-HS) (Scapini et al., 2013). The specific ultraviolet absorbance at 254 nm (SUVA -254) technique is used to identify whether the water contains HS or non-HS (Hur et al., 2011; Meng et al., 2013; Nkambule et al., 2012; Zazouli et al., 2007). SUVA is calculated as follows (Nkambule et al., 2012; Selburg et al., 2011):
In general, if the SUVA-254 value is greater than 4 it is an indication that the sample contains a relatively high content of aromatic compounds such as HS. If, on the other hand, the SUVA-254 value is below 2, it is considered to indicate that the sample has a relatively low content of aromatic compounds (non-HS) (Nkambule et al., 2012). SUVA has generally been used to identify the types of organic fractions associated with DOC. In this study, it was of interest to investigate the nature of interaction between the DOC and metals such as Ca and Mg and the effects of this interaction on the saturation index (SI) in CW. We studied the metal-DOC complexation by making use of a chemical modelling program called Visual MINTEQ (Lu and Allen, 2002). We sampled the cooling water and raw water at both Lethabo and Kriel power stations. It was anticipated that metal-DOC complexation would most likely provide a better understanding of the precipitation of CaCO3, and thereby result in improved operational intervention in terms of water quality control at Eskom power stations. The study aimed to understand the complexation reaction between Ca and DOC because the NOM affects the precipitation potentials of CaCO3 and therefore scale formation inside the condenser tubes at the power stations.
EXPERIMENTAL
Sampling methodology
The raw and cooling water samples were collected in 2 000 mL clean polyethylene plastic sampling bottles using the grab sampling technique. The sample bottles were rinsed 3 times with the sample before the sample bottle was filled to capacity. Winter samples were taken daily in the first two weeks of July (2013) and spring samples were taken just after the first spring rains in October (2013) over a 2-week period on a daily basis. The pH and alkalinity of the samples were recorded at the laboratory and samples were then refrigerated immediately.
Reagents and standard solutions
All reagents were of analytical grade and Millipore water (0.05 μS/cm) was used to prepare the standards. The calibration standards were purchased from Spectrascan (South Africa) and Merck (South Africa). The following metals were purchased from Spectrascan: Al, Ba, Be, B, Cd, Cu, Fe, K, Mn, Pb, Ni, Sr and Zn. The standards for Ca, Co, Cr, Mg, Na were purchased from Merck. The alkalinity of the sample was determined by electrometric titration; 25.00 mL of the sample was titrated with a standardized solution of 0.02 N nitric acid (65%) until the end point was reached. The nitric acid was purchased from Associated Chemical Enterprises. Sodium carbonate anhydrous (99.5%, Merck) was used as the calibration standard. The buffers (pH 4, 7, 9) used for the calibration of the pH meter were obtained from Metrohm (South Africa). The quality control standard (pH 7) was obtained from Merck (South Africa). For the TOC analysis, the samples were first filtered through a 0.45 μm filter before being analysed. Potassium hydrogen phthalate (99.5%, Associated Chemical Enterprises) was used to prepare the calibration standards. The potassium hydrogen phthalate (99.5%, AR grade) used for the quality control standard was obtained from Merck. For the analysis of anions, the eluent used was a mixture of 3.5 mM anhydrous sodium carbonate (99.5%, Merck) and 1.0 mM sodium bicarbonate (99.0%, Merck). The calibration standards for the anion analyses were purchased from Merck, South Africa and these include NaF, NaNO3, NaNO2, anhydrous Na2SO4 and NaCl. For the UV254 measurements, the samples were first filtered through a 0.45 μm syringe filter (purchased from Separations). Sodium metasilicate pen-tahydrate (55.5% dry solids, AR grade, Associated Chemical Enterprises) was used to prepare the calibration standards and sodium metasilicate nonahydrate (47.5% total solids, AR grade, Associated Chemical Enterprises) was used for the quality control.
Instrumentation
The metal ions were determined using inductively coupled plasma atomic emission spectrometry (ICP). The ICP model used was a Perkin Elmer Optima, 4300 DV. Prior to analysis the samples were filtered through a 0.22 μm syringe filter (purchased from Separations, South Africa). The alkalinity and pH measurements were carried out using the Metrohm 862 compact Titrosampler. The anions in the sample were analysed using ion chromatography (IC). The IC model used was the Dionex ICS. The column used for the analyses was the Dionex IonPac AS914 (Analytical 4x250 mm) and the Guard column used was Dionex IonPac AG14 (Guard 4x50 mm). The TOC and DOC analyses were carried out on the ElementarVario. Reactive silica was analysed using the Genesys 10UV scanning spectrophotometer from Thermo Scientific.
RESULTS AND DISCUSSION
Main physico-chemical water characteristics
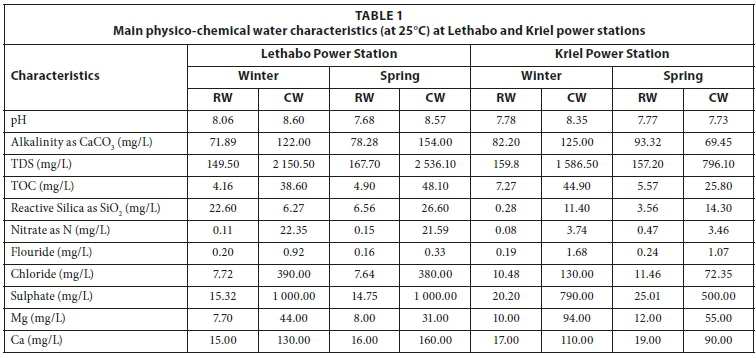
A number of physico-chemical parameters control scale-forming processes at Eskom power stations. For example, the pH and temperature are known to affect precipitation and dissolution of a number of compounds. Notably, these processes are the main causes of the scale that forms on condenser walls and will depend on the concentration of cations, anions and the DOC/TOC levels. Table 1 shows the main physico-chemical water characteristics of the raw and cooling water at Lethabo and Kriel. These power stations obtain their cooling water from the Vaal River and Usuthu schemes, respectively. These main physico-chemical parameters govern the interaction between scale-forming metals (i.e. Ca and Mg) and the anions in water to form various mineral assemblages. The models for Ca mineral phases are discussed later. The results showed that the pH in raw water at the two stations was independent of the season. In this study, therefore, the speciation of the mineral phases depended on the alkalinity, TOC and other elements in the water matrix. The cooling water exhibited higher TDS and TOC levels as compared to those in raw water, at both power stations and regardless of the season. This trend was also observed for nitrate, fluoride, chloride and sulphate levels.
The formation of insoluble mineral phases such as CaCO3 constitute scale. Calcium precipitation is influenced not just by physico-chemical parameters, but by a combination of other characteristics including the concentration of metals, anions and other electrolytes in water. It was therefore important to fully characterize the water under study and quantify the amount of Ca and Mg. As discussed later, in the modelling section ('Modelling of Ca mineral phases and complexation'), Mg and Ca form combined mineral phases which also affect CaCO3 precipitation or dissolution.
Dissolved organic carbon (DOC) and SUVA implications
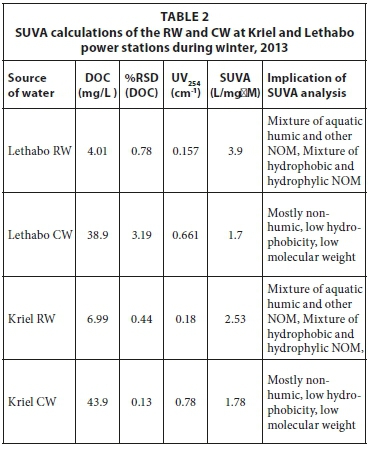
As shown in Table 2, different DOC values of the raw water (during winter) at Lethabo and Kriel power stations were obtained, i.e., 4.01 mg/L and 6.99 mg/L, respectively. Even though the concentrations of DOC in these samples were different, the SUVA values for each of these samples indicated that, in both instances, the water contained a mixture of aquatic humic substances and a mixture of hydrophobic and hydrophylic NOM. Higher SUVA values indicate the ease with which water can be clarified. The DOC concentrations increased in cooling water, i.e, to 38.9 mg/L at Lethabo and 43.9 mg/L at Kriel. This is expected because the raw water used for cooling is recycled over time. For this reason, the cooling water gets relatively more saturated with ions and suspended solids. The results of this study show lower SUVA values for CW than raw water. This indicated that the NOM composition changed to a lower degree of aromaticty (non-humic substances). The operation of the CW system, including the cycles of concentration and thermodynamic effects, has an impact on NOM in the CW. This could lead to degradation and reconstitution of smaller molecules to form different organic compounds from the ones in raw water.
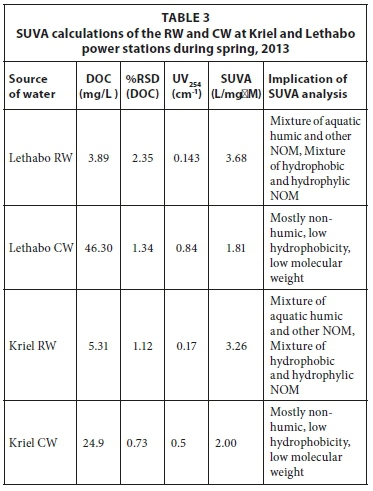
The raw water at Kriel and Lethabo was also sampled during spring (Table 3) and the concentration of DOC at Lethabo was similar to the DOC during winter (3.89 mg/L and 4.01 mg/L, respectively). At Kriel, however, the concentration of DOC in the raw water decreased during spring (5.31 mg/L) as compared to winter (6.99 mg/L). The reason for this is that during the dry season (winter) there is little or no rainfall and thus higher DOC concentrations. The early spring rains have a dilution effect on the DOC. Similar to what was observed during winter, analyses of the raw water quality during spring for both Kriel and Lethabo (from SUVA results) indicated that the water contained a mixture of both hydophobic and hydrophilic compounds. The DOC concentration in the cooling water at Kriel during spring was lower (24.9 mg/L) than in winter (43.9 mg/L). The trend for DOC concentration demonstrated in this study is similar to that observed by Nkambule and co-workers (2012) who analysed various surface waters around South Africa.
Modelling of Ca mineral phases and complexation
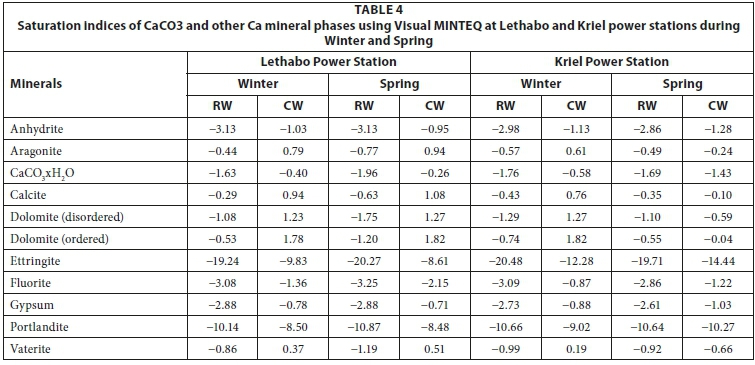
The objective of modelling was to describe scaling in terms of saturation indices of mineral phases. Saturation index calculations of scaling mineral phases were generated by the Visual MINTEQ computer code for simulative models. This was achieved by entering the values obtained experimentally for pH, temperature, alkalinity, cations and anions into the NICA-donnan database. Firstly, pH was fixed in Visual MINTEQ and the ionic strength was calculated accordingly. Secondly, all of the other parameters were inputted to the DOC (NICA-Donnan) model. Using the Davies activity coefficients, the various mineral phases were generated. Selected saturation indices for Ca and Mg phases are tabulated (Table 4).
At Lethabo Power Station, the results generated showed that dolomite (ordered and disordered), aragonite, calcite and vaterite mineral phases had positive saturation indices in cooling water during both seasons. The magnitude of the precipitation potentials of these phases was, however, different at Kriel Power Station. The relatively lower pH in the cooling water at this station decreased the potential of the CW to precipitate (form scale).
The typical cooling water system at Eskom undergoes continuous recycling processes which in turn also concentrate the organic constituents. The DOC plays an important role in sequestering the scale-forming cations. Essentially, scale formation could be reduced by decreasing the concentration of free Ca ion, as well as other ions that combine with anions to form precipitates. If Ca ion binds with organic compounds it will form discrete chemical complexes, a process that will reduce the concentration of free Ca ions in solution, hence reducing the scaling potential. In essence Ca-DOC complexes will reduce scaling. Figure 1 shows the percentage of Ca complexed to DOC in both the raw and cooling water at Lethabo and Kriel. The graph also illustrates the seasonal effect of metal-DOC complexation. These results were generated by the DOC (NICA-Donnan) database in Visual MINTEQ. For the purposes of this report:
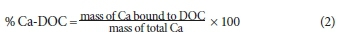
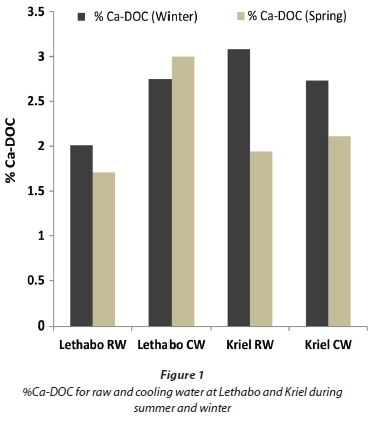
Using Formula 2 in Visual MINTEQ, the mass of Ca bound to DOC was obtained. The calculated SI in terms of CaCO3 as well as the %Ca-DOC are shown in Table 4 and Fig. 1. For SI, a negative value indicates that water is undersaturated with respect to CaCO3 and a positive value indicates that the water is oversaturated in terms of CaCO3 and has the potential to form scale. Results from Table 4 indicate that the raw water from Kriel (winter) was more undersaturated (SI = -0.43) than the raw water from Lethabo (SI = -0.29). For the CW (winter sampling), Lethabo was more oversaturated than Kriel. This data closely agrees with the results obtained for %Ca-DOC as shown in Fig. 1. The understanding is that the more Ca that complexes with DOC, the less the 'free' Ca in solution, which is required to cause scaling; this phenomenon was also observed by Khumalo (2006). Results also indicated that the %Ca-DOC in the CW at Lethabo and Kriel during winter was similar, i.e. 2.75% and 2.73%, respectively. The SI however indicated that the CW at Lethabo is slightly more over-saturated (0.94) as compared to the CW at Kriel (0.76). This indicates that CW chemistry is complex and that metal-DOC complexation is only one of the many aspects that affect the CaCO3 precipitation potentials.
The general trend during winter was that the %Ca-DOC was higher compared to that measured in summer, irrepective of the station or type of water being analysed. The implication of this observation is that Ca precipitation in CW condenser tubes is unlikely to occur in winter, whereas there is a high probability that in summer the stations will experience Ca-precipitation and hence condenser tube scaling.
CONCLUSION
In conclusion, the above study has shown that the saturation index of the cooling water decreases as the %Ca-DOC concentration increases, and hence the scale formation of the water decreases. The raw water for both Lethabo and Kriel has a higher degree of aromaticity as compared to the recycled cooling water, where the water is concentrated with dissolved solutes due to the evaporative cooling process, with repeated circulation cycles. The reason for this change in aromaticity is yet unknown and forms the basis for further research toward a better understanding of Ca-DOC complexation and the impact of specific natural organic species on the scaling potential in cooling water systems.
ACKNOWLEDGEMENTS
Ms H Parshotam wishes to thank the NRF for the bursary which was awarded for her PhD study. She also wishes to acknowledge funding from Eskom-TESP grant for Prof JC Ngila.
REFERENCES
GERICKE G (2002) A comparitive study for the removal of humic acids from power plant make-up waters. MSc thesis, University of the Western Cape. [ Links ]
HUR J, JUNG, KJ and JUNG YM (2011) Characterisation of spectoral responses of humic substances upon UV irradiation using two-dimensional correlation spectroscopy. Water Res. 45 2965-2974. http://dx.doi.org/10.1016/j.watres.2011.03.013 [ Links ]
KHUMALO TL (2006) Characterization of the natural organic matter in industrial cooling water. M.Tech thesis, University of Johannesburg. [ Links ]
LU Y and ALLEN EH (2002) Characterization of copper complexation with natural organic matter (DOM) - link to acidic moieties of DOM and competition by Ca and Mg. Water Res. 36 5083-5101. http://dx.doi.org/10.1016/S0043-1354(02)00240-3 [ Links ]
MADHAV H and GERICKE G (2011) The infuence of natural organic matter (NOM) on cooling water precipitation potentials. Eskom Research Report RES/RR/10/32724. Eskom, Johannesburg. [ Links ]
MENG F, HUANG G, YANG X, LI Z, LI J, CAO J, WANG Z and SUN L (2013) Identifying the sources and fate of anthropogenically impacted dissolved organic matter (DOM) in urbanised rivers. Water Res. 475027-5039. http://dx.doi.org/10.1016/j.watres.2013.05.043 [ Links ]
NKAMBULE TI, KRAUSE RWM, HAARHOFF J and MAMBA BB (2012) Natural organic matter (NOM) in South African waters: NOM characterisation using combined assesment techniques. Water SA 38 697-706. http://dx.doi.org/10.4314/wsa.v38i5.7 [ Links ]
SCAPINI MDC, CONZONNO VH, ORFILA JD, CHIARANDINI JP, BALZARETTI VT and CHUBURELLI AF (2013) Determination of the molar mass of the humic substances of the Chubut River (Argentina) by electrospray ionization mass spectrometry. Microchem. J.110 530-532. http://dx.doi.org/10.1016/j.microc.2013.05.017 [ Links ]
SELBURG A, VIIK MM EHAPALU K and TENNO T (2011) Content and composition of natural organic matter in water of Lake Pitkjärv and mire feeding Kuke River (Estonia). J. Hydrol. 400274-280. http://dx.doi.org/10.1016/j.jhydrol.2011.01.035 [ Links ]
WU F, EVANS D, DILLON P and SCHIFF S (2004) Molecular size distribution characteristics of the metal-DOM complexes in stream waters by high performance size-exclusion chromatography (HPSEC) and high-resolution inductively coupled plasma mass spectrometry (ICP-MS). J. Anal. Atom. Spectrom. 19 979-983. http://dx.doi.org/10.1039/b402819h [ Links ]
ZAZOULI MA, NASSERI S, MAHVI AH, MESDAGHINIA AR and GHOLAMI M (2007) Study of natural organic matter fractions in water sources of Tehran. Pak. J. Biol. Sci. 10(10) 1718-1722. http://dx.doi.org/10.3923/pjbs.2007.1718.1722 [ Links ]
ZHOU P, YAN H and GU B (2005) Competitive complexation of metal ions with humic substances. Chemosphere 58 1327-1337. http://dx.doi.org/10.1016/j.chemosphere.2004.10.017 [ Links ]
Received: 15 June 2015
Accepted in revised form 10 December 2015
* To whom all correspondence should be addressed.0+27 11 629 5124; e-mail: Heena.madhav@eskom.co.za

