


Servicios Personalizados
Articulo
 Inglés (pdf)
 Articulo en XML
 Referencias del artículo
Indicadores

Links relacionados
-
 Citado por Google
 -
 Similares en Google
Compartir

 Permalink
Water SA
versión On-line ISSN 1816-7950
versión impresa ISSN 0378-4738
Water SA vol.42 no.1 Pretoria ene. 2016
http://dx.doi.org/10.4314/wsa.v42i1.02
Efficiency evaluation of urban and rural municipal water service authorities in South Africa: A data envelopment analysis approach
Warren Brettenny*; Gary Sharp
Department of Statistics, Nelson Mandela Metropolitan University, PO Box 77000, Port Elizabeth, 6031, South Africa
ABSTRACT
In recent years the local governments in South Africa have faced numerous public protests with regard to service delivery and particularly the provision of basic services such as water and sanitation. In response, South Africa has introduced benchmarking systems (Blue Drop, Green Drop) to improve the quality of potable water and sanitation services. These systems have seen some success; however, the efficiency with which these water services are provided is yet to be assessed. This study uses data envelopment analysis (DEA) to evaluate the efficiency with which several South African water service authorities (WSAs), including both metropolitan and local municipalities, provide water services to the public in both urban and rural areas.
Keywords: efficiency, data envelopment analysis, water service provision
INTRODUCTION
The national government in South Africa has experienced a large degree of negative feedback with respect to the ability of its municipal departments and local governments to provide basic services (such as water and sanitation) to the public. This lack of delivery has led to numerous and often violent service delivery protests throughout the country. In recent years, however, the national government in South Africa has endeavoured to improve the quality and performance of water service delivery. The primary focus of the efforts has been placed on the development of two benchmarking initiatives, namely the Blue Drop and Green Drop assessments. These initiatives have seen success in both buy-in from local government and municipalities (Department of Water Affairs, 2011), as well as an improvement in the quality of the product (potable water) and service provided (Department of Water Affairs, 2012), country wide. Although these initiatives have seen success in ensuring that the water delivered to the public by water services authorities (WSAs) is of an increasingly high standard, they fail to assess the efficiency with which this is achieved. This is an important factor to consider when assessing the overall performance of the WSAs as this will indicate whether the best use of the available resources is achieved.
This study assesses the efficiency of 88 local and metropolitan municipalities in South Africa, all of which are classified as WSAs, using data envelopment analysis (DEA). The results of the study will provide an indication of which municipalities are most in need of Government intervention. Furthermore, the results will provide information which can be useful towards improving the management of municipal water services.
METHODOLOGY
The foundation and approach towards efficiency analysis was introduced by Farrell (1957). The basic concept of the non-parametric DEA approach is to use the data itself to construct a production frontier, rather than imposing a specific functional form to the frontier. In so doing, the method of DEA constructs a 'piecewise-linear, quasi-convex hull around the data points' (Greene, 2008: 112). This hull represents the production frontier against which measures of relative efficiency can be determined.
Suppose that a group of n firms each use the same l inputs Xiwhere i = 1, 2, ..., l to produce the same m outputs Yjwhere j = 1, 2, ... , m. For the sake of consistency with the related literature, firms are now referred to as decision making units (DMUs). The DMUs in this study are the 88 South African municipalities and the efficiency of each is assessed using an input orientation. An input orientation implies that the outputs of the municipalities are considered to be fixed and the most efficient municipalities will achieve the desired level of output using lowest quantity of inputs. This is the appropriate orientation for an efficiency evaluation of water service provision as the outputs of the process (water delivered, population served etc.) are fixed and the goal is to optimise the use of inputs to achieve the desired level of output. The DEA methodology discussed in what follows is based on the input orientation.
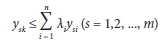
Suppose that xtkrepresents the quantity of input used by DMU k. Similarly, let yskdenote the quantity of output s produced by DMU k. The calculation of DEA efficiency estimates for the DMUs, assuming a constant returns to scale (CRS), was originally developed by Charnes et al. (1978) and is commonly referred to as the Charnes-Cooper-Rhodes (or CCR) model. The efficiency estimate for DMU k using the CCR model is found as the solution to the following linear programme (Cooper et al., 2006):
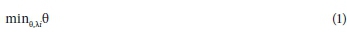
subject to
λi > 0 for all i
This set of linear equations is solved for each DMU and the solution, θ*, provides a measure of the (Farrell) efficiency of DMU k relative to the set of DMUs evaluated. That is, 1 - θ* represents the maximum radial reduction of the inputs which will still ensure that the given outputs are producible for DMU k. A DMU is deemed CCR efficient if the solution to (1) is θ* = 1 and all associated slacks are equal to zero (Cooper et al., 2006). For each assessed DMU the slacks are described as the excesses of inputs and/or shortfalls in outputs which may be required in addition to the proportional reduction in inputs by the factor θ* (Singh et al., 2011).
Under the CRS technology all participating DMUs are assumed to perform at an optimal scale (Murillo-Zamorano, 2004). Owing to many circumstances, however, this assumption is not realistic and can yield misleading results. Specifically, scale inefficiency in the CRS technology contributes to the technical inefficiency measurement (Murillo-Zamorano, 2004). A DEA model which allows for varying returns to scale (VRS) was introduced by Banker et al. (1984), and is commonly referred to as the Banker-Charnes-Cooper (BCC) DEA model. This model is formulated in the same way as Eq. (1) however, it includes the additional convexity constraint of
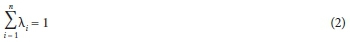
This additional constraint allows for the comparison of DMUs which operate on differing scales as it ensures that inefficient DMUs are compared against efficient DMUs which are of a similar size (Singh et al., 2011). DEA has the ability to guide bench-marking initiatives by identifying specific efficient DMUs which can act as targets for inefficient DMUs. These efficient DMUs are referred to as 'peers' for the inefficient DMUs and are the DMUs which define the efficient frontier at the point where the inefficient DMU has been projected. The ability to identify peers assists in the benchmarking procedure as it provides inefficient DMUs with a list of efficient DMUs - specific to each inefficient DMU - from which it can obtain assistance or training (or attempt to emulate).
Assessing the efficiency of DMUs using both the CCR and BCC models allows for the analysis of both scale and technical efficiencies. Let θ* denote the efficiency of DMU k using the CCR model and θ* denote the efficiency using the BCC model. According to Murillo-Zamorano (2004), θ* denotes the 'total technical efficiency' of the DMU while θ* denotes the 'pure technical efficiency'. These efficiencies are related in the following way (Murillo-Zamorano, 2004):
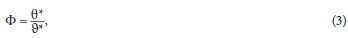
where: Φ denotes the scale efficiency of the DMU. Although the measure in Eq. (3) provides an indication of the degree of scale inefficiency, it does not indicate the type of inefficiency that is present. If Φ < 1, the source of scale inefficiency could be the production of an inefficiently small amount of output, indicating increasing returns to scale, or the production of an inefficiently large amount of output, indicating decreasing returns to scale (Fare et al., 1994). To determine the nature of the scale inefficiency, a new linear program must be solved. This linear program is formulated in the same way as the BCC-DEA model, except that the constraint in Eq. (2) is replaced with I . This constraint runs the DEA procedure under the assumption of non-increasing returns to scale, termed the NIR-DEA model with solution
  . Using the results ofthe NIR-DEA and CCR-DEA models the scale inefficiencies are classified as being due to increasing returns to scale if
  and due to decreasing returns to scale if
  (Fare et al., 1994).
DEA in water service provision
Numerous studies have investigated the efficiency of water service provision throughout the world. Singh et al. (2011) and De Witte and Marques (2010) provide good summaries of the studies that used DEA in the benchmarking and efficiency analysis of the water services sector while Berg and Marques (2011) provide a thorough survey of the literature related to the quantitative assessment of water and sanitation utilities for benchmarking purposes. This section reviews a number of these and similar studies which have used DEA to analyse efficiencies in the water sector.
The first study considered is that of Aida et al. (1998) who used DEA in the form of a range-adjusted measure of efficiency in two regions in Japan. The number of DMUs included in the study exceeded 100 and the inputs used were number of employees, operating expenses (before depreciation), net plant and equipment value, population size and length of pipes. The outputs used in the study were operating revenues and the amount of water billed net of leakage. Aida et al. (1998) used a range adjusted DEA model with an input minimisation orientation. The results of the study suggested that the DEA approach provided a useful tool for the assessment of water utility efficiencies. Aida et al. (1998) also used the method to address accountability and policy issues in the region.
In a study in England and Wales, Cubbin and Tzanidakis (1998) used a CCR-DEA model with an input orientation to evaluate efficiencies in the water industry. The input used was operating expenditure while the two outputs used were volume of water delivered and length of water mains. The additional non-controllable variable 'proportion of distribution to non-households' was also included in the study. The researchers compared the efficiency rankings of the water utilities using DEA to those obtained from a regression approach using corrected ordinary least squares (COLS). The comparison showed that, for the data considered, the rankings using DEA were significantly different to those using the regression based COLS approach.
An input-oriented CCR-DEA model was used in the United Kingdom (UK) water sector by Thanassoulis (2000b). Once again, the input used in this study was operating expenditure. The outputs used were volume of water delivered, length of water main and number of connections served. Thanassoulis (2000b) used the correlations between a number of variables to help reduce the number of outputs included in the model. The rationale behind this was that if large correlations are found between two output variables, only one of these should be considered in the DEA model.
In a study of the relative efficiency of water service providers in the Brazilian water and sewage sector, Tupper and Resende (2004) used an output-oriented BCC-DEA model using the inputs: labour expenses, operational costs (e.g. materials) and other operational costs (e.g. interest on debts); the outputs used were water produced, treated sewage, population served (treated sewage) and population served (water). This study was conducted using data for 5 years running from 1996 to 2000 and assessed 20 state utilities. Regional heterogeneities were controlled for using a Tobit model and including water loss and network densities as factors. The researchers used the results to construct cost reimbursement rules which were envisioned to inform the implementation of yardstick schemes in the region.
An input-oriented CCR-DEA model was used to determine the efficiencies of Spanish municipalities by Garcia-Valiñasa and Muñiza (2007). The input used in this study was operational costs and the outputs used were the volume of water delivered, length of water mains and population supplied with water. The researchers added the non-controllable variable, rainfall, to the DEA evaluation. This was advantageous as it gave an indication of the effect of natural circumstances on the efficiency results. The municipalities were assessed over a period of 16 years (1985-2000) and the evolution of each according to their DEA efficiency score was observed and discussed.
Berg and Lin (2008) used both the CCR-DEA and the BCC-DEA models with an input orientation to assess the efficiency of water service delivery in Peru. The inputs used were operating costs, number of employees and number of water connections and the outputs used were volume of water billed, number of customers, coverage of service and continuity of service. The purpose of including the outputs 'coverage of service' and 'continuity of service' was to bring the study in line with an already implemented government benchmarking system. Berg and Lin (2008) used the volume of water billed as opposed to the volume of water delivered as a solution to the serious water loss problem (unaccounted for water) in the area. Lastly, the input for the number of water connections was included as an indication of the capital of the assessed DMUs.
Byrnes et al. (2009) performed an efficiency assessment of wastewater utilities located in non-metropolitan areas in New South Wales and Victoria, Australia. Input-oriented CCR-DEA and BCC-DEA models were used to assess the scale and technical efficiencies of the utilities and to determine the influence of managerial factors on the assessed efficiencies. Operating expenditure was used as the input and the total volume of wastewater treated and number of complaints were used as outputs. In the second stage of the analysis, Byrnes et al. (2009) used a Tobit mode to determine the variables which contributed to the technical efficiency of the utilities. It was found that the utilities located in Victoria were 22% more efficient than similarly-sized utilities located in New South Wales in terms of pure technical efficiency. Furthermore, Byrnes et al. (2009) found that the (larger) utilities which were governed by skills-based boards tended to have higher technical efficiencies than those which operated within a local government.
De Witte and Marques (2010) performed a cross-country comparison of drinking water services using an input-oriented BCC-DEA model, with the aim to investigate the effect of incentive schemes on the provision of this service. The countries included in the study were the Netherlands, England and Wales, Portugal, Belgium and Australia. De Witte and Marques (2010) use the homogenous smoothed bootstrap method to obtain bias-corrected efficiency estimates for efficiencies of the water service providers in the countries assessed. The inputs used in the study were number of employees and the length of mains. The outputs used were water delivered and number of connections. In the second stage of the assessment, De Witte and Marques (2010) compared the use of censored and truncated Tobit models to the double bootstrap procedure to determine the influence of social, environmental and physical factors on the efficiency results. The results of the analysis showed that benchmark incentive schemes have a positive effect on efficiency.
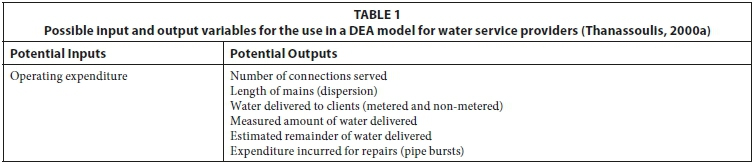
Thanassoulis (2000a) provided a review of the use of DEA in the regulation of water service providers. The suggestions for input and output variables were based on factors initially identified by the UK Office of Water Services (OFWAT) and are given in Table 1.
Using this as a basis, the number of outputs considered in the analysis could be reduced by checking the correlations between the output variables (Thanassoulis, 2000a). As mentioned previously, if two variables have a high correlation coefficient, only one of the two need be considered in the DEA model. This approach was discussed and used by Thanassoulis (2000a and 2000b).
In South Africa, little research has been conducted into the efficiency of municipal service provision. Van der Westhuizen and Dollery (2009) conducted a study of the efficiency of South African municipalities using data from 2006/2007. The researchers used DEA to determine the efficiency with which the municipalities were fulfilling their duties to provide services to the previously disadvantaged in accordance with the Reconstruction and Development Programme (RDP). The efficiency analysis used measures of both operational and staff costs as the inputs. As outputs, the researchers used the total number of houses receiving RDP electricity, water and sanitation and waste removal. The study concluded that there were significant differences in the average efficiencies for the provinces in South Africa, and a concerted effort should be made by the government to allocate resources to the worst performing provinces and municipalities.
Mahabir (2014) evaluated the efficiency of local government expenditure in South Africa using the free disposal hull (FDH) technique. The study assessed the efficiency with which South African local and metropolitan municipalities provided services to the public. The analysis was conducted using data from 2005 to 2009. The input used in the research was operating expenditure per capita and the outputs used were the number of consumer units receiving access to piped water, grid electricity, toilet facilities and refuse removal. Mahabir (2014) found that the average efficiencies achieved by the municipalities varied between 42% and 46% over the years assessed. The results indicated that the municipalities considered in this study could utilise 54 to 58% less expenditure to achieve their current output levels. The results indicated that around R286 billion in revenue was spent inefficiently over the 5-year period that was evaluated.
The South African municipal structure
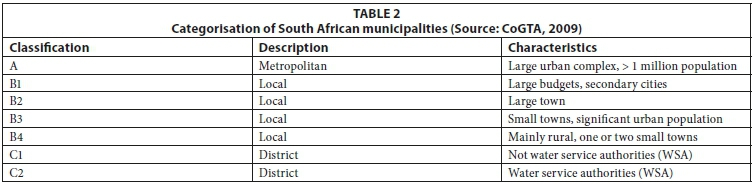
South Africa is split into 283 municipal regions, each classified as metropolitan (A), local (B) and district (C) municipalities. Local (B) and district (C) municipalities are further sub-categorised into Category B1, B2, B3, B4, C1 and C2 municipalities. The characteristics of each of these sub-categories are given in Table 2.
District municipalities (Category C) are comprised of a number of smaller local municipalities (Category B). Each district municipality is sub-categorised according to whether it is a WSA or not.
Since district municipalities are made up of a collection of local municipalities it does not make sense to include both district municipalities and local municipalities into a single DEA evaluation, as there could be an overlap of data. As such, this study evaluates the efficiencies of local and metropolitan municipalities which are WSAs (omitting district municipalities from consideration). Using this combination of municipalities will prevent overlap in the regions evaluated both by geographical boundary and by data content. Furthermore, the data available for district municipalities, particularly on the output side, were inconsistent and missing numerous data entries. This provided further justification for the omission of these municipalities.
It is important to incorporate units which are comparable in nature as this will make benchmarking for improved performance possible (Golany and Roll, 1989). Furthermore, it is necessary to compare units which are homogeneous. To this end, Golany and Roll (1989) explain that homogeneous units are those that execute the same tasks, have identical inputs and outputs and perform under the same 'market conditions'. The latter requirement is of particular importance in the public sector when service, rather than profit, is the primary goal. In order to maintain as much homogeneity in the sample as possible, while still maintaining a large enough sample size, the municipalities are spilt into 2 sections; urban and rural. Urban municipalities are those classified in Categories A, B1 and B2. Rural municipalities are those classified in Categories B3 and B4. This distinction follows from the classification given in Table 2 and the use of this classification by McKenzie et al. (2012). Using this distinction between municipality types provides a more 'like-to-like' comparison between municipalities (WSAs).
Data and variable selection
This study uses an input-oriented DEA model with operating costs as the sole input variable. This decision was based on the literature review, where it was found that extensive use of operating costs as an input variable has been made. Furthermore, this selection of the input variable is in line with the recommendation of Thannasoullis (2000a). The input orientation used in the majority of the studies is the most advisable method to use for water service providers as these utilities are required to meet a demand in the community (making the output exogenous) (Berg and Lin, 2008). As such, the ability of a WSA to limit the level of operating expenditure, while still meeting the demand for water provision, is what will determine the efficiency level of the provider.
The output variables included in the analysis were selected using a forward stepwise implementation of the efficiency contribution measure (ECM) method assuming VRS as developed by Pastor et al. (2002). The forward stepwise ECM method introduces variables into the model individually and measures the effect that the inclusion of this variable has on the observed efficiencies. If the effect (or contribution) of the variable is significant the variable is retained in the model, if not it is discarded. The significance of the contribution is determined using a nonparametric binomial test and the variable with the highest significance at each level is included in the model. This is repeated until no further variables are found to contribute significantly to the efficiency evaluation or until there are no variables left. The selection of this variable reduction method was motivated by the study of Nataraja and Johnson (2011) who compared the results of the ECM technique to other common variable reduction techniques and found that the ECM performed moderately well under all scenarios presented to it.
The ECM method requires that a fundamental model be used as a basis for the production process. Pastor et al. (2002) suggest that this basic formulation be constructed from variables which the researchers know to be fundamental to the process. These variables are fixed in the model. Thereafter, candidate variables are added to the fundamental model and, based on the results of the ECM method, are either retained or discarded. The output variable considered to be fundamental to the water distribution process is the volume of water which is delivered to the system (system input volume). The fundamental model thus contains operating costs as the sole input variable and system input volume as the output variable. The candidate variables used in the forward stepwise ECM procedure were: the size of the population served, the number of connections, the number of households, the number of units receiving free basic water and/or sanitation services and the length of the mains. These variables were chosen owing to their prevalence in the literature, their relevance in the South African context as well as the availability of data. Of these variables, the ECM method identified the number of households served as well as the number of units receiving free basic water and/or sanitation services to significantly contribute to the efficiency evaluation. The output variables included in the efficiency analysis are thus system input volume, and the number of households served, as well as the number of units receiving free basic water and/or sanitation services. Operating costs was the sole input variable.
The input and output data required were not available from a single source in South Africa. As such, multiple data sources were used in order to gather sufficient data to perform the efficiency analysis. The data required for the input variable (operating expenditure) was gathered from the StatsSA -P9115 Financial Census of Municipalities document (StatsSA, 2011a). The WRC TT522/12 report, The State of Non-Revenue Water in South Africa, by Mckenzie et al. (2012), provided detailed information on the water usage and infrastructure of each municipality for the municipal years from 2005 to 2010; this, along with the StatsSA - P9114 Non-Financial Audit of Municipalities document (StatsSA, 2011b), provided the information required for the outputs. The municipal year for which the data were collected was 2009/2010 as these were the most recent data available. There was a considerable number of missing or invalid data points. This is a result of a poor standard of record keeping at many of the South African municipalities (Mckenzie et al., 2012). The municipalities that did not have valid data for all the identified input and output variables were omitted from this study.
Of the 153 WSAs in South Africa, the data for the selected variables were only available for 88 authorities. Urban WSAs, as described above, accounted for 44 of these, while rural WSAs made up the remaining 44.
RESULTS AND DISCUSSION
All analyses were performed using the freely-available open-source statistical software R 3.1.2 (R Core Team, 2014) with the Benchmarking (Bogetoft and Otto, 2013) package. The DEA routine found optimal solutions with no convergence problems. Data were captured and sorted in Microsoft Excel 2013.
Urban water service authorities
The results of the DEA evaluation for urban WSAs are given in Table 3. It must be noted that the municipalities of Buffalo City and Mangaung were, at the time, classified as B1 municipalities and have subsequently been reclassified as metropolitan (A) municipalities. As such, this study will consider Buffalo City and Mangaung as Category A municipalities.
The assessment of the pure technical efficiency of the municipalities is represented by the DEAVRS column in Table 3. Cape Town, Johannesburg, Tshwane, Ekurhuleni and Mangaung are the metropolitan municipalities which achieved a full efficiency rating of 1, while the Matlosana (B1) as well as the Kungwini, Dihlabeng, Emakhazeni and Bela Bela (all B2) local municipalities also received a full efficiency rating. For benchmarking purposes, these municipalities could serve as best-in-class performers from which other municipalities can learn. The worst-performing municipalities according to technical efficiency are the Overstrand (B2), Msunduzi (B1), George (B1), Knysna (B2) and Metsimaholo (B2) local municipalities that all received a technical efficiency score in the region of 0.18-0.30. These are the areas which are most in need of intervention by the national and provincial government, and could arguably benefit from the implementation of an efficiency benchmarking system.
Comparing the average technical efficiency (DEAVRS) scores for the different municipal categories in Table 3, it is found that metropolitan municipalities achieve the highest average score of 0.893. The average technical efficiency steadily decreases through the categories of municipality with B1 municipalities achieving an average of 0.593 and B2 municipalities achieving an average technical efficiency of 0.567. This indicates that the technical operations of the municipalities steadily decrease in efficiency as the size and infrastructure of the municipality decreases (in an urban setting).
As for the overall efficiency of the municipalities, as indicated in the column labelled DEACRS in Table 3, it can be seen that only 4 municipalities, namely, Kungwini, Dihlabeng, Emakhazeni and Bela Bela (all B2), achieve a full overall efficiency rating. This indicates that these municipalities achieve both technical and scale efficiency. This provides additional support to the claim that scale efficiency only appears to be present in Category B2 municipalities.
Omitting the four municipalities which achieved overall efficiency, every other municipality was scale inefficient. Table 3 shows that the scale inefficiency appears to be lower for larger metropolitan municipalities and higher for smaller local municipalities. This is evidenced by the average scale efficiency for Category A municipalities being 0.377, while the averages for the B1 and B2 municipalities were 0.731 and 0.935, respectively. This indicates that while the technical efficiency of the large metropolitan municipalities is high, the corresponding scale efficiency is very low. The average scale efficiency for Category B1 and B2 municipalities is 0.731 and 0.935, respectively. This shows that as municipal size decreases, in an urban setting, the corresponding scale efficiency will increase. It is thus important for larger municipalities to focus on improving the scale of their operations, while smaller urban municipalities need to focus on improving productivity. A similar outcome was found by Singh et al. (2011) in their evaluation of urban water utilities in North India.
The last column included in Table 3 indicates the returns to scale exhibited by the scale-inefficient municipalities. All but five municipalities exhibit decreasing returns to scale which is characterised by an increase in inputs by a factor k resulting in an increase in outputs by a factor which is less than k. Fare et al. (1994) state that firms exhibiting decreasing returns to scale produce an inefficiently large amount of output. The results indicate that this is the case, at varying degrees, for the urban municipalities which are scale inefficient. However, since the outputs are demand specific and predetermined, increasing inputs (i.e. expenditure) will seldom result in an equivalent increase in outputs, thus motivating the observed results. The municipalities which demonstrate this to the largest degree, however, are the metropolitan municipalities. The decreasing returns to scale exhibited by these larger municipalities could be due to the more complex management structures in place in these municipalities.
Rural water service authorities
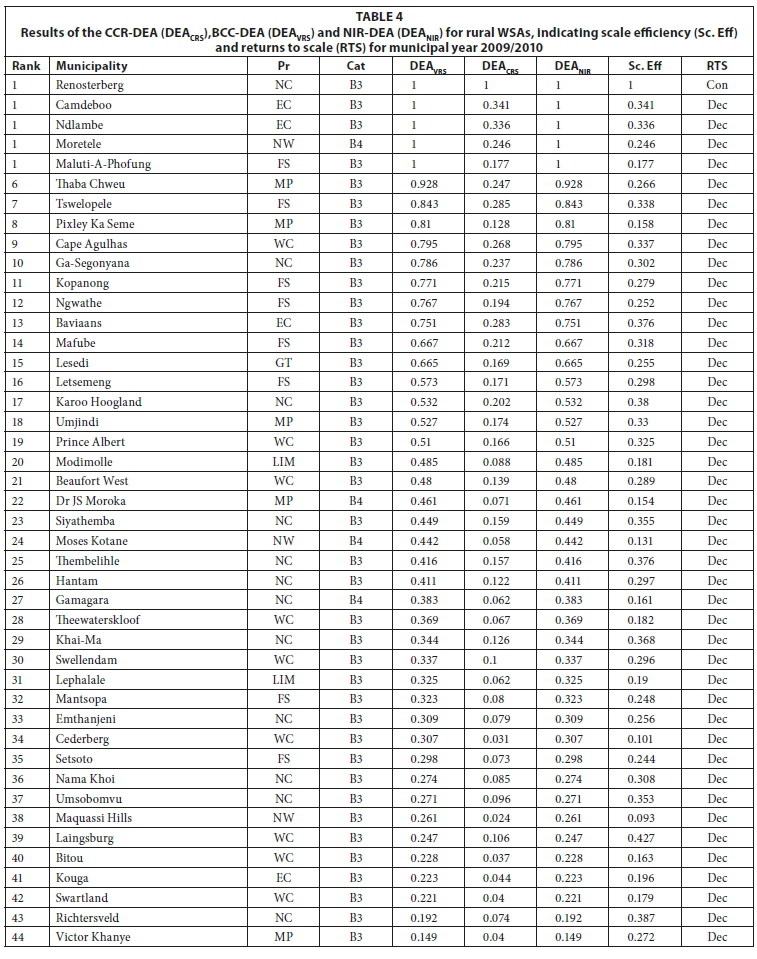
The results of the DEA evaluation for rural WSAs are provided in Table 4. Of the 44 municipalities included in this assessment only 4 were from Category B4, while the rest were Category B3 municipalities. Owing to this small number of Category B4 municipalities inferences will be limited.
The best performers in terms of technical efficiency in the rural setting were Renosterberg, Camdeboo, Ndlambe and Maluti-a-Phofung (all B3) and Moretele (B4), which were all found to be efficient in their provision of water services. These municipalities can form the basis of a benchmarking initiative by allowing inefficient municipalities to learn from their practices. The worst performers were Richtersveld and Victor Khanye (both B3) which achieved efficiency scores of less than 0.20.
The only municipality to achieve overall efficiency was Renosterberg (B3). Furthermore, the scale efficiencies provided in Table 4 show, excluding Renosterberg, the highest scale efficiency achieved is 0.428. This is a point of concern and needs to be addressed. The rural municipalities exhibit decreasing returns to scale in all cases of scale inefficiency. As before, this can plausibly be attributed to the fact that these WSAs serve a demand and thus an increase in the inputs to serve this demand would not necessarily result in an equivalent increase in output.
Input targets
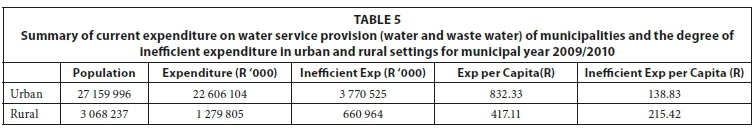
The degree of inefficient expenditure present in both the urban and rural evaluations is presented in Table 5. Table 5 is constructed using the input targets as identified by the BCC-DEA method described, so as to correct for technical inefficiencies present at the municipalities.
For the urban municipalities included in the assessment, the average expenditure for water service provision per capita in the municipal year 2009/2010 was R823.33. In order for this to be an efficient expenditure, the expense per capita should decrease by R138.83. Efficient expenditure for water service provision per capita is thus R693.50. This amounts to a total of R3 770 525 000 of inefficient expenditure for the municipalities assessed.
Similarly, the rural municipalities assessed provided water services at an average cost of R417.11 per capita for the period in question. For the rural municipalities to achieve efficient expenditure, an average expenditure of R201.69 per capita should be the target. This amounts to inefficient expenditure of R 660 964 000.
These figures provide an indication of the task ahead for the municipalities should the intention be efficient provision of water services. This form of analysis can provide useful insight into the expenditure on water service provision and possibly assist with planning and water tariff adjustments.
CONCLUSION
From the results it can be seen that, in general, South Africa is performing adequately in terms of relative technical efficiencies. As one would expect there are a number of both excellent and poor performers. Splitting the efficiency evaluation to compare similar municipalities (urban and rural) allows for more homogenous samples and thus more relevant DEA results.
The performances yielded an average technical efficiency of 0.636 for urban municipalities and 0.526 for rural municipalities. This indicates that, on average, approximately 36.4% less expenditure can be used in urban municipalities and approximately 47.4% less expenditure can be used in rural municipalities to achieve the given levels of water service delivery nationwide. These results indicate a superior performance of municipalities than the results of Mahabir (2014), in which all services of the municipalities were assessed using FDH. Mahabir (2014) found that an average efficiency of approximately 45% can be expected for municipalities over the years assessed. The results of the current study indicate a higher efficiency; however, this study considers water services provision of municipalities only and uses a DEA technique.
In a country where there is pressure from the public to provide many basic services, adequate use of resources is imperative. A reduction in the resource usage of one sector could allow for increased resource allocation to another. The government and local authorities need to address this inefficient use of resources at both levels, with particular effort required in the rural areas. Inefficient expenditure in the amount of R 4.4 billion was found in the assessed WSAs in South Africa for 2009/2010. There is thus a large scope for improvement in this sector and DEA provides a tool which can assist in benchmarking efforts in this sector. The identification of best-in-class performers aids the benchmarking process by providing a set of peers from which poor performers can learn.
This study provides a single approach to the analysis of efficiency in the South African water sector, namely DEA. Other approaches such as the parametric stochastic efficiency analysis (SFA) and free disposal hull (FDH) techniques could be used to expand on this study. SFA is the most widely used parametric approach to efficiency analysis. Analysis using this approach requires assumptions of the functional form of the production function as well as the distribution of the inefficiency term (typically positively skewed). Analysis of the current data using this technique may be useful for comparative purposes. These provide avenues for future research in this field. This study evaluates the efficiency of water service provision in South Africa for a single municipal year. An evaluation of the efficiency of water service provision in South Africa over time would be particularly helpful as it would provide an indication of the improvement/deterioration of specific municipalities over an extended time period. This would allow for more targeted intervention and improvement efforts. This is another area for further work.
A potential limitation of this study is the exclusion of district municipalities from consideration. District municipalities in South Africa are classified by their activity as a WSA, and as such the inclusion of these municipalities would provide valuable information. Future studies should aim to include these municipalities, provided that reliable data are available. A further limitation to this study, as with many studies of the South African municipalities, is both the availability and validity of the data. Data provided by the municipalities is not always reliable and accurate and as such the reported results could be subject to substantial variation. The introduction of benchmarking schemes among municipalities has improved the standard of record keeping; however, more work is required.
REFERENCES
AIDA K, WILLIAM W, JESÚS T and TOSHIYUKI S (1998) Evaluating water supply services in Japan with RAM: a range-adjusted measure of efficiency. Omega 26 (2) 207-232. http://dx.doi.org/10.1016/S0305-0483(97)00072-8 [ Links ]
BANKER R, CHARNES A and COOPER W (1984) Some models for estimating technical and scale inefficiencies in data envelopment analysis. Manage. Sci. 30 (9) 1078-1092. http://dx.doi.org/10.1287/mnsc.30.9.1078 [ Links ]
BANKER R, CHARNES A, COOPER W, SWARTS J and THOMAS D (1989) An introduction to data envelopment analysis with some of its models and their uses. Res. Gov. Nonprofit Account. 5 125-163. [ Links ]
BERG S and LIN C (2008) Consistency in performance rankings: the Peru water sector. Appl. Econ. 40 (6) 793-805. http://dx.doi.org/10.1080/00036840600749409 [ Links ]
BERG S and MARQUES R (2011) Quantitative studies of water and sanitation utilities: a benchmarking literature survey. Water Polic. 13 (5) 591-606. http://dx.doi.org/10.2166/wp.2011.041 [ Links ]
BOGETOFT P and OTTO L (2013) Benchmarking with DEA and SFA. R package version 0.23. [ Links ]
BYRNES J, CRASE L, DOLLERY B and VILLANO R (2009) An analysis of the relative efficiency of wastewater utilities in non-metropolitan New South Wales and Victoria. Australas. J. Regional Stud. 15 (2) 153-169. [ Links ]
CHARNES A, COOPER W and RHODES E (1978) Measuring the efficiency of decision making units. Eur. J. Oper. Res. 2 (6) 429-444. http://dx.doi.org/10.1016/0377-2217(78)90138-8 [ Links ]
CoGTA (DEPARTMENT OF COOPERATIVE GOVERNANCE AND TRADITIONAL AFFAIRS, SOUTH AFRICA) (2009) State of Local Government in South Africa, Overview Report: National State of Local Government Assessments. Working Paper. Department of Cooperative Governance and Traditional Affairs, Pretoria. [ Links ]
COOPER WW, SEIFORD, LM and TONE K (2006) Introduction to Data Envelopment Analysis and Its Uses: With DEA-Solver Software and References. Springer Science+Business Media, Inc. [ Links ]
CUBBIN J and TZANIDAKIS G (1998) Regression versus data envelopment analysis for efficiency measurement: an application to the England and Wales regulated water industry. Utilities Polic. 7 (2) 75-85. http://dx.doi.org/10.1016/S0957-1787(98)00007-1 [ Links ]
DE WITTE K and MARQUES RC (2010) Designing performance incentives, an international benchmark study in the water sector. Cent. Eur. J. Oper. Res. 18 (2) 189-220. http://dx.doi.org/10.1007/s10100-009-0108-0 [ Links ]
DEPARTMENT OF WATER AFFAIRS (SOUTH AFRICA) (2011) 2011 Green Drop Report. URL: http://www.ewisa.co.za/misc/BLUE_GREENDROPREPORT/GreenDrop2011.htm (Accessed 11 August 2014). [ Links ]
DEPARTMENT OF WATER AFFAIRS (SOUTH AFRICA) (2012) 2012 Blue Drop Report. URL: http://www.dwaf.gov.za/Documents/BD2012/Intro.pdf (Accessed 11 August 2014). [ Links ]
FARE R, GROSSKOPF S and LOVELL CK (1994) Production Frontiers. Cambridge University Press. [ Links ]
FARRELL MJ (1957) The measurement of productive efficiency. J. R. Stat. Soc. Ser. A Gen. 120 (3) 253-290. http://dx.doi.org/10.2307/2343100 [ Links ]
GARCÍA-VALNASA MA and MUNIZA MA (2007) Is DEA useful in the regulation of water utilities? A dynamic efficiency evaluation of water utilities. Appl. Econ. 39 (2) 245-252. http://dx.doi.org/10.1080/00036840500428054 [ Links ]
GOLANY B and ROLL Y (1989) An application procedure for DEA. Omega 17 (3) 237-250. http://dx.doi.org/10.1016/0305-0483(89)90029-7 [ Links ]
GREENE WH (2008) The economic approach to efficiency analysis. In: Fried HO, Knox Lovell CA and Schmidt SS (eds) The Measurement of Productive Efficiency and Productivity Growth. Oxford University Press, New York. http://dx.doi.org/10.1093/acprof:oso/9780195183528.003.0002 [ Links ]
MAHABIR J (2014) Quantifying inefficient expenditure in local government: a disposal free hull analysis of a sample of South African municipalities. S. Afr. J. Econ. 82 (4) 493-517. http://dx.doi.org/10.1111/saje.12050 [ Links ]
MCKENZIE R, SIQALABA ZN and WEGELIM WA (2012) The state of non-revenue water in South Africa (2012). WRC Report No. TT 522/12, Water Research Commission, Pretoria. [ Links ]
MURILLO-ZAMORANO LR (2004) Economic efficiency and frontier techniques. J. Econ. Surv. 18 (1) 33-77. http://dx.doi.org/10.1016/j.ejor.2011.06.045 [ Links ]
NATARAJA NR and JOHNSON AL (2011) Guidelines for using variable selection techniques in data envelopment analysis. Eur. J. Oper. Res. 215 (3) 662-669. http://dx.doi.org/10.1016/j.ejor.2011.06.045 [ Links ]
PASTOR JT, RUIZ JL and SIRVENT I (2002) A statistical test for nested radial DEA models. Oper. Res. 50 (4) 728-735. http://dx.doi.org/10.1287/opre.50.4.728.2866 [ Links ]
R CORE TEAM (2014) R: A language and environment for statistical computing. R Foundation for Statistical Computing. Vienna, Austria. URL: http://www.R-project.org/. [ Links ]
SINGH MR, MITTAL AK and UPADHYAY V (2011) Benchmarking of North Indian urban water utilities. Benchmarking Int. J. 18 (1) 86-106. http://dx.doi.org/10.1108/14635771111109832 [ Links ]
STATSSA (2011a) P9114 - Financial Census of Municipalities 2010/2011. URL: http://www.statssa.gov.za/publications/statspast-future.asp?PPN=P9114 (Accessed 27 February 2013). [ Links ]
STATSSA (2011b) P9115 - Non-Financial Census of Municipalities 2010/2011. URL: http://www.statssa.gov.za/publications/statspast-future.asp?PPN=P9115 (Accessed 27 February 2013). [ Links ]
THANASSOULIS E (2000a) DEA and its use in the regulation of water companies. Eur. J. Oper. Res. 127 (1) 1-13. http://dx.doi.org/10.1016/S0377-2217(99)00436-1 [ Links ]
THANASSOULIS E (2000b) The use of data envelopment analysis in the regulation of UK water utilities: Water distribution. Eur. J. Oper. Res. 126 (2) 436-453. http://dx.doi.org/10.1016/S0377-2217(99)00303-3 [ Links ]
TUPPER HC and RESENDE M (2004) Efficiency and regulatory issues in the Brazilian water and sewage sector: an empirical study. Utilities Polic. 12 (1) 29-40. http://dx.doi.org/10.1016/j.jup.2003.11.001 [ Links ]
VAN DER WESTHUIZEN G and DOLLERY B (2009) Efficiency measurement of basic service delivery at South African district and local municipalities. TD: J. Transdisciplinary Res. South. Afr. 5 (2) 162-174. [ Links ]
Received: 12 February 2015
Accepted in revised form 12 November 2015
* To whom all correspondence should be addressed. 041 504 2895; e-mail: warren.brettenny@nmmu.ac.za

