


Services on Demand
Article
 English (pdf)
 Article in xml format
 Article references
Indicators

Related links
-
 Cited by Google
 -
 Similars in Google
Share

 Permalink
Water SA
On-line version ISSN 1816-7950
Print version ISSN 0378-4738
Water SA vol.41 n.5 Pretoria Oct. 2015
http://dx.doi.org/10.4314/WSA.V41I5.14
SHORT COMMUNICATION
Conductivity as an indicator of surface water quality in the proximity of ferrochrome smelters in South Africa
MM Loock; JP Beukes; PG van Zyl
Chemical Resource Beneficiation, North-West University, Potchefstroom Campus, Private Bag X6001, Potchefstroom, 2520, South Africa
ABSTRACT
South Africa is one of the leading ferrochrome (FeCr) producing countries. One of the main environmental and health-related issues associated with FeCr production is the possible generation of Cr(VI). However, Cr(VI) is not the only potential pollutant that has to be considered during FeCr production. Various water-soluble species are present in FeCr waste materials and in process water. Considering the size of the South African FeCr industry and its global importance, it is essential to assess the extent of potential surface water pollution in the proximity of FeCr smelters by such water-soluble species. In this study water conductivity was measured as a proxy of general water quality. Although deposition was not measured, comparison of surface water results indicated that atmospheric deposition of pollutants originating from FeCr smelting did not significantly impact surface water quality, but that surface run-off and/or groundwater leaching were the main contributors. At two FeCr smelters it was observed that these smelters did not impact surface water quality negatively. In contrast, surface water pollution originating from at least four FeCr smelters was apparent. However, only at one smelter did pollution result in surface water conductivity that indicated a water quality not fit for human consumption. No correlations could be made between potable water quality and possible pollution from FeCr smelters. Notwithstanding this limitation, it was found that potable water sampled at all sites complied with the conductivity criteria for human consumption.
Keywords: surface water, ferrochromium, South Africa, conductivity, elemental composition of total dissolved solids (TDS), potable water
INTRODUCTION
South Africa is one of the leading ferrochrome (FeCr) producing countries (ICDA, 2013; Beukes et al., 2012), since the country possesses approximately three quarters of the world's viable chromium ore (chromite) deposits (Murthy et al., 2011; Cramer et al., 2004). FeCr is mainly produced during pyrometallurgi-cal carbo-thermic reduction of chromite in submerged arc furnaces (SAFs) and direct current arc furnaces (DCFs) (Beukes et al., 2010). One of the main environmental and health-related issues associated with FeCr production is the possible generation of Cr(VI). Since it is impossible to completely exclude oxygen from all high-temperature FeCr production steps, Cr(VI)-containing species can be unintentionally generated in small amounts (Beukes et al., 2010; Mandiwana et al., 2007). In a recent paper by Loock et al. (2014) the possible Cr(VI) contamination of surface water in the proximity of FeCr smelters in South Africa was investigated. These authors indicated that, in general, surface water was not consistently contaminated with Cr(VI) at all FeCr smelters, but that surface water quality near some FeCr smelters is of concern. Additionally, potable water was also collected close to the FeCr smelters to support the surface water results obtained. It was found that Cr(VI) levels in the potable water near one of the smelters were of concern.
Cr(VI) is, however, not the only potential pollutant of surface-, ground- and potable water that has to be considered in relation to FeCr production. As an example, Riekkola-Vanhanen (1999) indicated that FeCr furnace off-gas dust potentially contains many water-soluble heavy metals, while closed-furnace off-gas venturi water sludge specifically also contains cyanides. Water-soluble species such as sulphate (SO42-) and chloride (Cl-) are also added to process water during the treatment of Cr(VI)-containing wastes (Beukes et al., 2012). The presence of water-soluble species in FeCr production wastes and process water does not automatically imply that aqueous systems around such smelters will be polluted. FeCr waste materials, e.g., bag-filter dust, venturi sludge and slag, are mostly stored on fit-for-purpose waste facilities designed to prevent environmental pollution. Water draining from such waste facilities (e.g. slimes dams) and process water is usually kept in a closed loop. However, leakages from the afore-mentioned systems might occur. Additionally, historic groundwater contamination, which could migrate slowly, can also result in environmental aqueous systems being polluted.
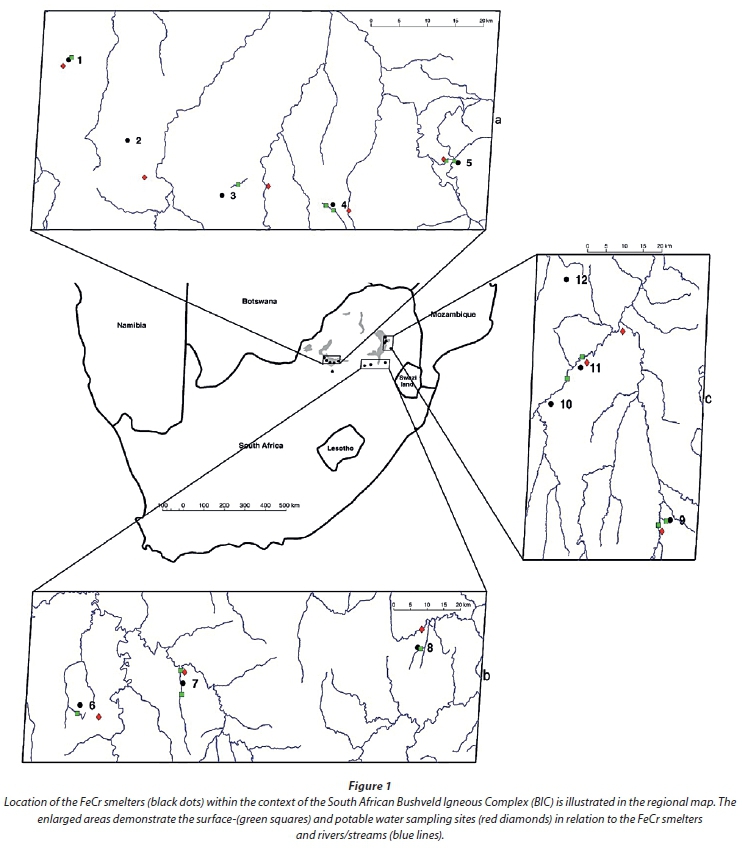
Considering the above-mentioned context, it would be ideal to include all possible pollutant species in a study on the contamination of aqueous systems around FeCr smelters. Such investigations are likely to have been conducted for relatively new smelters for which environmental impact assessments (EIAs) were required, or for older FeCr smelters during the application for water use licences. However, this information is usually not available in the peer-reviewed literature. Considering the size of the South African FeCr industry and its global importance, it is essential to have such data available. In order to, at least partially, address this knowledge gap, conductivity of surface water was investigated in the proximity of most FeCr smelters in South Africa. The primary focus of this paper was to investigate surface water pollution, but potable water was also collected in the proximity of the selected FeCr smelters. The sampling sites selected correlated with those that Loock et al. (2014) introduced. Figure 1 illustrates a regional map indicating the extent of the chromite ore deposits in South Africa, as well as the locations of FeCr smelters that are shown in the enlarged sections of Fig. 1, i.e., 1a, 1b and 1c.
EXPERIMENTAL
Reagents
Ultra-pure water (resistivity 18.2 Mfl-cm-1), produced by a Milli-Q water purification system, was used for cleaning equipment and sampling containers. Conductivity calibration solutions of 12 880 μS/cm and 1 413 μS/cm at 25°C (Hanna instruments) were used to calibrate the conductivity meter prior to each sample collection campaign.
Sampling site selection and sampling duration
The objective of this study was to assess the general water quality of surface water in the vicinity of FeCr smelters in South Africa. Currently South Africa has 14 different FeCr smelters (Beukes et al., 2012) - 13 located in or close to the chromite deposits in the Bushveld Igneous Complex (BIC) and one located close to the east coast (Fig. 1). Samples were collected at sites identified by Loock et al. (2014), who critically evaluated several criteria (personal safety during sampling collection, accessibility, logistical, drainage patterns, etc.) to identify the best suited sampling sites. Implementation of the afore-mentioned criteria resulted in the collection of surface- and potable water samples in the proximity of 10 and 11 FeCr smelters, respectively.
In order to relate the sampling site location to the results obtained, the various FeCr smelters were numbered 1 to 12, as shown in Figs. 1a, 1b and 1c. Surface and potable water sampling sites were numbered accordingly, i.e., correlating to the number of the closest FeCr smelter. At Smelters 4, 5, 7 and 9 (Fig. 1) two surface water sampling sites were located at each smelter, which were distinguished by indicating them as sampling sites 'a' and 'b'.
The sampling sites were all located in the geographical area commonly referred to as the South African Highveld. Laakso et al. (2012), with references therein, provided a concise description of the meteorological conditions over the South African Highveld. Almost all precipitation on the South African Highveld occurs during the wet season (middle October to April), with virtually no precipitation taking place during the dry season (May to middle October). These strong seasonal cycles could lead to bias if samples were collected only in a specific season. To limit seasonal bias, sampling was conducted monthly for almost a full year, i.e., March 2011 to January 2012.
Sampling and analytical procedures
The first step during sampling at any given site consisted of collecting a 1 I sample in a Schott Duran glass bottle. The collected samples were then divided into several 100 ml portions. Some of these portions were used for Cr(VI) analysis, as discussed in Loock et al. (2014). 15 ml of one 100 ml sampled portion was then used for the determination of conductivity with a Hanna instrument HI 255 combined meter with a HI 76310 electrode. The remaining 85 ml was evaporated in an oven at 100°C so that scanning electron microscopy incorporated with energy dispersive X-ray spectroscopy (SEM-EDS) analysis could be done to identify the elemental composition of the total dissolved solids (TDS) portion. A FEI QUANTA FEQ 250 ESEM, integrated with an OXFORD INCA X-Sight 200 EDS system operating with a 15kV electron beam at a working distance of 10 mm was used. Sample preparations for the SEM-EDS analyses consisted of mounting the precipitate on buttons covered with carbon tape.
RESULTS AND DISCUSSION
Surface water
In Fig. 2 the mean, minimum and maximum conductivity values measured at the surface water sampling sites in the proximity of FeCr smelters (Fig. 1) for the entire sampling period are presented. As is evident from these data, there are significant differences in the conductivity values measured at the various sites. To facilitate the discussion of these results, it is necessary to consider possible conductivity ranges that suit specific applications. Various references indicate different conductivity ranges that are suitable for specific water use applications (e.g. Anderson et al., 1999; DWAF, 1996). Of these references, Anderson et al. (1999) gave one of the most comprehensive breakdowns in terms of conductivity ranges for defined water use applications. According to these guidelines (Anderson et al., 1999), conductivity values of 0 - 800 μS/cm can be used for human consumption and irrigation. However, if the conductivity is higher than 300 μS/cm, care must be taken during the irrigation of plants sensitive to higher salt levels. Conductivities between 800 and 2 500 μS/cm are still suitable for human consumption, while irrigation at these levels should be managed to minimise plant damage. Levels between 2 500 and 10 000 μS/cm are not recommended for human consumption. Salt-tolerant crops can be irrigated using water with conductivities of up to 6 000 μS/cm. Most livestock can consume water with levels of up to 10 000 μS/cm, but conductivity levels in the drinking water of poultry and pigs should be limited to 6 000 μS/cm. Considering the afore-mentioned conductivity criteria, the surface water conductivity results in Fig. 2 were divided into 4 categories, i.e., 0 - 300, 300 - 800, 800 - 2 500 μS/cm and above 2 500 μS/cm, respectively. These ranges are separated in Fig. 2 by the three lines indicated at 300, 800 and 2 500 μS/cm.

Surface water conductivity range: 0 - 300 μS/cm
According to the above-mentioned categorisation, the average conductivity at surface water sampling sites 1, 4a, 8 and 9b can be regarded as suitable for all water use applications (Anderson et al., 1999). The spread of conductivity levels at these sites was also relatively small (Fig. 2). The water sampled at surface water sampling site 1 drained directly out of the property of FeCr Smelter 1 (Fig. 1). Also, surface water sampling site 8 was positioned to capture possible seepage and run-off from Smelter 8. These two results therefore seem to indicate that Smelters 1 and 8 do not influence the surface water quality at sampling sites 1 and 8 to a significant extent. Sampling site 4a was positioned upstream from Smelter 4, while Site 9b was located on a separate branch of a perennial river not directly impacted by Smelter 9. Although atmospheric deposition was not specifically measured, comparison of the results for these two sites indicates that deposition of pollutant species released by Smelters 4 and 9 does not significantly impact the aforementioned sampling sites.
Surface water conductivity range 300 - 800 μS/cm
The average conductivity at surface water sampling sites 5a, 7a, 10 and 11 fell within the category that can be regarded as suitable for all water use applications, except for the irrigation of plants sensitive to higher salt levels (Anderson et al., 1999). The conductivity values of surface water sampling sites 5a, 10 and 11 had small spreads (Fig. 2), which indicated that seasonal cycles (e.g. rain) had little effect, nor did any large spillages from these smelters occur. Site 5a was located in a cement-lined waterway near Smelter 5. The lining of this waterway limited possible sources of water quality impacts to atmospheric deposition and/or upstream pollution. The acceptable status of the water according to the considered conductivity criteria applied indicated that atmospheric deposition from pollutant species from FeCr Smelter 5 did not significantly impact the water quality.
Since the surface water at Sites 10 and 11 was considered to be acceptable for all applications, except for the irrigation of plants sensitive to higher salt levels, it is likely that atmospheric deposition from Smelters 10 and 11 also did not impact water quality significantly. Sampling sites 10 and 11 were in a perennial river near Smelters 10 and 11, implying that groundwater seepage could also play a role. However, the satisfactory status of the surface water indicated that groundwater seepage and surface water run-off from Smelters 10 and 11 does not significantly impact on general surface water quality.
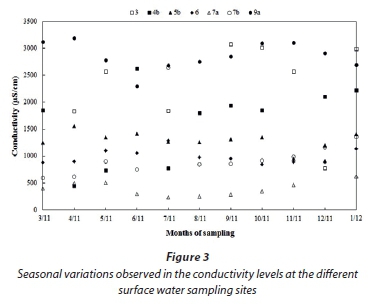
Sampling site 7a was in perennial stream, located upstream from Smelter 7. The larger spread of the conductivity values at Site 7a indicated possible seasonal variations. The seasonal variations observed in the conductivity levels at this site, as well as other sites for which seasonal cycles possibly occur, are presented in Fig. 3. The data (Fig. 3) indicate that the conductivity levels at surface water sampling site 7a are lower in the drier months of June-October and higher in the rainy season months, notwithstanding higher volumes of water in this stream during the rainy season. It is therefore highly likely that surface run-off and/or seepage upstream from Site 7a, and not Smelter 7, are responsible for the higher conductivity levels during the rainy season. Several opencast coal mines and large coal-fired power stations occur in this geographical area that could potentially serve as pollution sources (Lourens et al., 2011). The surface chemical composition (SEM-EDS) of the total dissolved solids (TDS) remaining after all samples were evaporated is presented in Fig. 4a, while Fig. 4b indicates the same data normalised excluding oxygen (O). Although TDS was not specifically measured in this study, there is usually a direct correlation between conductivity and TDS (e.g. Paul and Sen, 2012; Atekwana et al., 2004; McNeil and Cox, 2000). The elemental composition of the TDS at Site 7a shows relatively high levels of sulphur (S), which cannot be attributed to natural sources. Josipovic et al. (2009 and 2011) indicated that S wet and dry deposition on the Mpumalanga Highveld is higher than in any other region in South Africa, mainly due to the occurrence of numerous large atmospheric point sources in this region (e.g coal-fired power stations). It is therefore likely that the aforementioned atmospheric deposition will contribute to higher conductivity levels in the rainy season due to surface water run-off from the catchment area of Site 7a. Additionally, run-off and/or seepage from non-atmospheric pollutions sources (e.g. coal mines) upstream of surface water site 7a could also make a significant contribution in the rainy season.
Surface water conductivity range 800 - 2 500 μS/cm
Surface water sampling sites 3, 4b, 5b, 6 and 7b can be regarded as suitable for all consumptive water uses, but irrigation of plants should be managed to minimise damage (Anderson et al., 1999).
The conductivity values for surface water sampling sites 3, 4b and 7b had large spreads (Fig. 2) that could be due to seasonal cycles or spillages from the smelters. The conductivity data in Fig. 3 indicates no correlation to season cycles for any of these sites. Although seasonal cycles could therefore contribute to the spread of the conductivity data at these three sites, seasonal cycles cannot fully explain the large spreads. All of these sites, i.e., 3, 4b and 7b, are located downstream from the respected FeCr smelters and will capture any spillages and/ or seepage. When comparing the conductivity values of surface water sampling sites 4a (upstream of Smelter 4) and 4b (down-stream of Smelter 4), as well as 7a (upstream of Smelter 7) and 7b (downstream of Smelter 7), significant differences in the conductivity values are observed (Fig. 2). Additionally, if the elemental compositions of the TDS at Site 4b are compared to Site 4a (Fig. 4) an increase in the percentage of S and Cl can be observed, which can be associated with the wastewater of FeCr production (Beukes et al., 2012). As indicated earlier, surface water site 7a is already impacted upstream of the sampling site. Additionally, the elemental compositions of the TDS for this site did not differ significantly from those for Site 7b. Considering all the afore-mentioned discussions it can therefore be stated that it is likely that the higher and larger spread in conductivity values measured at Sites 3, 4b and 7b can be attributed to the impact of the respective smelters.


Surface water sampling sites 5b and 6 had smaller spreads in the conductivity values than Sites 3, 4b and 7b (Fig. 2), but these were still large enough to warrant exploration thereof. The conductivity values at both surface water sampling sites were variable, but did not indicate a significant correlation to seasonal cycles (Fig. 3). Both Site 5a and Site 5b are located close to FeCr Smelter 5 (Fig. 1), with the only difference between the two sampling sites being that 5a is a cement-lined waterway while 5b is an unlined river. As indicated earlier, Site 5a was minimally impacted by atmospheric deposition from FeCr Smelter 5. Therefore it is likely that Site 5b would also not be impacted in such a way. Surface water pollution at 5b (unlined river) can consequently only be as a result of run-off and/or seepage. The difference between the conductivity values at Sites 5a and 5b (Fig. 3) demonstrates that there is a pollution source only affecting the river, thus implicating FeCr Smelter 5.
Sampling site 6 was located near FeCr Smelter 6, but not in a stream flowing directly to or from the smelter (Fig. 1). Additionally, several other large industries, as well as semi-formal and informal settlements, were located nearby. The authors also observed raw sewage running into the river on several occasions. Therefore it is impossible to relate the results in a systematic manner to FeCr Smelter 6.
Surface water conductivity above 2 500 μS/cm
According to the conductivity criteria applied, surface water at sampling site 9a is not recommended for human consumption (Anderson et al., 1999). The larger spread of conductivity values at Site 9a (Fig. 2) indicated that seasonal cycles and/or pollution from Smelter 9 might have an influence. The conductivity data for this site did not indicate a conclusive seasonal cycle (Fig. 3). However, comparison of conductivity levels between Site 9b (in a perennial river not directly impacted by Smelter 9) and Site 9a (in a stream running directly from the Smelter 9) indicated very clearly that the elevated levels of conductivity observed at 9a are a direct result of groundwater seepage and/or surface water run-off pollution from Smelter 9. The differences in the elemental composition of the TDS at sampling sites 9a and 9b (Fig. 4a and 4b) is also apparent.
Potable water
The mean, minimum and maximum conductivity values measured at the potable water sampling sites in the proximity of FeCr smelters (Fig. 1) during the entire sampling period are presented in Fig. 5. As for the investigations of surface water, the conductivity criteria suggested by Anderson et al. (1999) were applied. These category ranges are shown in Fig. 5 by the two lines indicated at 300 and 800 μS/cm.

In discussing the surface water sampling site results, the possible impacts of the various FeCr smelters could be explored, since the results could be contextualised using upstream and downstream measurements near certain smelters, as well as from streams running directly from smelters vs. streams not directly impacted. However, it is impossible to deliberate about the potable water conductivity results in a similar manner. Additionally, the source at a specific potable water site was not always known. As an example, groundwa-ter that is commonly used as potable water in the Steelpoort valley has a high natural conductivity (Loock-Hattingh et al, 2015; Loock et al., 2014). Therefore, it would be preposterous to propose linkages between potable water conductivity and pollution originating from the various FeCr smelters. The only factual deduction that can be made from the data presented in Fig. 5 is that the potable water measured at all sites complied with the conductivity criteria proposed for human consumption (Anderson et al., 1999).
CONCLUSIONS
To the knowledge of the authors, this study is the first relatively comprehensive survey of surface water conductivity in the proximity of FeCr smelters in South Africa. In this study water conductivity was used as a proxy for general water quality, with application of the conductivity criteria suggested by Anderson et al. (1999). Obviously this approach has limitations, but the data compiled will help to close the current knowledge gap on the influence of FeCr production on water quality.
The results indicated that atmospheric deposition of pollutants originating from FeCr smelting did not significantly impact surface water quality. At certain FeCr smelters (e.g. Smelters 1 and 8) surface water sampling sites, which would have been impacted if surface run-off and/or seepage occurred from the relevant smelters, did not indicate any significant negative impacts. This proves that FeCr smelting does not automatically imply surface water pollution. In contrast, the surface water pollution originating from certain FeCr smelters was apparent, especially near smelters where upstream and downstream samples could be collected (Smelters 4, 5, 7 and 9). However, only at Smelter 9 did this pollution result in surface water conductivity not being fit for human consumption.
No correlations and/or deductions could be made between potable water quality and possible pollution from FeCr smelters. Notwithstanding this limitation, it was found that potable water sampled at all sites complied with the conductivity criteria for human consumption. Although groundwater quality in the proximity of ferrochrome smelters was not investigated, such an investigation should be considered as an important future perspective.
ACKNOWLEDGEMENTS
The authors wish to thank Dr L Teidt for the SEM-EDS analyses.
REFERENCES
ANDERSON H and CUMMINGS D (1999) Measuring the salinity of water. Department of Environment and Primary Industries, Victoria, Australia. URL: http://www.dpi.vic.gov.au/agriculture/farming-management/soil-water/salinity/measuring-the-salinity-of-water (Accessed 10 October 2013). [ Links ]
ATEKWANA EA, ATEKWANA EA, ROWE RS, WERKEMA Jr DD and LEGALL FD (2004) The relationship of total dissolved solids measurements to bulk electrical conductivity in an aquifer contaminated with hydrocarbon. J. Appl. Geophys. 56 281-294. [ Links ]
BEUKES JP, DAWSON NF and VAN ZYL PG (2010) Theoretical and practical aspects of Cr(VI) in the South African ferrochrome industry. J. Southern Afr. Inst. Min. Met. 110 743-750. [ Links ]
BEUKES JP, VAN ZYL PG and RAS M (2012) Treatment of Cr(VI)-containing wastes in the South African ferrochrome industry - a review of currently applied methods. J. Southern Afr. Inst. Min. Met. 112 347-352. [ Links ]
CRAMER LA, BASSON J and NELSON LR (2004) The impact of platinum production from UG2 ore on ferrochrome production in South Africa. J. Southern Afr. Inst. Min. Met. 104 (9) 517-527. [ Links ]
DWAF (DEPARTMENT OF WATER AFFAIRS AND FORESTRY, SOUTH AFRICA) (1996) South African Water Quality Guidelines, Second Edition, Vol. 1. DWAF, Pretoria. [ Links ]
ICDA (International Chromium Development Association) (2013) Statistical Bulletin 2013 edition. ICDA, Paris and Beijing. [ Links ]
JOSIPOVIC M, ANNEGARN HJ, KNEEN, MA, PIENAAR JJ and PIKETH SJ (2009) Concentrations, distributions and critical level exceedance assessment of SO2, NO2 and O3 in South Africa. Environ. Monit. Assess. 171 181-196. [ Links ]
JOSIPOVIC M, ANNEGARN HJ, KNEEN, MA, PIENAAR JJ and PIKETH SJ (2011) Atmospheric dry and wet deposition of sulphur and nitrogen species and assessment of critical loads of acidic deposition exceedance in South Africa. S. Afr. J. Sci. 107 (3/4) 478-488. [ Links ]
LAAKSO L, VAKKARI V, VIRKKULA A, LAAKSO H, BACKMAN J, KULMALA M, BEUKES JP, VAN ZYL PG, TIITTA P, JOSIPOVIC M and co-authors (2012) South African EUCAARI measurements: seasonal variation of trace gases and aerosol optical properties. Atmos. Chem. Phys. 12 1847-1864. [ Links ]
LOOCK MM, BEUKES JP and VAN ZYL PG (2014) A survey of Cr(VI) contamination of surface water in the proximity of ferrochromium smelters in South Africa. Water SA 40 (4) 709-716. [ Links ]
LOOCK-HATTINGH MM, BEUKES JP, VAN ZYL PG and TIEDT LR (2015) Cr(VI) and conductivity as indicators of surface water pollution from ferrochrome production in South Africa: Four case studies. Met. Mater. Trans. B. 46B 2315-2325. DOI:10.1007/ s11663-015-0395-x. [ Links ]
LOURENS AS, BEUKES JP, VAN ZYL PG, FOURIE GD, BURGER JW, PIENAAR JJ, READ CE and JORDAAN JH (2011) Spatial and temporal assessment of gaseous pollutants in the Highveld of South Africa. S. Afr. J. Sci. 107 (1/2) Art. #269, 8 pp. [ Links ]
MANDIWANA KL, PANICHEV N and NGOBENI P (2007) Electrothermal atomic absorption spectrometric determination of Cr(VI) during ferrochrome production. J. Hazardous Mater. 145 511-514. [ Links ]
MCNEIL VH and COX ME (2000) Relationship between conductivity and analysed composition in a large set of natural surface-water samples, Queensland, Australia. Environ. Geol. 39 (12) 1325-1333. [ Links ]
MURTHY YR, TRIPATHY SK and KUMAR CR (2011) Chrome ore beneficiation challenges & opportunities - a review. Miner. Eng. 24 (5) 375-380. [ Links ]
PAUL MK and SEN S (2012) The occurrence of TDS and conductivity of domestic water in Lumding Town of Nowgong District of Assam, N.E. India. Curr. World Environ. 7 (2) 251-258. [ Links ]
RIEKKOLA-VANHANEN M (1999) Finnish expert report on best available techniques in ferrochrome production. Finnish Environment Institute, Helsinki. [ Links ]
Received: 3 November 2014
Accepted in revised form October 2015
* To whom all correspondence should be addressed. +27 82 460 0594; fax: +27 18 299 2350; e-mail: paul.beukes@nwu.ac.za

