


Services on Demand
Article
 English (pdf)
 Article in xml format
 Article references
Indicators

Related links
-
 Cited by Google
 -
 Similars in Google
Share

 Permalink
Water SA
On-line version ISSN 1816-7950
Print version ISSN 0378-4738
Water SA vol.41 n.5 Pretoria Oct. 2015
http://dx.doi.org/10.4314/WSA.V41I5.13
Apparent losses due to domestic water meter under-registration in South Africa
FA Couvelis; JE van Zyl
Department of Civil Engineering, University of Cape Town, Private Bag X3, Rondebosch 7701, South Africa
ABSTRACT
This study investigated the extent of apparent losses due to water meter under-registration in South Africa. This was done by first estimating the under-registration of new meters due to on-site leakage, and then the additional under-registration due to meter aging. The extent and flow distributions of on-site leakage were determined through field studies in Cape Town, Mangaung and Johannesburg, by measuring the flow through new water meters when no legitimate consumption occurred on the property. The results were used in combination with the accuracy curves of new meters to estimate meter under-registration. The eThekwini meter replacement database was used to estimate the effect of meter age on meter accuracy. By combining these results with the average age of meters in South Africa, estimated from the National Water Demand Archive, it was possible to estimate the average meter under-registration due to meter aging. The study concluded that apparent losses due to water meter under-registration are around 5% of consumption for domestic consumers.
INTRODUCTION
The International Water Association defines apparent losses as water that is delivered to consumers, but experienced as a loss by municipalities. The two main causes of apparent losses are water meter under-registration and unauthorised consumption, although administrative errors may also play a role (Farley and Trow, 2003). According to the American Water Works Association, consumer meter under-registration is the main cause of apparent losses in distribution systems (AWWA, 2009), but this is not true in all systems and thus local conditions should be taken into consideration.
Apparent losses are important for determining real losses, which are estimated in a top-down approach by subtracting apparent losses from water losses (Thornton et al., 2008). In systems with significant levels of apparent losses, water consumption data will be distorted unless apparent losses are taken into consideration, which may result in sub-optimal planning and management decisions.
Apparent losses are normally valued at the retail rate charged to consumers, unlike real losses that are valued at production cost (Thornton et al., 2008). A study in Switzerland found that apparent losses accounted for 26% of non-revenue water in terms of volume, but 69% in terms of financial loss to the utility (Guibentif et al., 2007). Similar results have also been reported for Philadelphia (Thornton et al., 2008) and Tampa Bay (Pickard et al., 2008) in the United States. Apparent losses are normally estimated as a percentage of water losses or consumption. In Australia, New Zealand, USA and Canada, unauthorised consumption is estimated as 0.1% of system input volume and meter under-registration as 2% of metered consumption (Seago and McKenzie, 2007).
In South Africa, Seago et al. (2004) proposed values for the components of apparent losses based on local conditions (see Table 1). Suggested values for unauthorised consumption vary between 2% and 10% and administrative losses between 2% and 8% of water losses.

Mutikanga et al. (2010) developed a similar table for developing countries (see Table 1), estimating unauthorised consumption to vary between 0.5% and 10%, and administrative errors to vary between 2% and 10% of billed metered consumption.
Despite these guidelines, little work has been published on the actual levels of apparent losses in South Africa. To help address this knowledge gap, this study was conducted with the objective of estimating apparent losses due to water meter under-registration in domestic water meters in South Africa. This study only investigated middle- to high-income groups, from whom most municipal income is generated due to high consumption and payment rates. Low-income areas are also important from a water management perspective, but fell outside the scope of this study. However, where data were available for low-income areas, these were included in the results.
Two factors that contribute to water meter under-regis-tration were considered in this study: low flow rates as a result of on-site leakage and the deterioration in accuracy of water meters due to aging.
Water meters are sized to be accurate at typical consumption flow rates. While metering errors at these flow rates are small, it is known that mechanical meters under-register at low flow rates. As meters age and their components wear, they typically under-register more, and this effect is felt most prominently at lower flow rates (Davis, 2005; Arregui et al., 2003; Arregui et al., 2011; Mutikanga et al., 2010)
A main cause of low flow rates that will result in even new meters under-registering is leakage on consumers' properties. On-site leaks may be widespread and typically cause continuous low flow rates in the low accuracy range of water meters. In a recent study in Johannesburg, Lugoma et al. (2012) found that 67% of 128 randomly-selected domestic properties in middle-to high-income suburbs had a measurable on-site leakage with the leaking properties having a median flow rate of 5.7 l/h.
The approach followed in this study was to first estimate meter under-registration of new meters due to on-site leakage, and then estimate meter under-registration due to aging. These two parts of the study are discussed separately in the next sections. This is followed by a discussion where the results are combined to estimate the extent of apparent losses due to water meter under-registration in domestic properties in South Africa.
ON-SITE LEAKAGE
On-site leakage is defined as leakage that occurs on the downstream side of the consumer's water meter. The International Water Association classification of leakage considers on-site leakage to be part of consumption and not a loss since the water is delivered to the consumer. On-site leakage therefore contributes to water demand, but can also significantly increase apparent losses due to the under-registration of the associated low flow rates.
It is important to quantify the level of on-site leakage in terms of both occurrence and flow rate to identify the extent of the problem. This was done for selected suburbs in Cape Town and Mangaung to expand the earlier work done by Lugoma et al. (2012) in Johannesburg.
Methodology
The consumer meter databases of Cape Town and Mangaung were used to identify domestic water meters less than 3 years old in middle- to high-income areas. It was assumed that these meters were randomly distributed and that their accuracies were similar to those of new meters.
The procedure involved reading the water meter at 5-min intervals for 15 min after requesting the consumer not to use water for the period of the test. If an on-site leak was identified, the procedure was repeated at another time to validate that the reading was indeed from a leak.
A total of 405 and 166 water meters were investigated in Cape Town and Mangaung, respectively. In Cape Town, 58% of the meters investigated were multi-jet and 42% were positive displacement, of sizes varying from 15 to 25 mm. In Mangaung, all of the meters were 15 mm positive displacement meters, with the exception of one multi-jet meter. These meters were distributed in 15 and 6 different suburbs in Cape Town and Mangaung, respectively.
The reading taken from water meters in these tests included meter errors, and thus had to be corrected to determine the actual volumes. These corrections were based on the manufacturer's accuracy curves and are described in Lugoma et al. (2012).
Results
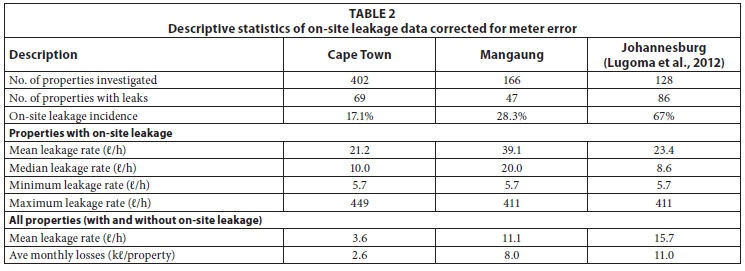
A summary of the results of the Cape Town, Mangaung and Johannesburg studies is provided in Table 2. The incidence of on-site leakage in the middle- to high-income suburbs investigated in Cape Town and Mangaung was found to be 17% and 28%, respectively, significantly lower than the 67% found in Johannesburg.
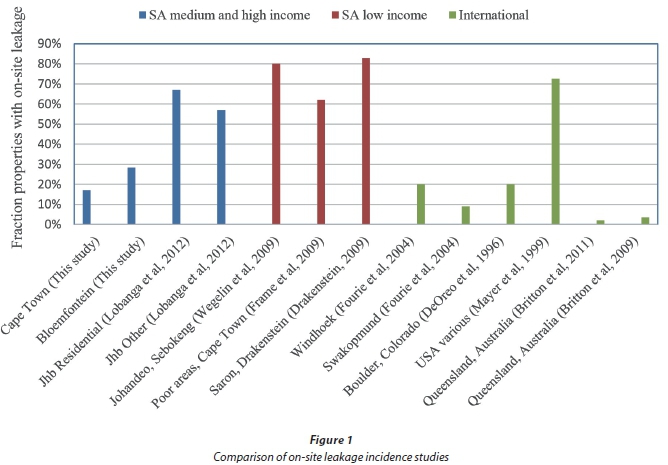
Figure 1 compares the incidence of on-site leakage in this study to other values found in South Africa and internationally. It is clear that the incidence of on-site leakage varies a great deal, but is highest in low-income areas. International studies generally indicate a low incidence of on-site leakage, with the notable exception of Mayer et al. (1999), who found an on-site leakage incidence in various areas of the USA that is similar to that of Johannesburg.
The average on-site leakage rates for domestic properties in Cape Town and Mangaung were found to be 21.2 and 39.1 l/h, respectively. This is in the same order of magnitude as the Johannesburg value of 23.4 £/h. In all cases the median leakage rates were significantly lower than the average, indicating that the distributions of the leakage rates are skewed towards lower flow rates, with few very high values that raise the average.
The minimum on-site leakage rate was limited by the starting flow rate of the meters investigated, which is approximately 6 l/h. The maximum on-site leakage rates found in the three cities were remarkably similar, varying between 411 and 449 l/h.
Based on the incidence and flow rate results, the overall (including leaking and non-leaking properties) monthly on-site leakage rates of residential properties in Cape Town, Mangaung and Johannesburg were estimated as 2.6, 8.0 and 11.0 kl/month per property.
The distribution of residential on-site leakage rates in Cape Town, Mangaung and Johannesburg are compared in Fig. 2, and the cumulative distributions in Fig. 3. In all three cases the highest proportion of properties had low on-site leakage rates, with the proportion of properties decreasing rapidly with increasing leakage rate. The lack of data in the 0-5 l/h range is due to these flow rates being too small for the meters to register. However, considering the trend in the data, it seems likely that many properties will have on-site leakage below the starting flow rate of the meter.
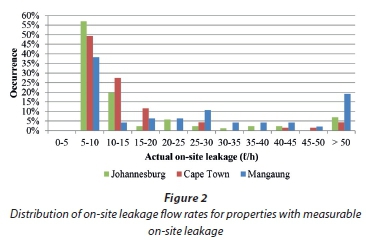
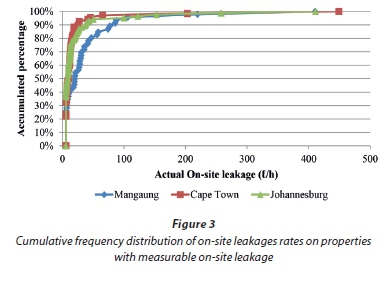
Figure 3 shows that almost 90% of the leakage flow rates in Cape Town are below 20 £/h, compared to 50% for Mangaung and 80% in Johannesburg. While Mangaung has a lower incidence of on-site leakage, it has larger leakage flow rates.
Discussion
By comparing the registered and corrected volumes of on-site leakage, the apparent loss component of the on-site leakage for new meters may be calculated. It was found that in Cape Town, 13.1% (2.81 £/h per leaking property) of the on-site leakage is unmetered for new meters, while in Mangaung this number is 2.7% (1.1 £/h per leaking property). The reason Mangaung has a lower fraction is that its leakage rates were higher and thus in the higher accuracy range of the meters. The Johannesburg study found that the average under-registration of on-site leakage for residential properties was 1.7 l/h, which is equivalent to an under-registration of 10% of the on-site leakage.
It should be stressed that the findings of these studies exclude leakage that occurred at flow rates below the starting flow rates of the meters, and thus can be considered as conservative.
It seems reasonable to assume that 10% to 15% of measured on-site leakage is apparent losses due to meter under-registration. The higher end of this scale was adopted in this study for the following reasons:
- Registered or measured on-site leakage excludes the meter under-registration error. A given error based on the actual leakage will thus be higher when estimated as a percentage of the registered leakage.
- The on-site leakage values obtained in this study exclude any leakage flow rate below the starting flow rate of the meter. Since the fraction of properties increases with decreasing leakage rate down to the starting flow rate, it is likely that a significant proportion of the properties where no leakage was measured did have leaks below the starting flow rate of the meters.
It is thus recommended that 15% of on-site leakage measured with relatively new meters is considered as apparent losses due to meter under-registration of on-site leakage.
METER AGING
An investigation was conducted on the development of water meter under-registration losses with age and the impact of this on apparent losses. This was done in two steps, the first to estimate the deterioration in water meter accuracy with age and the second to estimate the average water meter age in South Africa.
Meter accuracy deterioration with age
It is not simple to generalise the deterioration of water meter accuracy with age since this depends on many factors, including the meter model, type of meter, water quality and characteristics of the water consumption pattern (Van Zyl, 2011). Pipe bursts and intermittent supplies often result in water quality problems that may affect water meter performance (Van Zyl, 2011).
Under ideal circumstances, municipalities should monitor the conditions of their meters through failure patterns and testing. However, such programmes are not common in South Africa and doing physical tests as part of this study would have been prohibitively expensive. As a result, the analysis was based on the water meter database of eThekwini municipality.
The eThekwini water meter database included 158 409 domestic and non-domestic consumers who had their meter replaced at least once between June 2004 and February 2011. Of these records, 142 858 or 90% consisted of 15 mm positive displacement meters produced by a single manufacturer. Since this study specifically considered domestic meters, and the numbers of other types of meters were small, only these 15 mm domestic meters were further analysed.
The data was further cleaned by removing incomplete records and obvious errors such as stuck water meters. The cleaning steps and the number of records affected are summarised in Table 3. After the cleaning process, 65 067 records remained for use in the study.

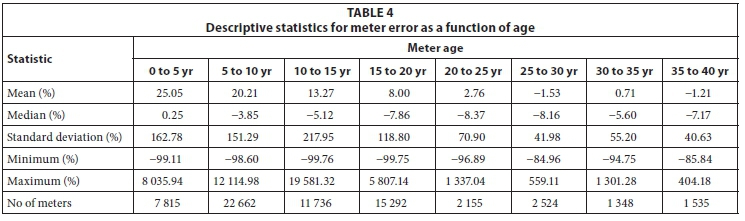
The data records were stratified into homogeneous groups according to meter age and registered volume, as shown in Tables 4 and 5. Age groups of 5 years and volume increments of 1 000 kl were used. Groups with less than 1 000 data points were excluded from the analysis.
The under-registration error of each replaced meter in the database was estimated as the increase in consumption after replacing the meter with a new one. Periods of 12 months of registered consumption before and after replacement were used to account for seasonal variation in consumption. This analysis was based on the following assumptions:
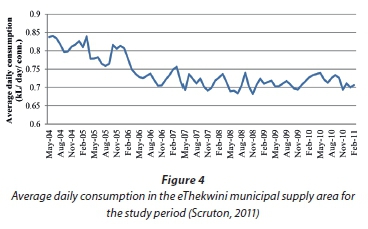
- The actual consumption 1 year before and after replacement is identical. While this is unlikely to be the case for a single user, considering a large number of records provides a statistically significant picture of the overall behaviour. To verify this, the eThekwini billing database was analysed and it was found that domestic consumption actually had a decreasing trend over the study period (see Fig. 4). This means that the results found are likely to under-estimate the actual meter under-registration, and can thus be considered as conservative.
- The new meters have negligible error compared to the replaced meters.
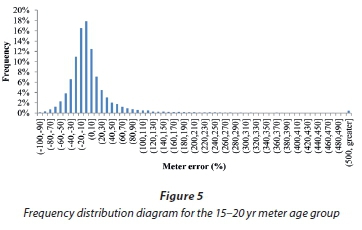
The descriptive statistics of the differences in consumption after and before the meter replacement are given in Table 4 for meter age groupings and in Table 5 for volumetric groupings. A frequency distribution of the difference in consumption of a typical group is shown in Fig. 5. Since the smallest possible difference is bounded on the lower end but not on the upper end, the data tends to a log-normal distribution. This trend is evident from the average values in the tables being significantly higher than the mean values. As a result, the median rather than the average differences were used in this study.
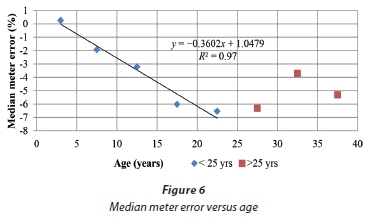
The median meter error as a function of meter age is given in Fig. 6. The figure shows a strong linear trend for meters younger than 25 years. The slope of this line indicates deterioration in meter accuracy (i.e. increasing under-registration) of 0.36% of consumption per year. In other words, the growth in apparent losses due to meter aging grows by about 1% of consumption every 3 years. The meters older than 25 years do not fit the linear trend, which may be due to changes in manufacturing materials or the smaller sample sizes of these meters.
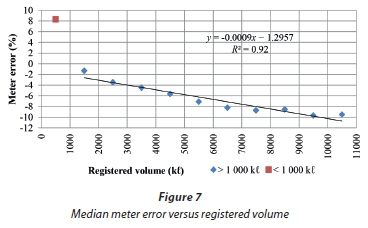
The median meter error as a function of the volume through the meter is given in Fig. 7. Except for the first 1 000 kl, the data show a strong linear trend. The slope of this line indicates deterioration in meter accuracy (i.e. increasing under-registration) of 0.9% of consumption per 1 000 kl of water measured. In other words, the growth in apparent losses due to meter aging grows by about 1% of consumption for every 1 000 kl measured.
Age distribution of meters in South Africa
The National Water Demand Archive (Van Zyl and Geustyn, 2007) was used to estimate the average age of meters in South Africa. The archive includes a value for the installation date of the meter, which was used as the basis for the study.
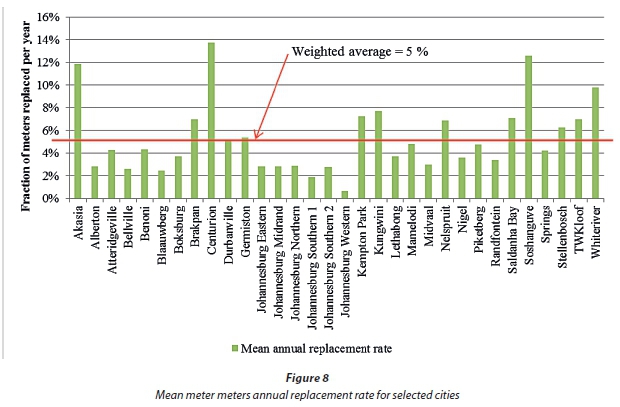
The approach adopted in this study was to estimate the average replacement rate over the last 3 years of available data. Cities without any meter replacement data, with less than 5 000 meter replacements or obvious erroneous or erratic data, were excluded.
The fractions of meters replaced in each of the remaining cities (or areas) are shown in Fig. 8. The figure indicates that meter replacement rates vary greatly between cities, but less so within different years for the same city. The mean meter replacement rate, weighted by the number of records for each city, was found to be 5%. This implies that, on average, meters are replaced at an age of 20 years, and that the mean age of domestic meters in South Africa can be estimated as 10 years.
APPARENT LOSS ESTIMATE
Based on on-site leakage investigations in Cape Town, Mangaung and Johannesburg it is estimated that the meter under-registration error for on-site leakage will be 15% of the registered leakage rate for new meters.
Assuming a leakage incidence of 30% and an average leakage rate of 20 l/h at these properties, the average leakage rate for all properties can be calculated as 6 l/h per property. Based on the 15% rule, this results in an average meter under-registra-tion rate of 0.9 l/h per property, or 22 l/day per property. Based on a typical consumption of 1 000 l/day, this results in a typical meter under-registration of 2.2%.
The results of this study showed a strong linear relationship between meter age and under-registration with an increase in meter under-registration of 0.36% of consumption per year. If this is combined with the result of an average meter age of 10 years, the average meter under-registration error due to aging can now be estimated as 2.6% of consumption.
The total meter under-registration error in middle- to high-income areas in South Africa is thus estimated to be 4.8%, say 5%, of consumption.
CONCLUSION
The purpose of this study was to estimate the extent of apparent losses due to water meter under-registration for middle- to high-income domestic consumers in South Africa. The approach of the study was to combine estimates of new meter under-registration due to on-site leakage and meter under-registration due to aging.
While the data used in this study was obtained from different sources such as the eThekwini meter replacement database, National Water Demand Archive and on-site leakage studies performed in Cape Town, Mangaung and Johannesburg, it likely provides a reasonable picture of the situation in South Africa. However, conditions vary greatly between consumers and municipalities, and thus a local assessment of apparent losses is advised for any given area.
The study found that meter under-registration due to on-site leakage is 2.2% of consumption, and due to meter aging 2.6% of consumption. This results in a recommended apparent losses value of 5% of consumption.
ACKNOWLEDGEMENTS
The authors would like to acknowledge the Water Research Commission for funding the study, the municipalities of City of Cape Town and Mangaung for permission to investigate on-site leakage, and GLS Consulting, JOAT Group and eThekwini Municipality for providing data.
REFERENCES
ARREGUI F, CABRERA JR. E, COBACHO R and GARCIA-SERRA J (2011) Key factors affecting water meter accuracy. URL: https://www.ita.upv.es/idi/descargaarticulo.php?id=54 (Accessed December 2011). [ Links ]
ARREGUI F, PALAU C, GASCON L and PERIS O (2003) Evaluating domestic water meter accuracy. A case study. In: CABRERA E and CABRERA E Jr. (eds). Pumps, Electromagnetic Devices, and Systems applied to Urban Water Management. Swets & Zeitlinger, Lisse. ISBN 90 5809 560 6. 343-352. [ Links ]
BRITTON T, COLE G, STEWART R and WISKAR D (2011) Smart metering as a tool for the remote diagnosis of leakage in residential households. URL: www.iwawsp11.com (Accessed December 2011). [ Links ]
BRITTON T, STEWART R and WISKAR D (2009) Smart metering as a tool for revealing the characteristics of household leakage during a typical reading cycle. Proc. IWA Efficient 2009 Conference, October 2009, Sydney. Australian Water Association, Sydney. [ Links ]
DAVIS SE (2005) Residential water meter replacement economics. In: Proceedings of IWA Leakage 2005 Conference, September 2005, Halifax, Canada. 1-10. [ Links ]
DEOREO W, HEANEY J and MAYER P (1996) Flow trace analysis to assess water use. AWWA J. 88 (1) 79-90. [ Links ]
DRAKENSBERG MUNICIPALITY (2009) Saron: Project for the repair of household leaks. Lyners Consulting Engineers and Project Managers. Unpublished report, Saron, Drakensburg Municipality. [ Links ]
FARLEY M and TROW S (2003) Losses in Water Distribution Networks: A Practioner's Guide to Assessment, Monitoring and Control. IWA Publishing, London. [ Links ]
FOURIE G (2004) Leakage management on plumbing systems in households and government properties. Draft Report prepared for SIDA. Namibia. [ Links ]
FRAME J, DANIELS J and WRIGHT D (2009) Water leaks repair program in poor areas in the City of Cape Town. In: Proceedings of the 5th IWA Water Loss Reduction Specialist Conference, May 2009, Cape Town. 124-130. [ Links ]
GUIBENTIF H, RUFENACHT HP, RAPILLARD P and RUETSCHI M (2007) Acceptable Level of Water Loss in Geneva. In: Proceedings of the IWA Water Loss 2007 Specialist Conference, September 2007, Bucharest, Romania. 138-147. [ Links ]
LUGOMA M, VAN ZYL J and ILEMOBADE A (2012) The extent of on-site leakage in selected suburbs of Johannesburg. Water SA 38 (1) 127-132. [ Links ]
MAYER P, DEOREO W, OPITZ E, KIEFER J, DAVIS W, DZIEGIELEWSKI B and NELSON JO (1999) Residential End Uses of Water Study. AWWA Research Foundation, Denver, Colorado. [ Links ]
MUTIKANGA H, SHARMA S and VAIRAVAMOORTHY K (2010) Assessment of apparent losses in urban water systems. Water Environ. J. 25 327-335. [ Links ]
PICKARD BD, VILAGOS J, NESTEL GK, FERNANDEZ R, KUHR S and LANNING D (2008) Reducing non-revenue water: a myriad of challenges. Florida WaterResour. J. May 2008 26-32. [ Links ]
SCRUTON S (2011) Personal communication, 31 March 2011. Mr Simon Scruton, eThekwini NRW Manager, eThekwini Municipality, Durban, 4000. [ Links ]
SEAGO CJ and MCKENZIE RS (2007) An assessment of non-revenue water in South Africa. WRC Report No. TT 300/07. Water Research Commission, Pretoria. [ Links ]
SEAGO C, BHAGWAN J and MCKENZIE R (2004) Benchmarking leakage from water reticulation systems in South Africa. Water SA 30 (5) 25-32. [ Links ]
THORNTON J, STURM R and KUNKEL G (2008) Water Loss Control (2nd edn). McGraw Hill, New York. [ Links ]
VAN ZYL J (2011) Introduction to integrated water meter management (1st edn). WRC Report No. TT 490/11. Water Research Commision, Pretoria. [ Links ]
VAN ZYL J and GEUSTYN L (2007) Development of a national water consumption archive. WRC Report No. 1605/1/07. Water Research Commision, Pretoria. [ Links ]
WEGELIN W, MCKENZIE R, VAN DER MERWE B and MABOYJA M (2009) The Emfuleni water loss project - a major challenge. In: Proceedings of the 5th IWA Water Loss Reduction Specialist Conference, May 2009, Cape Town, South Africa. 409-416. [ Links ]
Received: 18 February 2015
Accepted in revised form 15 September 2015
* To whom all correspondence should be addressed. Current address: Jeffares & Green (Pty) Ltd, 6 Pin Oak Avenue, Hilton, Pietermaritzburg, South Africa 3201 + 27 33 343 6700; fax: + 27 33 343 6701; e-mail: couvelisf@jgi.co.za

