


Servicios Personalizados
Articulo
 Inglés (pdf)
 Articulo en XML
 Referencias del artículo
Indicadores

Links relacionados
-
 Citado por Google
 -
 Similares en Google
Compartir

 Permalink
Water SA
versión On-line ISSN 1816-7950
versión impresa ISSN 0378-4738
Water SA vol.41 no.5 Pretoria oct. 2015
http://dx.doi.org/10.4314/WSA.V41I5.11
In-line rheological characterisation of wastewater sludges using non-invasive ultrasound sensor technology
R KotzéI; R HaldenwangI; V FesterI; W RössleII
IFlow Process & Rheology Centre (FPRC), Cape Peninsula University of Technology, PO Box 652, Cape Town, 8000, South Africa
IIWastewater Branch, Water and Sanitation Department, City of Cape Town, 38 Wale Street, Cape Town, South Africa
ABSTRACT
The performance of a new ultrasound transducer, which can measure velocity profiles non-invasively through high-grade stainless steel pipes, was evaluated for the first time with secondary wastewater sludges. This work is a follow-up study on the feasibility work initially done by the same authors. In-line process control based on accurate rheological characterisation for treated wastewater sludge could lead to significant savings in chemicals and will optimise dewatering processes producing drier sludges. In this work, a wastewater sludge at three concentrations was tested in order to investigate the capabilities of the in-line ultrasound technique for different viscosities and fluid properties. The rheological parameters obtained using the new ultrasound sensor and ultrasonic velocity profiling with combined pressure difference (UVP + PD) technique were compared with results obtained using conventional tube viscometry. Comparison with tube viscometer results showed that yield stresses could be overestimated by 120% if data are not available in the low shear-rate ranges. This non-invasive transducer proved to be sensitive enough to obtain flow curves over a large shear-rate range, improving the prediction of the yield stress and requiring about 50% less energy than the invasive system.
Keywords: ultrasonic velocity profiling, UVP + PD methodology, sludge rheology, non-Newtonian, tube viscometry, non-invasive, sludge dewatering
INTRODUCTION
Ultrasonic velocity profiling (UVP) is a proven and arguably the best technique for flow visualisation in industrial fluids. This is because industrial fluids, including wastewater sludges, exhibit wide particle size distributions, large particle sizes, very high viscosities and more importantly are opaque. This limits other practical techniques that are, e.g., based on visible light, such as laser Doppler anemometry (LDA). It is almost impossible to conduct flow measurements at all in such fluids with optical techniques. The UVP working principle and applications are well described in several scientific publications, see e.g. Takeda (1991, 1996), Jensen (1996), Povey (1997) and Powell (2008).
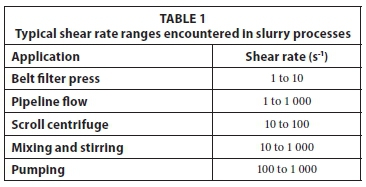
Tube viscometry offers the possibility of in-line rheological measurement for process control opposed to methods that are off-line. Attempts to develop process control protocols using off-line rotational viscometry were made recently (Piani et al., 2014). Tube viscometry offers the possibility for in-line rheological measurement but one can only obtain one point on a flow curve at one flow rate, whereas with the UVP + PD method (discussed in more detail in Materials and Experimental Methods) a complete flow curve can be created from one velocity profile. Another limitation is also the low shear-rate ranges that can be obtained. When designing or monitoring processes it is important to measure the rheological properties over the correct shear-rate ranges. Typical shear-rate ranges are presented in Table 1 (Alderman and Heywood, 2014a, 2014b).
In a recent study, Kotzé et al. (2014a) investigated and presented an ultrasonic velocity profiling combined with pressure difference (UVP + PD) methodology for in-line rheological characterisation of a wastewater sludge. Feasibility tests were carried out using delay line and standard ultrasound transducers as well as different sensor installation techniques. It was possible to measure detailed flow behaviour for a viscous waste-water sludge using the delay line transducer setup. Rheological parameters obtained from the velocity profile measurement using the delay line transducer showed good agreement with tube viscometry (within 15% over the same shear-rate range). Although good qualitative velocity profiles could be measured using the delay line transducer, it was still not possible to penetrate beyond the pipe radius. This was due to the delay line material absorbing ultrasonic energy which prevents measurements in larger pipe diameters in attenuating fluids. Kotzé et al. (2014a) concluded that initial results obtained in a concentrated sludge suspension showed that the UVP + PD methodology is a feasible and promising technique for flow visualisation and rheological characterisation in the wastewater engineering and treatment industry. However, an important limitation was that the transducer installation (delay transducer setup) is not non-invasive. This means that the transducer front will be subjected to harsh industrial conditions and the surface could wear over time which will influence measurements. A setup capable of measuring through high-grade industrial steel would ultimately be required for successful implementation of the UVP + PD methodology under industrial conditions.
A new advanced ultrasonic sensor capable of complete non-invasive and accurate measurements through high-grade stainless steel was recently developed. The sensor unit consists of several components such as a high-power ultrasound transducer, wedge, attenuator as well as different couplant materials. The configuration provides optimum acoustic beam properties, such as, beam forming, focusing and coupling. More information can be found in Wiklund et al. (2014) and Kotzé et al. (2014b).The objective of this research work was to evaluate the non-invasive ultrasound sensor and UVP + PD technique for in-line rheology measurement of wastewater sludge. Three concentration secondary wastewater sludges were tested in order to investigate the capabilities of the in-line ultrasound technique for different viscosities and fluid properties. The rheological parameters obtained using the new ultrasound sensor and UVP + PD technique were compared with results obtained using conventional tube viscometry.
Theoretical considerations
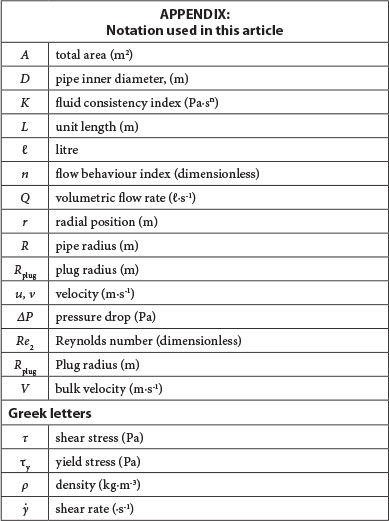
This section briefly describes non-Newtonian flow and the associated rheological parameters that were used to characterise the sludges tested in this work. (See appendix for notation).
The equation for the Herschel-Bulkley model to determine shear stress is as follows:

where: K, n and tyare the consistency index, flow behaviour index and yield stress, respectively (Chhabra and Richardson, 2008). These parameters can be obtained by using a curve-fitting procedure. Eq. 1 can be integrated to give the velocity (v) profile across the pipe radius (R):
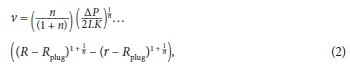
where: Rplug is the plug radius and is related to the fluid yield stress according to:

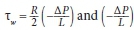
In a tube viscometer the relationship between wall shear stress tW, the volumetric flow rate Q and the shear stress t is as follows:
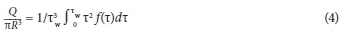
 is equal to the pressure drop per unit length of tube.
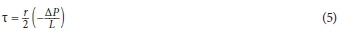
The shear stress at any radial position (r) is:
A plot of  vs Tw will give a unique line for a given material for all values of R and
  (Chhabra and Richardson, 2008).
As the values of 8V/D are wall shear rates for Newtonian fluids, these pseudo shear rates have to be transformed to true shear rates (y).
According to Chhabra and Richardson (2008) a flow curve of unknown form (Eq. 4) will yield, after some manipulation, the following:

This equation exists in various forms, one being the Rabinowitsch-Mooney equation:

where:
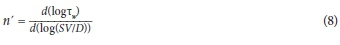
This was used to transform the tube viscometer pseudo shear rates to true shear rates.
The Herschel-Bulkley model can easily be modified to describe the power-law and Bingham plastic models. For the power law model the yield stress becomes 0 and for the Bingham model n = 1 (Chhabra and Richardson, 2008). The identification of the transition between laminar and turbulent flow is of great importance because the fluid flow behaviour changes fundamentally at the transition zone. Slatter and Lazarus (1993) formulated a Reynolds number (Re2) for non-Newtonian pipe flow (assumed plug-flow):
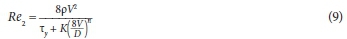
Note that in order to calculate rheological parameters all velocity profiles were measured in laminar flow. Equation 9 was used as an indication of the flow regimes in which tests were conducted in this work. The rheological parameters (n, K, t) first need to be obtained to calculate Re2. This was done by fitting of rheological models (Eq. 1) onto the experimental data. In this work the rheological parameters obtained from the UVP + PD method was used to determine the Reynolds number.
MATERIALS AND METHODS
Material
Secondary sludge filter cake from a filter belt press at Potsdam wastewater treatment plant (WWTP) was diluted to 3 concentrations that were tested in the tube viscometer fitted with the UVP + PD system. The approximate concentrations of the sludge were 6.8%, 5.1% and 4.3%.
UVP + PD flow loop and tube viscometer
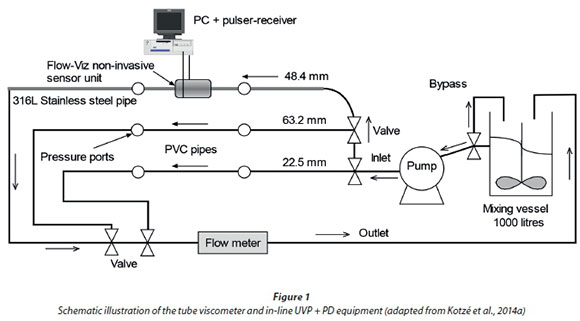
The pipe rig used was slightly modified from the one used in Kotzé et al. (2014a). The rig consisted of two polyvinyl chloride (PVC) pipes with inner diameters of 63.2 and 22.5 mm. A stainless steel pipe (316L) with an inner diameter of 48.4 mm was installed and was used for the non-invasive UVP + PD tests. Only the larger pipes (63.2 and 48.4 mm) were used for tube viscometry tests to obtain sufficiently low shear rates. The flow rate was varied, and at each flow rate a corresponding pressure drop and flow meter reading was recorded for each pipe separately. These were then converted to shear stress and true shear rates and plotted on the same graph (rheogram), using Eqs 5-8. In order to obtain rheological parameters for further comparison with the UVP + PD method a rheological model (Eq. 1) was fitted onto the experimental data. The procedure and method for obtaining accurate in-line tube viscometry data is discussed in detail by Chhabra and Richardson (2008). The pipe rig was fitted with a thermocouple (accuracy ±1°C) and a 50 mm electromagnetic flow meter (Krohne Optiflux 4000). Pressure measurements were conducted using differential pressure transducers (Fuji Electric) with maximum ranges of 0-6 kPa and 0-130 kPa and an accuracy of ±0.25%. The complete pipe viscometer setup is described in more detail in Haldenwang et al. (2010, 2012) and Kotzé et al. (2014a).
A non-invasive ultrasound sensor unit (Flow-Viz, Sweden, Gothenburg, www.flow-viz.com) was installed onto the 48.4 mm stainless steel (316L) pipe for non-intrusive Doppler measurements in the sludges. Figure 1 shows a schematic diagram of the flow loop fitted with the Flow-Viz instrumentation.
The UVP + PD concept and methodology is well described in several publications; see, e.g., Wiklund et al. (2007), Kotzé et al. (2008, 2012, 2014b) and Birkhofer et al. (2008); and will therefore not be described in detail in this article. A brief description is given in the next section.
The UVP + PD methodology
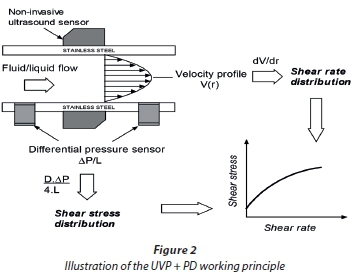
The UVP + PD methodology is based on the traditional tube viscometry concept, but with an important advantage. The complete shear rate distribution is obtained from a single multipoint velocity profile measurement of fluid flow in the pipe. In this work velocity profiles were measured using a 2 MHz non-invasive ultrasound sensor. The methodology does not use the volumetric flow rate in order to obtain a single shear-rate value. Furthermore, the measured velocity profile has information about the true shear-rate distribution and therefore does not have to be converted afterwards, as in the case with tube viscometry where pseudo shear rates are obtained. The shear rate can be directly obtained by differentiation of the measured velocity profile. The shear stress at the wall is obtained from simultaneous measurement of the pressure difference (AP) over a fixed distance (L). Finally the complete rheogram can be obtained by combining the shear rate and shear stress experimental data. Figure 2 describes the basic principle of the UVP + PD methodology.
Measurements such as real-time velocity profiles, complex rheological parameters (e.g. yield stress) and complete flow curves can be made non-invasively. The UVP + PD methodology was successfully tested in several industrial fluids ranging from food products, mineral suspensions, cement grouts as well as cosmetic products (Wunderlich and Brunn 1999; Dogan et al., 2005; Pfund et al., 2006; Birkhofer et al., 2008; Wiklund and Stading, 2008; Fock et al., 2009; Wassell et al., 2010; Wiklund et al., 2007, 2010, 2012; Kotze et al., 2008, 2012, 2013).
RESULTS AND DISCUSSION
Sludge 1: 6.8% w/w
Figure 3 shows a measured velocity profile in 6.8%, w/w respectively wastewater sludge and the corresponding Doppler spectrum across the pipe diameter. An average of 22 velocity profiles (total measurement time 0.6 s) were taken and the velocity resolution was 39 mm-s-1. The flow rate was 5 L-s-1 and the non-Newtonian Reynolds number (Re2) was 1 466 (laminar flow). The non-invasive sensor could measure a velocity profile well beyond the pipe radius of0.0242 m, as shown in Fig. 3, where the broken line is the pipe radius (centreline). The emission voltage was set to 90 V, and 256 pulse repetitions were used (the same settings were used for all measurements). Kotzé et al. (2014a) used an emission voltage of 150 V and number of pulse repetitions of 512 in order to measure a velocity profile across the pipe radius (when using the delay line sensors). This means that almost double the energy input and number of ultrasound pulse emissions for one profile was needed. A higher number of ultrasound pulse repetitions is typically required for measurements in low signal-to-noise ratios due to ultrasound energy attenuation and low input energy. This requirement was effectively reduced by half when using the new non-invasive sensor. Considering that measurements were also made through high-grade stainless steel, it can be concluded that the non-invasive sensor performance was excellent. This particular Doppler spectrum (Fig. 3) shows that a good penetration depth was possible (no significant energy losses and noise present) and that no signal artefacts were present (e.g. no prominent spikes in the measured profile).
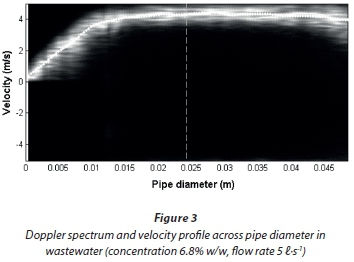
Note that the magnitudes of the velocity profile do not decrease beyond the pipe radius. This is due to reflections of the ultrasonic wave from the opposite pipe wall and is typically called reflected wave effect. This effect is strongly dependent on the attenuation of the ultrasound in the medium, and on the Doppler angle, tube diameter and acoustic properties of the pipe wall material. The energy of the reflected ultrasonic signal can be sufficient to generate an additional echo signal. The additional echo signal will contribute to an additional portion of the visualised velocities being shown on a depth distance that overshoots the pipe diameter. Therefore, it is very common to obtain non-zero velocities and apparent constant plug behaviour toward the far pipe wall, as shown in Fig. 3, with fluid systems containing a large amount of scattering particles.
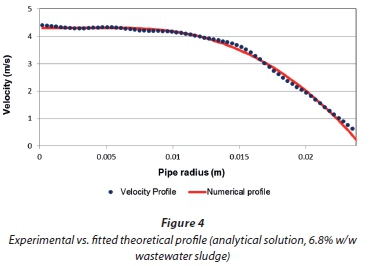
Figure 4 shows the experimental profile (circles) and fitted solution (solid line, Eq. 2). Only the experimental data across the pipe radius are used for fitting. From the fitting procedure the rheological parameters are obtained. A flow curve was then constructed using Eq. 1 and is shown in Fig. 5 together with tube viscometer data.
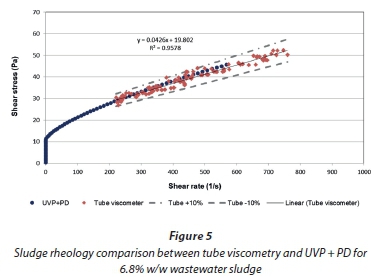
A Bingham plastic model was assumed for the tube vis-cometer data since there were no data available at the low shear rate region. This was because of pumping limitations as well as pressure sensor limits at very low flows during the tube viscom-etry tests.
An error band of ±10% was calculated from the fitted Bingham equation and is represented by the striped lines in Fig. 5. Recall that Eq. 1 can easily be modified to represent the Bingham or power-law rheological model. It can be observed that results are in good agreement (within 10%) with each other between the shear rates 200 to 800 s-1. It should also be noted that the rheology of the sludge was constant during the tube viscometry tests, which lasted up to 30 min (for one complete rheogram), as no significant fluctuations in the shear stress readings were observed. The shear rate and shear stress results from the two test pipes of different diameters were co-linear.
Note that data points at zero shear rate are presented for the UVP + PD method. The reason for this is that actual data points were recorded within the plug flow region (Fig. 4). From Fig. 4 it can also be observed that non-zero velocity is present at the pipe wall. The reason for the non-zero velocity is the finite ultrasound sample volume overlapping with the pipe wall and fluid flow region (convolution effect). More detailed information can be found in Kotzé et al (2012) and Kotzé et al. (2013).
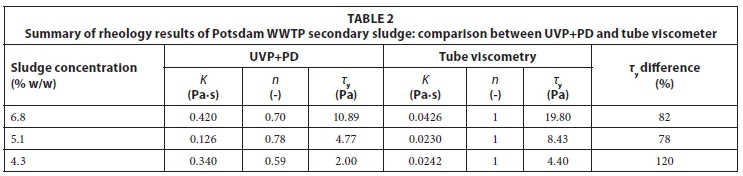
An important advantage of using the UVP + PD method is that viscosity data are measured over the complete shear-rate distribution of the fluid flow. The minimum and maximum limits of the shear-rate range depend on the flow rate (wall shear rate). The number of points on the rheogram depends on the spatial resolution of the velocity profile measurement, i.e., the number of local point velocity measurements across the pipe radius. Based on the results obtained using the UVP + PD method (Figs 4-5), it is clear that the wastewater sludges show a more shear thinning behaviour at the lower shear rates (< 200 s-1). The rheological parameters (fitted) are shown in Table 2.
Sludge 2: 5.1% w/w
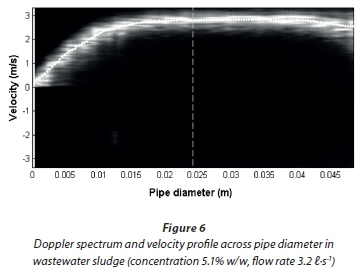
A measured velocity profile in 5.1% w/w wastewater sludge and corresponding Doppler spectrum across the pipe diameter is shown in Fig. 6. The velocity resolution for this measurement was 26.9 mm-s-1 (average of 22 profiles, total measurement time 0.92 s). Recall that previously the total measuring time was 0.6 s for the same number of measured profiles. This is because the time resolution (time for one profile) is linked to the ultrasound pulse repetition frequency (PRF). For higher flow rates a higher PRF is required and vice versa. The flow rate for this measurement was 3.2 L-s-1 and the flow was laminar (Re2 = 1633). The Doppler spectrum in Fig. 6 shows that there was a good signal-to-noise ratio during the measurements, which was expected due to the lower concentration of the sludge (less ultrasound energy attenuation). The reflected wave effect is also present in this spectrum (constant plug behaviour beyond pipe radius).
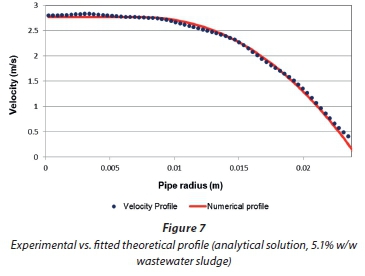
The experimental profile and fitted solution (Eq. 2) is shown in Fig. 7 (across the pipe radius). Note that the plug radius is lower than when compared to the 5.1% wastewater sludge. This was expected due to the lower concentration of solids.
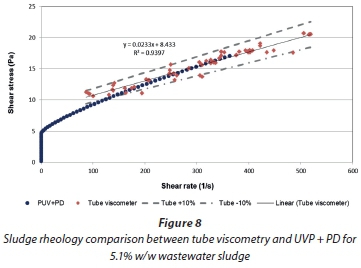
The resulting rheogram (Eq. 1) together with tube viscometer data are shown in Fig. 8. The rheological parameters obtained from the fitting procedure are shown in Table 2. The error band of ±10% was calculated from the fitted Bingham equation (broken lines, Fig. 8). From Fig. 8 it can be seen that the UVP + PD and tube viscometry rheometric data are within 10% (over the same shear rate range).
Sludge 3: 4.3% w/w
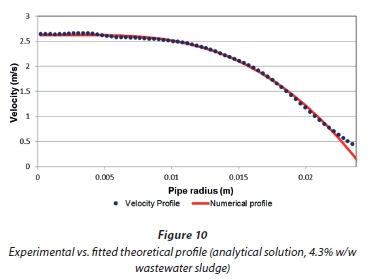
A measured velocity profile in 4.3% w/w wastewater and corresponding Doppler spectrum is shown in Fig. 9. The velocity resolution for this measurement was 28.7 mm-s-1 (average of 22 profiles, total measurement time 0.84 s). The flow rate for this measurement was 3 l-s-1 and the flow was laminar (Re2 = 1 897).
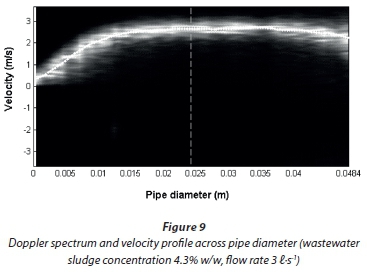
The Doppler spectrum in Fig. 9 shows that there was a good signal-to-noise ratio during the measurements, which was expected due to the low concentration of the sludge, and reflected wave effect was also present in this measurement.
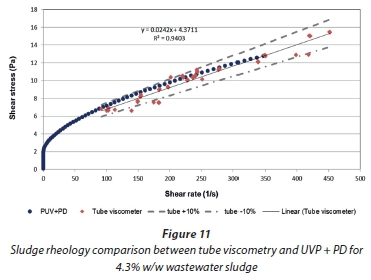
Figure 10 shows the measured velocity profile (across pipe radius) with the fitted profile and Fig. 11 shows the rheology comparison between tube viscometry and UVP + PD with + -10% error bars (error from tube viscometer).
Comparison of rheological parameters obtained
Table 2 shows the summary of rheological parameters obtained using UVP + PD and conventional tube viscometry. The major difference between the two methods used is evident in the yield stress values obtained from post-processing the data obtained from instruments. Note that since there were no tube viscom-eter data available in the low shear rate region (< 200 s-1), a Bingham plastic behaviour was assumed (n = 1). The UVP + PD measurement covers the complete shear rate distribution from zero to the maximum shear rate, which is the wall shear rate at a particular flow rate (e.g. from Fig. 5, max UVP + PD shear rate at 5 £-s-1 = 568 s-1). The fact that the flow curve shows curvature at shear rates lower than 200 s-1 indicates that the sludges could be better characterised as Herschel-Bulkley or yield pseudoplastic fluids. The yield stress obtained from the Bingham model fitted to the tube viscometer data was 82%, 78% and 120% higher for the 6.8%, 5.1% and 4.3% w/w sludges, respectively. It must be stressed that although the rheological parameters (K, n, Ty) are not in close agreement, the viscosities are still within 10% for shear rate ranges greater than 200 s-1 for each concentration of wastewater sludge. These results emphasise the importance of making rheological measurements over the shear-rate range that is applicable for a specific operation. Having the correct information at the low shear-rate region is important for accurate characterisation and monitoring of sludges in wastewater treatment applications. The shear rate range in a filter belt press, for example, ranges from 1 to 10 s-1. The viscosities of the sludge are also influenced by the polymer (chemical) dosages. Extrapolating from high shear-rate data to obtain the lower shear-rate range and yield stress will be detrimental to design and on-line monitoring. The UVP + PD approach is therefore much more appropriate.
Figure 12 illustrates that the UVP + PD method is able to detect variations in viscosity and shear thinning behaviour due to changes in solids concentrations. Minor changes in fluid velocity profiles can be measured and therefore the rheological changes of fluids.
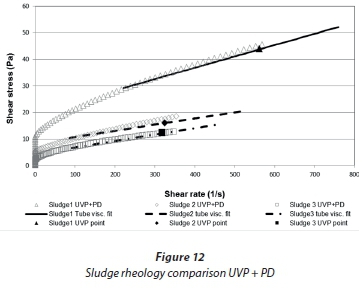
It can be seen from Fig. 12 that there is good agreement between the two methods over the same shear rates; however, the UVP + PD method measures shear stresses at much lower shear rates. If the tube viscometer were used as an in-line instrument only the single points on each graph would be obtained. These points are the flow rates/shear rates at which the UVP profiles were measured and are shown by the black crosses.
CONCLUSIONS AND RECOMMENDATIONS
The performance of a new ultrasound transducer, which can measure velocity profiles non-invasively through high-grade stainless steel pipes, was evaluated for the first time with secondary wastewater sludges. The energy requirement for the non-invasive ultrasound transducer was about 50% less when compared with the invasive delay line transducers (emission voltage 90V vs. 150 V and number of pulse repetitions 256 vs. 512). The Doppler spectra showed that good penetration depth was possible through the high-grade steel pipe wall as well as good signal-to-noise ratios for all of the sludge concentrations tested. Comparison of rheological parameters obtained from the velocity profile, and the subsequent flow curves developed from these parameters with that obtained in the tube viscometer, revealed significant curvature of the rheogram at shear rates lower than 100 s-1. The extrapolation of the tube viscometer data below 100 s-1 (where no data were obtained) using a Bingham plastic model, resulted in yield stress predictions as high as 120%, more than that measured with the UVP. At higher shear rates a difference of only 10% was obtained between the two methods. Since the UVP + PD system is sufficiently sensitive to obtain flow curves over a large shear-rate range, including the low shear-rate range, one can now determine the rheology of sludges in-line and in real-time. This has huge potential for process control in the wastewater treatment industry. The next challenge is to apply the technology to monitor the change in rheology of sludges in real-time in, for example, a filter belt press in order to optimise the polymer dosing to obtain a drier sludge cake.
ACKNOWLEDGEMENTS
The authors would like to thank the Water Research Commission (WRC) of South Africa and Cape Peninsula University of Technology (CPUT) for financially supporting this work. We also wish to thank the City of Cape Town for permission to perform experimental work at Potsdam WWTP. The staff at Potsdam WWTP were extremely helpful.
REFERENCES
ALDERMAN NJ and HEYWOOD NI (2004a) Improving slurry viscosity and flow curve measurements. Chem. Eng. Prog. 100 (4) 27-32. [ Links ]
ALDERMAN NJ, HEYWOOD NI (2004b) Making accurate slurry flow curve measurements. Chem. Eng. Prog. 100 (5) 35-41. [ Links ]
BIRKHOFER BH, SHAIK JAK, WINDHAB EJ, OURIEV B, LISNER K, BRAUN P and ZENG Y (2008) Monitoring of fat crystallization process using UVP-PD technique. Flow Meas. Instrum. 19 (3-4) 163-169. [ Links ]
CHHABRA RP and RICHARDSON JF (2008) Non-Newtonian Flow and Applied Rheology: Engineering Applications. Butterworth Heinemann, Oxford. [ Links ]
DOGAN N, MCCARTHY MJ and POWELL RL (2005) Measurement of polymer melt rheology using ultrasonics-based in-line rheometry. Meas. Sci. Technol. 16 1684-1690. [ Links ]
FOCK H, WIKLUND J and RASMUSON A (2009) Ultrasound velocity profile (UVP) measurements of pulp suspension flow near the wall .J. Pulp Paper Sci. 35(1) 26-33. [ Links ]
HALDENWANG R, FESTER V, SUTHERLAND A, HOLM R and DU TOIT R (2010) Design construction, commissioning and testing of a portable tube viscometer and pump rig. Proc. 18th International Conference on Hydrotransport, 22-24 September 2010, Rio De Janeiro, Brazil. Hydrotransport 18 287-298. [ Links ]
HALDENWANG R, SUTHERLAND APN, FESTER VG, HOLM R and CHHABRA RP (2012) Sludge pipe flow pressure drop prediction using composite power law friction factor-Reynolds number correlations based on different non-Newtonian Reynolds numbers. Water SA 38 (4) 615-622. [ Links ]
JENSEN JA (1996) Estimation of Blood Velocities Using Ultrasound: A Signal Processing Approach. Cambridge University Press, Cambridge. [ Links ]
KOTZÉ R, HALDENWANG R and SLATTER P (2008) Rheological characterisation of highly concentrated mineral suspensions using an Ultrasonic Velocity Profiling with combined Pressure Difference method. Appl. Rheol. 18 (6) 62114. [ Links ]
KOTZÉ R, HALDENWANG R, FESTER V and RÖSSLE W (2014a) A feasibility study of in-line rheological characterisation of a wastewater sludge using ultrasound technology. Water SA 40 (4) 579-586. [ Links ]
KOTZÉ R, RICCI S and WIKLUND J (2014b) Performance tests of a new non-invasive sensor unit and ultrasound electronics. Proceedings of the 9th International Symposium on Ultrasonic Doppler Methods for Fluid Mechanics and Fluid Engineering, 27-29 August 2014, Strasbourg, France. 105-118. [ Links ]
KOTZÉ R, WIKLUND J and HALDENWANG R (2012) Optimization of the UVP + PD rheometric method for flow behavior monitoring of industrial fluid suspensions. Appl. Rheol. 22 42760. [ Links ]
KOTZÉ R, WIKLUND J and HALDENWANG R (2013) Optimisation of pulsed ultrasonic velocimetry and transducer technology for industrial applications. Ultrasonics 53 459-469. [ Links ]
PFUND DM, GREENWOOD MS, BAMBERGER JA and PAPPAS RA (2006) Inline ultrasonic rheometry by pulsed Doppler. Ultrasonics 44 e477-e482. [ Links ]
PIANI L, RIZZARDINI CB, PAPO A and GOI D (2014) Rheology measurements for online monitoring of solids in activated sludge reactors of municipal wastewater treatment plant. Sci. World J. 2014 Article ID 590961. URL: http://dx.doi.org/10.1155/2014/590961. [ Links ]
POVEY MJW (1997) Ultrasound Techniques For Fluids Characterization. Academic Press, San Diego. [ Links ]
POWELL RL (2008) Experimental techniques for multiphase flows. Phys. Fluids 20 (040605) 1-22. [ Links ]
SLATTER PT and LAZARUS JH (1993) Critical flow in slurry pipelines. British Hydromechanics Research Group 12th International Conference on Slurry Handling and Pipeline Transport, Hydrotransport 12 639-654. [ Links ]
TAKEDA Y (1991) Development of an ultrasound velocity profile monitor. Nucl. Eng. Des. 126 277-284. [ Links ]
TAKEDA Y (1996) Velocity profile measurement by ultrasound Doppler shift method. Int. J. Heat Fluid Flow 7 313-318. [ Links ]
WASSELL P, WIKLUND J, STADING M, BONWICK G, SMITH C, ALMIRON-ROIG E and YOUNG NWG (2010) Ultrasound Doppler based in-line viscosity and solid fat profile measurement of fat blends. Int. J. Food Sci. Technol. 45 (5) 877-883. [ Links ]
WIKLUND J and STADING M (2008) Application of in-line ultrasound Doppler based UVP-PD method to concentrated model and industrial suspensions. Flow Meas. Instr. 19 171-179. [ Links ]
WIKLUND J, RAHMAN M and HAKANSSON U (2012) In-line rheometry of micro cement based grouts - A promising new industrial application of the ultrasound based UVP + PD method. Appl. Rheol. 22 (4) 42783-1-42783-11. [ Links ]
WIKLUND J, SHAHRAM I and STADING M (2007) Methodology for in-line rheology by ultrasound Doppler velocity profiling and pressure difference techniques. Chem. Eng. Sci. 62 4159-4500. [ Links ]
WIKLUND J, STADING M and TRÄGÄRDH C (2010) Monitoring liquid displacement of model and industrial fluids in pipes by inline ultrasonic rheometry. J. Food Eng. 99 330-337. [ Links ]
WIKLUND J, KOTZÉ R, BIRKHOFER B, RICCI S, MEACCI V, HALDENWANG R and STADING M (2014) Flow-VizTM - A fully integrated and commercial in-line fluid characterization system for industrial applications. Proceedings of the 9thInternational Symposium on Ultrasonic Doppler Methods for Fluid Mechanics and Fluid Engineering, Strasbourg, France, 27-29 August 2014. 165-168. [ Links ]
WUNDERLICH TH and BRUNN PO (1999) Ultrasound pulse Doppler method as a viscometer for process monitoring. Flow Meas. Instrum. 10 201-205. [ Links ]
Received: 12 February 2015
Accepted in revised form 15 September 2015
* To whom all correspondence should be addressed. e-mail: kotzer@cput.ac.za

