


Serviços Personalizados
Artigo
 Inglês (pdf)
 Artigo em XML
 Referências do artigo
Indicadores

Links relacionados
-
 Citado por Google
 -
 Similares em Google
Compartilhar

 Permalink
Water SA
versão On-line ISSN 1816-7950
versão impressa ISSN 0378-4738
Water SA vol.41 no.4 Pretoria Jul. 2015
http://dx.doi.org/10.4314/WSA.V41I4.17
ARTICLES
Water footprint of growing vegetables in selected smallholder irrigation schemes in South Africa
Patrick NyamboI; Isaiah IC WakindikiI, II, *
IDepartment of Agronomy, University of Fort Hare, Private Bag X1314 Alice 5700, South Africa
IISoil Science Programme, Agricultural Research Council-Institute of Soil Climate and Water, Private Bag X79 Pretoria 0001, South Africa
ABSTRACT
Crop water footprint (WF) is the volume of fresh water used to produce a certain crop in all the steps in the production line. The CROPWAT model was used to calculate crop evapotranspiration, differentiating green and blue water in Zanyokwe (ZIS), Thabina (TIS) and Tugela Ferry (TFIS) Irrigation Schemes. Green beans had the highest water footprint in all three irrigation schemes with 3 535.7 m3/t in TIS, 2 753 m3/t in TFIS and 2 407.6 m3/t in ZIS. Cabbage had the lowest water footprint. The highest water footprint for growing cabbage was 254.5 m3/t in TFIS, followed by 223.1 m3/t in TIS, and the lowest was 217.8 m3/t in ZIS. Green WF represented the highest percentage of water use at ZIS (50.5%), followed by blue water at 26.5% while grey water constituted 22.9%. At TFIS blue, green and grey water use was 23.1%, 56.7% and 20.2%, respectively. The differences observed in the WF of different crops and different schemes were attributed to the differences in weather and environmental characteristics. Green beans had the highest grey water footprint, i.e., 373 m3/t and the lowest was cabbage with 37 m3/t. Potato, spinach and tomatoes had footprints of 156 m3/t, 214 m3/t and 132 m3/t, respectively. For future research it is necessary to consider the possibility and trade-offs of shifting production of each crop to the places where it is most efficient, and to focus on blue water scarcity in each of the case study locations
Keywords: smallholder irrigation schemes, water footprint, evapotranspiration, water use
INTRODUCTION
Fresh water has become a scarce and over-exploited natural resource (UNESCOWWAP, 2006; Ridoutt and Pfister, 2010). Consequently, agriculture is under intense pressure to reduce depletion of water sources, the pollution of water systems and its contribution to soil infertility and erosion (FAO, 2010). According to Fanadzo et al. (2010) and Mnkeni et al. (2010), the decline in available freshwater resources in South Africa is caused and exacerbated by ignorance, and improper measurement and monitoring of water use in smallholder irrigation schemes (SHIS). Therefore, in order to minimise this decline within the South African SHIS, measurements and reports highlighting and addressing high water use in their operations and product life cycles, are necessary (Chapagain and Orr, 2009).
The water footprint (WF) (Hoekstra, 2002; Hoekstra and Chapagain, 2008) is an important tool for considering water conservation impacts from a variety of farm management options (Dourte and Fraisse, 2012). The WF concept expresses the virtual water content of products, organizations, people and nations, in a spatially and temporally explicit way (Hoekstra and Hung, 2002). Dourte and Fraisse (2012) defined WF as the comprehensive measure of freshwater consumption that connects consumptive water use to a certain place, time, and type of water resource. A crop WF is the volume of freshwater used to produce a certain crop in all the steps in the production line. It is a multi-dimensional indicator, showing water consumption volumes by source and polluted volumes by type of pollution; all components of a total water footprint are specified geographically and temporally (Hoekstra et al., 2009). The concept includes three types of virtual water, blue, green and grey. Blue-water footprint (WFblue) of a crop refers to the volume of irrigation water that evaporates from a crop field during the growing season. Green-water footprint (WFgreen) is the volume of rainwater that evaporates from a crop field (Hoekstra, 2009). Grey-water footprint (WFgrey) refers to pollution and is defined as the volume of freshwater that is required to assimilate the load of pollutants based on existing ambient water quality standards (Ercin, 2011). A crop WF is dependent on climatic and specific crop parameters collected over time.
Hitherto, various studies on crop WF have been carried out around the world, where estimation was done for crops such as wheat (Mekonnen and Hoekstra, 2010), cotton (Chapagain et al., 2005), tea and coffee (Chapagain and Hoekstra, 2007) and rice (Chapagain and Hoekstra, 2010). In South Africa, WF research is scant. The few available reports concentrate on domestic consumption, power and processing industries. For example, Unilever (2009) quantified the total water use for a wide range of its products, while SABMiller and WWF (2009) focused on the company's WF in beer production.
On the other hand, studies on SHIS have focused on assessing their performance (Bembridge, 2000, Mnkeni et al., 2010; Crosby et al., 2000). Yokwe (2009) evaluated the performance of the Zanyokwe Irrigation Scheme (ZIS) from an economic point of view, while Shongwe (2007) evaluated the water distribution at the Tugela Ferry Irrigation Scheme (TFIS). Low yield levels and limited knowledge of crop production were identified as one of the constraints to improved crop productivity (Fanadzo et al., 2010). Machete et al. (2004) and Mnkeni et al. (2010) identified water mismanagement as the main agronomic factor limiting productivity in ZIS. Mnkeni et al. (2010) further noted little control in the usage of water, resulting in problems of over-application. According to Ntsonto (2005) good irrigation management is a problem in many schemes with ZIS farmers not using water efficiently. A study by Yokwe (2009) highlighted the need to improve water productivity in smallholder irrigation, while Mnkeni et al. (2010) stated that priority should be put on the scope of increasing water productivity at irrigation schemes by ensuring its availability and effective distribution within the schemes.
This research was undertaken to estimate water footprints of vegetable production under smallholder agriculture, this will generate information for further reducing poverty and sustainable development. Particular attention was given to the green-, blue- and grey-water footprint of 5 vegetable crops in the production cycle at ZIS, TFIS and TIS in the Eastern Cape, KwaZulu-Natal and Limpopo provinces, respectively. The estimates were done in a spatially-explicit way, from a production perspective, using a conceptual framework based on the FAO CROPWAT approach (Allen et al., 1998)
METHODS AND DATA
This study focused on the production stage, that is, the cultivation of the vegetables, from sowing to harvesting, during the 2000-2013 period. Crop WF estimates were calculated following the Crop Water Requirement (CWR) option, which estimated evapotranspiration under optimal conditions, which means that crop evapotranspiration (ETc) equals CWR (Hoekstra et al., 2011). WFblue and WFgreen of vegetable crops produced at each scheme were quantified by taking into account local climatic and soil conditions in the respective provinces. Local nitrogen fertilizer rates applied were used to calculate the grey water. Crop evapotranspiration was calculated using a grid-based dynamic water balance model, which computes a daily water balance and calculates crop water use and requirements. Computations of vegetable crop evapotran-spiration and yield were carried out following the method and assumptions provided by Allen et al. (1998). The CROPWAT 8.0 model, a computer program for the calculation of crop water and irrigation requirements based on soil, climate and crop data, was used to estimate crop water use. It calculates reference evapotranspiration, crop water requirements and crop irrigation requirements.
Study area
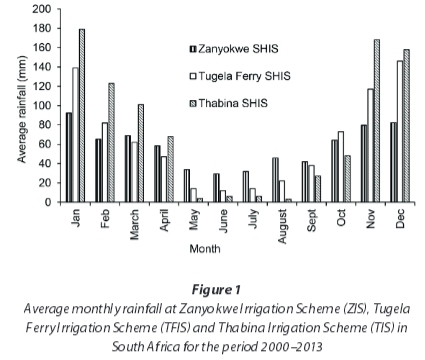
The climate in the ZIS scheme is semi-arid and relatively mild, with a mean annual rainfall of about 580 mm of which about 445 mm is received in summer. Tugela Ferry Irrigation Scheme is situated in a dry to semi-arid zone, with a mean rainfall of 600-700 mm per annum and very high summer temperatures of up to 44°C (Cousins, 2013). Annual rainfall averages at TIS are 790 mm with drastic inter-annual variations, recurrent droughts and long dry seasons (Jordaan and Grove, 2012). Monthly rainfall and temperature averages for the study period 2000-2013 are shown in Fig. 1.
Evapotranspiration (ETc)
The actual crop evapotranspiration (ETc, mm/day) was calculated using Eq. 1 (Allen et al., 1998, Mekonnen and Hoekstra, 2011).

where: Kc is the crop coefficient, Ks[t] a dimensionless transpiration reduction factor dependent on available soil water; ETO [t] the reference evapotranspiration (mm/day).The value of Ks was calculated on a daily basis as a function of the maximum and actual available soil moisture in the root zone. The amount of rainfall lost through runoff was computed using Eq. 2, as in the Hydrologiska Bryans Vattenbalansavdelning (HBV) model (Bergstrom, 1995; Lid and Harlin, 2000; Mekonnen and Hoekstra, 2011).
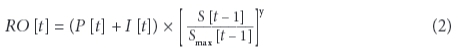
where: RO [t] is the runoff on day t [mm]; P [t] is the precipitation on day t (mm); I [t] is the net irrigation depth on day t that infiltrates the soil (mm). The value of parameter Y was adopted from Siebert and Doll (2010). The irrigation requirement was determined based on the root zone depletion using Eq. 3. The actual irrigation I [t] depended on the extent to which the irrigation requirement was met:

where: α was the fraction of the irrigation requirement that was actually met. Following the method as proposed in Hoekstra et al. (2009) and also applied by Mekonnen and Hoekstra (2010), Siebert and Doll (2010), 2 scenarios were used, one with α = 0 (no application of irrigation, i.e., rain-fed conditions) and the other with α = 1 (full irrigation).
The measures of green-water evapotranspiration were derived from the minimum values between total crop ET and effective precipitation (Hoekstra et al., 2011). The green-water footprint of vegetable crop production was calculated as a total of the rainwater evaporated from the field during the crop growing period, given as the green component of crop water use (WFgreen) divided by the yield t/ha (m3/ha). The WFblue of vegetable crop production was calculated as the blue component of crop water use, i.e., water from ground or open body surfaces such as rivers and lakes, following a procedure in the manual by Hoekstra et al. (2011).
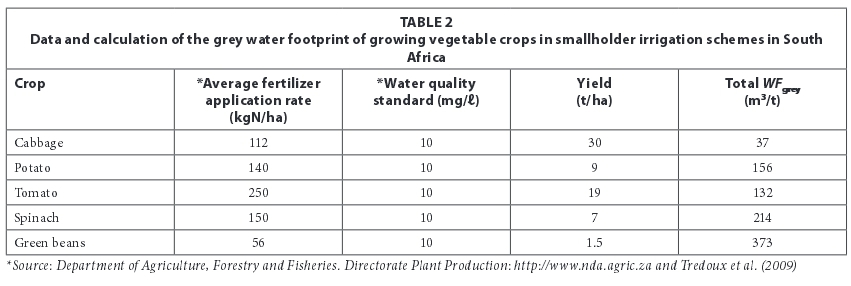
The WFgrey of vegetable crop production was calculated by quantifying the volume of water needed to assimilate the fertilizers that reach ground or surface water. Nutrients leaching from agricultural fields are the main cause of non-point source pollution of surface and subsurface water bodies. In this study, quantification was done for the grey-water footprint related to nitrogen use only. The WFgrey m3/t was calculated by multiplying the fraction of nitrogen that leached (θ, %) by the local nitrogen application rate (AR, kg/ha) and dividing this by the difference between the maximum acceptable concentration of nitrogen (Cmax, kg/m3) and the natural concentration of nitrogen in the receiving water body (Cnat , kg/m3) and by the actual individual vegetable crop yields (Ya) as given in Eq. 4.

The grey-water component was calculated based on the application of nitrogen (N) fertilizer only to the vegetable crop field. The average N fertilizer rates applied to the vegetables were obtained from the agricultural extension officers in the Department of Agriculture. The nitrate leaching fraction was assumed to be 10% of the applied fertilizer rate. The natural concentration of N in the receiving water body was assumed to be zero (Tredoux et al., 2009). Only N fertilizer use was incorporated into the calculations of the WFgrey , as N is the most critical pollutant with the greatest application rate (Hoekstra, 2009). Due to unavailability of data, only the recommended fertilizer application rates were used for grey-water footprint estimation at all three SHIS (Table 3).
Economic water productivity (EWP)
Economic water productivity (EWP) (in ZAR/m3) represents the economic value of farm output per unit of water consumed and is calculated as the average producer price for the period 2000-2013 (in ZAR/t). The market price of the vegetable crops was obtained from the abstract of agricultural statistics (DAFF, 2013). The following equation was used to calculate the EWP within the SIS.

where: EWP is the economic water productivity, the summation is done over the years considered from 2000-2013. WF green and blue is the summation of blue- and green-water footprints. The EWP calculations were done following studies done by Schyns and Hoekstra (2014).
RESULTS
It was assumed that farmers in the three SHISs got the same average yield and used the recommended planting dates for each crop (Table 1). This was because year-on-year yield and planting date data were not available for each of the three SHIS for the period 2000-2013. Yield averages and planting dates for the five vegetable crops used in the study were obtained from the extension officers' in the Department of Agriculture. Crop coefficients of different vegetable crops were taken from Allen et al. (1998).

Blue water evapotranspiration
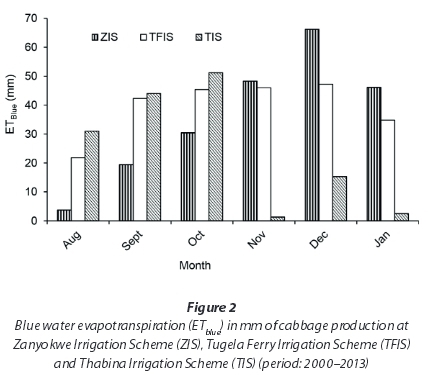
A general increase in ETbluefrom August to December with a decrease in January was noted. The total average ETblue for ZIS for the entire cabbage growing season was 214.1 mm (Fig. 1). At TFIS the highest average monthly ETbluefor cabbage, i.e., 47.2 mm and occurred in December, the lowest was 21.8 mm in August. The total average ETblue for ZFIS in the whole cabbage growing season was 237.5 mm and was the highest among the three schemes. TIS had lowest total average ETblue of 145.3 mm. The highest monthly ETblue (51.2 mm) occurred in October whilst the lowest volume, i.e., 2.5 mm occurred in January. Green beans had the least growing period. Average monthly ETbluegenerally increased from October, peaked in December then dropped in January (Fig. 2). The average total ETbluefor the whole green bean growing season varied amongst the schemes. ZIS had the highest amount of ETblue at 103.3 mm; TFIS had 69.9 mm and the lowest was for TIS with an average of 19.2 mm.
Green water evapotranspiration
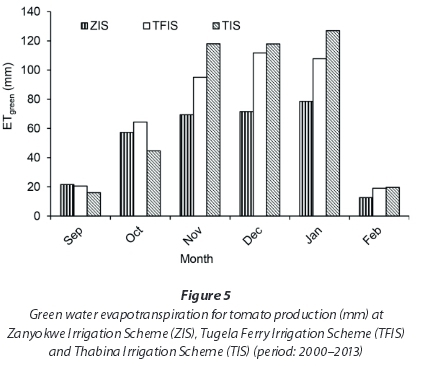
Generally, ZIS had the highest total ETgreenfor the full period of the potato growing season (137 mm). TFIS had 74.1 mm while the TIS had the lowest evapotranspiration at 36.1 mm. The highest monthly ETgreen for both TFIS and TIS was in April (Fig. 3). Of the two schemes, TIS had the highest evapotranspiration of 22.8 mm whilst TFIS had 18.7 mm, which was the lowest. The highest monthly ETgreen for ZIS was observed in August, i.e., 30.6 mm. ZIS, unlike the other two schemes had its lowest ETgreen in April (18.5 mm). TIS' lowest ETgreen was 1.1 mm in August and 12.8 mm for TFIS in June. A rise was noted in ETgreen from the tomato growing season starting from September to January and a decrease was observed in the month of February (Fig. 4). Early in the production of tomato, TIS had the lowest evapotranspiration of 16 mm but it ended up with the highest evapotranspiration. The average of total ETgreen of the whole season growing tomatoes TIS had the highest average of 443.2 mm followed by TFIS having 418.5 mm and ZIS had the lowest average of 311.1 mm. The highest monthly ETgreen was in November for TIS it had 118 mm, TFIS had 111.7 mm in December. ZIS had the highest monthly ETgreen in January green having 78.6 mm. The lowest monthly ETgreen for TIS was 16 mm, TFIS had 19 mm and ZIS had 12.6 mm.


Blue and green water footprint
The average water footprint per ton of primary crop differs significantly among crops and across production regions. The WFblue for cabbage production was highest at TFIS, i.e., 79.2 m3. At ZIS the WFblue, was 71.4 m3/t while the lowest amount water was being used at TIS (48.4 m3/t). Green beans had the highest WFblue of all the crops in the three SHISs with TIS and ZIS having averages of 1280 m3/t and 688.6 m3/t respectively, while at TFIS the average is 466 m3/t (Table 2). In potato production, TFIS used more blue water with an average of 205.2 m3/t as compared to 251.7 m3/t and 77.7 m3/t observed at TIS and ZIS respectively. The lowest amount of blue water calculated at TIS was in the production of tomato with an average of 44.6 m3/t. Generally, the average total blue water footprint for production of the five vegetable crops at ZIS is 1 053.7 m3/t; at TFIS its 1040.7 m3/t while the TIS had the highest total average blue water footprint 1 743.8 m3/t.
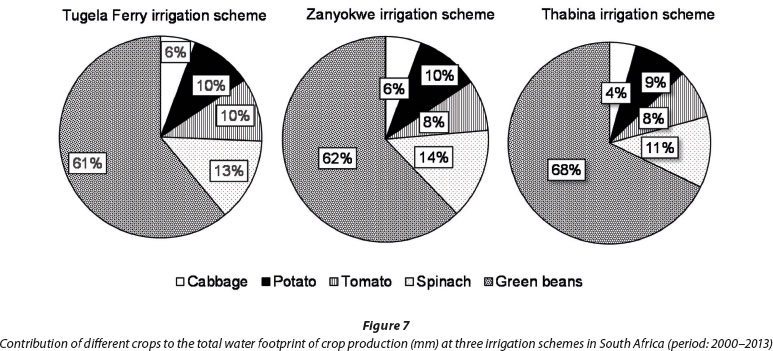
The WFgreen for green beans at TFIS was 1914 m3/t followed by TIS with 1 882.7 m3/t and 1 346 m3/t at ZIS. Within ZIS, potatoes had the lowest WFgreen (152.2 m3/t) and the highest being green beans. The same scenario was observed at both TFIS and TIS, where potatoes had the lowest WFgreen and green beans had the highest (Table 2). The study showed that TIS's WFgreen for cabbage production was 137.7 m3/t, while TFIS had 138.3 m3/t. The sum of the WFgreen at the three SHIS revealed that TFIS and TIS used almost the same green water in the production of the five vegetable crops, i.e., 2 561.3 m3/t and 2 556.6 m3/t respectively, while ZIS had lowest total (2 009 m3/t). Amongst the crops green beans had the highest percentage of WF contribution at all the schemes, 62% at ZIS, 68% at TIS and 61% at TFIS (Fig. 5). Cabbage had the lowest percentage contribution in all the three schemes. Green WF had the highest percentage of the water use at ZIS (50.5%), blue water 26.5% while grey water constituted 22.9%. At TFIS blue green and grey water use was 23.1%, 56.7% and 20.2% respectively. Forty-nine (49) of the water footprints at TIS were attributed to green WF, 33.5% to blue and 17.5% to grey WF.
Economic water productivity
Economic water productivity was observed to be lowest in the vegetable crops that had highest blue plus green water in the period 2000-2013. Cabbage had the highest economic water productivity at all the three irrigation schemes, i.e., ZAR 11.02, ZAR 9.16 and ZAR10.70 at ZIS, TFIS and TIS, respectively (Fig. 6). Likewise green beans which had the highest blue plus green water at all three irrigation schemes had the lowest economic water productivity, ZAR 0.98 at ZIS, ZAR 0.84 at TIS. Vegetable production had more value per drop at ZIS then TIS and lastly at TFIS in all the five crops.

Grey water footprint
It was observed that green beans had the highest WFgrey , i.e., 373 m3/t and the lowest was cabbage with 37 m3/t (Table 2). Potato, spinach and tomatoes had 156 m3/t, 214 m3/t and 132 m3/t respectively.
DISCUSSION
Blue and green water evapotranspiration
ET demand of a crop is a measure of how much water can be consumed via soil evaporation and plant transpiration assuming that plant- available water is adequate (Andales et al., 2011). ETblue is mostly irrigation water, which is often used to offset the impact of rainfall variability on crop yield and to reduce the risk associated with weather variability (Guerra et al., 2005). Generally, ETblue was lower than ETgreen at all the three sites (Figs 1-4), possibly because the vegetable crops were produced under rain-fed conditions. Irrigation is usually used as a supplement to shortages during the growing season.
Different vegetable crops have different blue and green ET at the three sites; this may be attributed to the differences in weather and environmental characteristics in the three locations. According to Dukes et al. (2012), the needs for ET are primarily dependent on soil type, crop growth and development which are closely related to climatic demands. The ET demand varies from day to day depending on crop growth stage and weather variables (Andales et al., 2011). Vegetable crops have a high requirement for water during the growth season, which could be the reason for the high ET in the three SHISs. The differences in ET of crops at the same SHIS could be due to the physiology and biology of the crops; for example, some crops have inherently high transpiration than others. For example at ZIS the ETbluefor cabbage was the highest at 328.1 mm, tomatoes had 311.1 mm and the lowest ETblue, at the same irrigation scheme was observed in green beans, i.e. 201.9 mm. The differences can also be seen in among the SIS were for spinach ETblue values of 166.4 mm, 144.5mm and 183.5 mm were observed at ZIS, TFIS and TIS respectively. Krug et al. (2002), noted that evapotranspiration and crop coefficient varies in the course of the season because morphological and eco-physiological characteristics of the crop do change over time.
Water footprint of growing vegetable crops
The study finds that WFgreen is dominant, making up 50.5% at ZIS, 56.7% at TFIS and49% at TIS. This highlights the fact that green water is a very important resource for food production at the SIS and globally. This was the case in studies done by Schyns and Hoekstra, (2014) and Mekonnen and Hoekstra (2011) where WFgreen was 77% in Morocco and a global WFgreen of 78% respectively. Results from the current study are relatively higher than those of similar studies done in other countries. Chapagain and Orr (2009) found the national virtual water contents of Spanish tomatoes were 60.5 m3/t for WFblue and 13.6 m3/t for WFgreen Mekonnen and Hoekstra (2011) calculated the global average blue and green WF of tomatoes to be 63 m3/t and 108 m3/t, respectively. Aldaya et al. (2010), calculated Italian tomato production to have 35 m3/t WFgreen and 60 m3/t WFblue. Mekonnen and Hoekstra (2011), the global WFblue, and WFgreen of cabbage production was 181 m3/t and 26 m3/t respectively, these are considerably lower than the results observed in this study (Table 2). One possible reason could be the low yields that smallholder farmers get and the difference in planting dates (Table 1), the lower the yields the higher the water footprint everything else remaining constant. This was also suggested by Mekonnen and Hoekstra (2011), were they observed that crops with a higher yield or a large fraction of crop biomass that is harvested generally have a smaller water footprint per ton than crops with a low yield or a small fraction of crop biomass harvested. Contrary to the above findings, the results of this study can possibly be attributed to the differences in production and weather characteristics as alluded to by Gerbens-Leenes et al. (2008). Ridoutt and Pfister (2013) and Mekonnen and Hoekstra (2011) also highlighted that the potential environmental impacts related to water use are different from one location to another. Jordaan and Grove (2012) observed that blue water required to produce cabbages and carrots at ZIS was 763 m3/t and 273 m3/t respectively. These results are significantly different from the WFblue observed in this study. The difference can possibly be attributed to a variety of causes, including: type of model, spatial resolution, the period considered and data regarding cultivated and irrigated areas, growing periods, crop parameters. The SAPWAT programme used in the above study uses climatic data from 1957 to 1999 (Van Heerden and Crosby, 2008). Another important factor is the change in the length of the growing period may notably vary the crop water use and thereafter the green and blue water footprint obtained (Chico et al., 2010). The differences indicate that the methodology applied is sensitive to input of climatic data and assumptions concerning the start of the growing season (Gerbens-Leenes et al., 2008).
To help reduce the water footprint within the smallholder irrigation schemes, it is important to take the timing of crop water demands with respect to natural water availability into account in deciding which crops or crop varieties to grow (Schyns and Hoekstra, 2014). Other ways of helping reduce the WF within the SIS would be to introduce measures like mulching, conservation tillage, and small-scale water harvesting techniques which increase infiltration and reduce runoff and evaporation. Although it is mostly the farmers choice on which vegetable crops to grow, they can however be advised especially through extension agents to focus more on crops that give a high income per drop of water. The choice of a vegetable, variety length of growing season largely determines the final WF. For example at ZIS rainfall is erratic and low throughout the year, short season varieties can be grown especially in the summer season where the amounts rainfall is mostly concentrated (Fig. 1). At TIS they receive high rainfall during the summer hence it is advisable to produce vegetable during this period (Nov-March). According to the results from the current study it is advisable to shift green beans production from TIS to both ZIS and TFIS while tomato production can be shifted to ZIS and TIS were it has a higher EWP value (Fig. 6).
There are a number of uncertainties and limitations to the study of WF. According to Chenoweth et al. (2014), a variety of methodologies have been developed for water foot printing which differ with respect to how they deal with different forms of water use, this creates some understandable scepticism and hesitance when it comes to interpreting the meaning and relevance of different water footprint estimates. Estimates of WF in this study were largely affected by the unavailability of data as most smallholder farmers do not keep records of the actual yields and chemicals used during a particular season. Different farmers manage their crops differently hence there is need to do a hands on study where the farmers are monitored and real time data collected for purposes of accurately predicting the WF of each crop. Usually smallholder farmers do not sell all their crops to the market, some they use for home consumption while some is sold at the farm at relatively lower prices than the market. This presents a challenge because no actual yield data and price is available for a proper economic water productivity analysis.
SUMMMARY AND CONCLUSIONS
The study shows that the water footprint of vegetable production varies within different irrigation schemes in different regions for the period 2000-2013. The grey water footprint is relatively small and was assumed to be the same at all the irrigation schemes, this is because only nitrogen fertilizer leaching from the SHIS was considered, leaving out other pollutants such as pesticides and herbicides. This was done due to the unavailability of the actual application rates of the other chemicals. Planting period used in the study were obtained from the Department of Agriculture and literature reviews. It was, however, noted that there is variation of the same crop in the planting dates even within the same schemes and across the country. The choice of the planting and harvesting dates out of these ranges obviously influences the final crop water footprint estimate. Blue water is only required when the green water store in the soil runs short, so it is important that farmers synchronise their planting dates with the rainy seasons so that they can reduce on the use of blue water and make use of the green water in vegetable production.
TIS had the highest WF followed by TFIS whilst ZIS had the lowest. There are large differences in WF in SHIS that are caused by a number of factors, chief among them are weather and production practices. More water is used in crop production within SHISs in SA compared to other countries as evidenced by the high WF observed in this study. This can be an indicator that the yield is not proportional to the drop of water, hence a need to increase crop output. Thabina Irrigation Scheme had the highest WFbluein green beans and potato and the least in tomatoes. Green beans WFblue at observed TIS was 1280 m3/t, and ZIS had 688.6 m3/t while the lowest was observed at TFIS (466 m3/t). TFIS had the highest WFblue in cabbage, spinach and tomatoes. However, the results show that there is more WFgreen in vegetable production at all the three sites except for potato at both TFIS and TIS. WFgreen is highest in green beans compared to the other crops in all the SHISs. The results also show that in potato production, more blue water was used with the highest WFgreen recorded at ZIS. Spinach and tomatoes had the highest WFgreen at TIS. An improvement in the production practices and ultimate yield is necessary to reduce the WF for improving water use efficiency.
REFERENCES
ALDAYA MM and LIAMAS MR (2010) Water footprint analysis (hydrologic and economic) of the Guadania river basin. UN World Water Development Report No. 3. The United Nations World Water Assessment Programme, Side Publications Series, Scientific Paper. UNESCO, Paris. [ Links ]
ALLEN RG, PEREIRA LS, RAES D and SMITH M (1998) Crop evapotranspiration: guidelines for computing crop water requirements. FAO Drainage and Irrigation Paper 56. FAO, Rome. [ Links ]
ANDALES AA, CHAVEZ LL and BAUDER TA (2011) Irrigation scheduling: the water balance approach. Fact Sheet No. 4.707. Colorado State University Cooperative Extension, Fort Collins, Colorado. URL: http://www.ext.colostate.edu/pubs/crops/04707.pdf. [ Links ]
BEMBRIDGE TJ (2000) Guidelines for rehabilitation of small-scale farmer irrigation schemes in South Africa. WRC Report No 891/1/00. Water Research Commission, Pretoria. 163 pp. [ Links ]
BERGSTROM S (1995) The HBV model. In: Singh VP (ed.) Computer Models in Watershed Hydrology. Water Resources Publications, USA. 443-476. [ Links ]
CHAPAGAIN AK and HOEKSTRA AY (2007) The water footprint of coffee and tea consumption in the Netherlands. Ecol. Econ. 64 109-118. [ Links ]
CHAPAGAIN AK and HOEKSTRA AY (2010) The green, blue and grey water footprint of rice from both a production and consumption perspective. Ecol. Econ. 70 749-758. [ Links ]
CHAPAGAIN AK and ORR S (2009) An improved water footprint methodology linking global consumption to local water resources: a case of Spanish tomatoes. J. Environ. Manage. 90 1219-1228. [ Links ]
CHAPAGAIN AK, HOEKSTRA AY SAVENIJE HHG and GAUTAM R (2005) The water footprint of cotton consumption: an assessment of the impact of worldwide consumption of cotton products on the water resources in the cotton producing countries. Ecol. Econ. 60 186-203. [ Links ]
CHENOWETH J, HADJIKAKOU M and ZOUMIDES C (2014) Quantifying the human impact on water resources: a critical review of the water footprint concept. Hydrol. Earth Syst. Sci. 18 2325-2342. [ Links ]
CHICO D, SALMARAL G, LLAMAS M R, GARRIDO A and ALDAYA MM (2010) The water footprint and virtual water exports of Spanish tomatoes, roles of virtual water. Water Observ. 51 649-2010. [ Links ]
COUSINS B (2013) Smallholder irrigation schemes, agrarian reformand 'accumulation from above and from below. S. Afr. J. Agrar. Change 13 116-139. [ Links ]
CROSBY CT, DE LANGE M, STIMIE CM and VAN DER STOEP I (2000) A review of planning and design procedures applicable to small-scale farmer irrigation projects. WRC Report No. 578/2/00. Water Research Commission, Pretoria. 241 pp. [ Links ]
DOURTE RD and FRAISSE CW (2012) What is a water footprint: overview and applications in agriculture. University Of Florida IFAS Extension, USA. URL: http://edis.ifas.ufl.edu/ae484. (Accessed 15 April 2013). [ Links ]
DUKES MD, ZOTARELLI L, LIU GD and SIMONNE EH (2012) Principles and practices of irrigation management for vegetables. URL: http://edis.ifas.ufl.edu/8C8E6E74-167E-4FCC-84EC-5F79E8DAC05A/FinalDownload/DownloadId-AA7592646A25BE6EE1A2422CE83EC598/8C8E6E74-167E-4FCC-84EC-5F79E8DAC05A/pdffiles/CV/CV10700.pdf (Accessed 21 March 2014). [ Links ]
ERCIN AE, ALDAYA MM and HOEKSTRA AY (eds) (2011) The water footprint of soy milk and soy burger and equivalent animal products. Value of Water Research Report Series No.49 UNESCO-IHE, The Netherlands. URL: http://www.waterfootprint.org (Accessed 15 April 2013). [ Links ]
FANADZO M, CHIDUZA C and MNKENI PNS (2010) Overview of smallholder irrigation schemes in South Africa: Relationship between farmer crop management practices and performance. Afr. J. Agric. Res. 25 3514-3523. [ Links ]
FAO (2010) FAOSTAT online database. URL: http://faostat.fao.org (Accessed 1 October 2013). [ Links ]
GERBENS-LEENES PW, HOEKSTRA AY and VAN DER MEER TH (2008) Water footprint of bio-energy and other primary energy carriers. Value of Water Research Report Series No. 29, March 2008. UNESCO-IHE, Delft. [ Links ]
GUERRA LC, GARCIA AG, HOOGENBOOM G, HOOK JE, HARRISON KA and BOKEN VK (2005) Impact of local weather variability on irrigation water use in Georgia. In: Proceedings of the 2005 Georgia Water Resources Conference, 25-27 April 2005, Athens. [ Links ]
HOEKSTRA AY (2002) Virtual water trade. In: Proceedings of the International Expert Meeting on Virtual Water Trade, 12-13 December 2002, The Netherlands. Value of Water Research Report Series No.12. UNESCO-IHE, Delft. [ Links ]
HOEKSTRA AY (2009) Human appropriation of natural capital: A comparison of ecological footprint and water footprint analysis. Ecol. Econ. 68 1963-1974. [ Links ]
HOEKSTRA AY and CHAPAGAIN AK (2008) Globalization of water: sharing the planet's fresh water resources. Wiley-Blackwell Publishing, Oxford, UK. [ Links ]
HOEKSTRA AY and HUNG PQ (2002) Virtual water trade: a quantification of virtual water flows between nations in relation to international crop trade. In: Value of Water Research Report Series No. 11. UNESCO-IHE, Delft. URL: http://www.ihe.nl/vmp/articles/Projects/PRO-Virtual_Water_Trade.html (Accessed 4 March 2014). [ Links ]
HOEKSTRA AY, CHAPAGAIN AK ALDAYA MM and MEKONNEN MM (2011) The Water Footprint Assessment Manual: Setting the Global Standard. Earth Scan, London. [ Links ]
HOEKSTRA AY, CHAPAGAIN AK, ALDAYA M and MEKONNEN MM (2009) Water Footprint Manual: State of the Art. Water Footprint Network, Enschede, The Netherlands. [ Links ]
JORDAAN H and GROVE B (2012) An economic analysis of the contribution of water use to value chains in agriculture. WRC Report No. 1779/1/12. Water Research Commission, Pretoria. [ Links ]
LID ER and HARLIN J (2000) Analysis of conceptual rainfall-runoff modelling performance in different climates. J. Hydrol. 238 231-247. [ Links ]
MACHETE CL, MOLLEL N, AYISI K, MASHATOLA MB, ANIM FDK and VANASSCHE F (2004) Smallholder irrigation and agricultural development in the Olifants river basin of Limpopo province: management transfer, productivity, profitability and food security issues. WRC Report No. 1050/1/04. Water Research Commission, Pretoria. [ Links ]
MEKONNEN MM and HOEKSTRA AY (2010) A global and high resolution assessment of green, blue and grey water footprint of wheat. Hydrol. Earth Syst. Sci. 14 1259-1276. [ Links ]
MEKONNEN MM, HOEKSTRA AY (2011) The green, blue and grey water footprint of crops & derived crop products. Hydrol. Earth Syst. Sci. 15 1577-1600. [ Links ]
MNKENI PNS, CHIDUZA C, MODI AT, STEVENS JB, MONDE N, VAN DER STOEP I and DLADLA RW (2010) Best management practices for smallholder farming on two irrigation schemes in the Eastern Cape and KwaZulu-Natal through participatory adaptive research. WRC Report No. TT 478/10. Water Research Commission, Pretoria. [ Links ]
NTSANTO NE (2005) Economic performance of small holder irrigation scheme: a case study in Zanyokwe Eastern Cape, South Africa. MSc Thesis, University of Pretoria. [ Links ]
RIDOUTT BG and PFISTER S (2010) A revised approach to water foot printing to make transparent the impacts of consumption and production on global freshwater scarcity. Glob. Environ. Change 20 113-120. [ Links ]
RIDOUTT BG and PFISTER S (2013) A new water footprint calculation method integrating consumptive and degradative water use into a single stand-alone weighted indicator. Int. J. Life Cycl. Assess. 18 204-207. [ Links ]
SABMILLER & WWF (2009) Water foot printing: identifying and addressing the risks in the value chain. Report 2009. URL: www.sabmiller.com (Accessed 17 October 2013). [ Links ]
SCHYNS JF and HOEKSTRA AY (2014) The added value of water footprint assessment for national water policy: a case study for Morocco. PLoS ONE 9 (6) DOI: 10.1371/journal.pone.0099705. [ Links ]
SHONGWE M (2007) Water management practices in small-scale irrigation schemes in South Africa: a case of Tugela Ferry irrigation scheme in KwaZulu-Natal, South Africa. MSc Thesis, University of Pretoria. [ Links ]
SIEBERT S and DOLL P (2010) Quantifying blue & green virtual water contents in global crop production as well as potential production losses without irrigation. J. Hydrol. 384 198-217. [ Links ]
TREDOUX G, ENGELBRECHT P and ISRAEL S (2009) Nitrate in groundwater: Why is it a hazard and how to control it? WRC Report No. TT 410/09. Water Research Commission, Pretoria. [ Links ]
UNESCO-WWAP (2006) Water: A shared responsibility. The United Nations World Water Development Report 2. URL: www.unesco.org (Accessed 17 October 2013). [ Links ]
UNILEVER (2009) Unilever and sustainable agriculture. 10 July 2009. URL: www.unilever.com (Accessed on 21 August 2013). [ Links ]
VAN HEERDEN PS, CROSBY CT, GROVE B, BENAD EN, THERON E, SCHULZE RE and TEWOLDE MH (2009) Integrating and updating of SAPWAT and PLANWAT to create a powerful and user-friendly irrigation planning tool. WRC Report No. TT 391/08. Water Research Commission, Pretoria. [ Links ]
YOKWE S (2009) Water productivity in small irrigation schemes in South Africa. Agric. Water. Manage. 96 1223-1228. [ Links ]
Received 4 August 2014
Accepted in revised form 15 June 2015
* To whom all correspondence should be addressed. E-mail: wakindikii@arc.agric.za

