


Serviços Personalizados
Artigo
 Inglês (pdf)
 Artigo em XML
 Referências do artigo
Indicadores

Links relacionados
-
 Citado por Google
 -
 Similares em Google
Compartilhar

 Permalink
Water SA
versão On-line ISSN 1816-7950
versão impressa ISSN 0378-4738
Water SA vol.41 no.4 Pretoria Jul. 2015
http://dx.doi.org/10.4314/WSA.V41I4.12
ARTICLES
Application of hydropedological insights in hydrological modelling of the Stevenson-Hamilton Research Supersite, Kruger National Park, South Africa
JJ van TolI, *; GM van ZijlII; ES RiddellIII; D FundisiIII
IDepartment of Agronomy, University of Fort Hare, Alice, 5700, South Africa
IIDepartment of Soil, Crop and Climate Sciences, University of the Free State, Bloemfontein, 9300, South Africa
IIICentre of Water Resources Research, University of KwaZulu-Natal, Scottsville, 3209, South Africa
ABSTRACT
Soil information is increasingly sought after for hydrological modelling, as the importance of soil in the hydrological cycle is understood better. In this paper the output of a digital soil mapping exercise was used as the soil input into a distributed hydrological model (ACRU) for a test site within the Stevenson-Hamilton Research Supersite, Kruger National Park (South Africa). The aim was to determine the effect of parameterising a hydrological model with increased levels of soil information, at different scales. To accommodate this aim, ACRU was run in 3 different modes, each with increasing levels of input, on 3 catchments, including a 1st, 2nd and 3rd order catchment. The outputs evaluated included both streamflow and soil water content at selected soil profiles. Simulation accuracy increased with higher levels of soil input, as well as with increasing catchment size. The improved accuracy with increased soil input underscores the value of detailed soil information in modelling, while the improved results with increased catchment size show that the optimal scale for including soil information has not yet been reached.
Keywords: ACRU; digital soil mapping; hillslope hydrology; hydropedology; Kruger National Park
INTRODUCTION
With a growing awareness of the need to make predictions in ungauged basins (PUBs), the role of soil in hydrology is becoming increasingly recognized. Because soil can transmit, store and react with water (Park et al., 2001), it is a 1st order control in water storage, partitioning of hydrological flow paths and residence time distributions (Park et al., 2001; Soulsby and Tetzlaff, 2008). Although hydrologists agree that the spatial variation of soil properties significantly influences hydrological processes, they also recognise that they lack the skill to gather and interpret soil information (Lilly et al., 1998; Terribile et al., 2011).
There exists an interactive relationship between soil and hydrology. Although soil genesis is a function of climate, vegetation, topography, parent material and time (Jenny, 1941), it is largely these factors' influence on water which determines its influence on soil genesis. Thus, just as soil properties contain unique signatures of the way they were formed; it also contains signatures of the water regime under which it formed and which is still operating within the soil. As nearly all hydrologi-cal processes important to hydrologists are difficult to observe and measure (Sivapalan, 2003), correct interpretation of the soils' hydropedological signatures can provide valuable information as to the dominant hydrological processes (Ticehurst et al., 2007; Van Tol et al., 2010) and improve understanding of hydrological behaviour at the hillslope scale (Lin et al., 2006), which is the smallest scale used for holistically understanding hydrological processes (Tromp van Meerveld and Weiler, 2008).
Catchment hydrological response is dependent on the combination of the hydrological responses of the hillslopes which make up the catchment (Sivapalan, 2003). By understanding the hydrological signatures contained in the soils, conceptual qualitative 2-dimensional descriptions of the hydrological responses of the hillslopes wherein the soils occur can be created. Integration of the 2-D hillslope hydrological models leads to greater understanding of the catchment's hydrological response. Thus, interpreting soil hydrological signatures leads to understanding of hillslope hydrology, which in turn leads to understanding the hydrological response at catchment scale, and finally assists in PUBs.
Van Zijl and Le Roux (2014) generated a hillslope-based hydrological soil map of the 4 001-ha Stevenson-Hamilton Research Supersite (SHRS) in the Kruger National Park (KNP), by applying an expert knowledge digital soil mapping (DSM) approach to divide the soils of SHRS into different hydropedological classes as described by Van Tol et al. (2013). In their paper, Van Zijl and Le Roux (2014) maintain that the hillslope-based soil information will assist hydrological modelling within the area. In this study we hypothesize that Van Zijl and Le Roux (2014) are correct, and that their soil information can be used to improve the efficiency of hydrological models and hydrological modelling. We aimed, firstly, to illustrate how soil information in the form of a soil map can be disaggregated to configure the distributed ACRU hydrological model, and, secondly, to evaluate the contribution made by improved soil information to simulation accuracy for 3 modelling scales. The objective was therefore to treat the catchments as 'ungauged' and not to calibrate the model until satisfactory simulations were achieved, but rather to parameterise and configure the model with increasing levels of input accuracy.
The ACRU hydrological model
ACRU is an agrohydrological, daily time-step, multi-layered soil water budgeting model (Schulze, 1995) which can be run in lumped or distributed mode. The model partitions precipitation into stormflow or infiltration; the infiltrated water will only drain vertically to deeper horizons once the water content increases beyond the drained upper limit (DUL). Evaporation takes place in the topsoil horizon only, whereas transpiration is extracted from the entire root zone. Evaporative demand is estimated from the plant's growth stage and atmospheric demand (ET0). For more details on the model structure and water budgeting, the reader is referred to the theoretical manual (Schulze, 1995).
The standard version, ACRU2000, comprises of 2 soil layers (A and B- horizon) and a deep groundwater layer (GW). In a revised version of ACRU, namely ACRU-Int, an intermediate layer (INT) between the B horizon and GW was introduced by Lorentz et al. (2007). Soil inputs include: the thickness of soil horizons (m), permanent wilting point (PWP) (mm-1), drained upper limit (DUL) (m.m-1), saturation (Po) (m.m-1), plant available water (PAW) (m.m-1), drainage fractions (ABRESP, BFRESP and INTRESP), water contents at the start of simulation (SMAINI and SMBINI) expressed as a percentage of PAW, and the erodibility of the soil (K-factor). Except for the latter all inputs are required for all three soil horizons (Schulze, 2007).
The model allows redistribution of saturated water, i.e., between DUL and Po, from the A to the B-horizon (ABRESP), from the B-horizon to the intermediate layer (BFRESP) and from the intermediate layer to the groundwater (INTRESP). The distribution is expressed as a fraction of the water above DUL draining vertically downwards from the respective horizons on a daily time-step.
The intermediate layer has a mechanism whereby lateral release of water can be induced when certain threshold positive pressures at the saprolite/bedrock interface are achieved using a non-linear partial differential advection-dispersion function (ADF) (Lorentz et al., 2007):

where g(t) is the lateral response function, Dp a dispersion coefficient and τ the mean response time (days). In ACRU-Int the parameters RESDISP and RESTIME are used to describe Dp and τ respectively. The lateral releases from the intermediate zone can be routed to intermediate layers or groundwater stores of a downslope land segment. This is ideal for imitating flowpaths at hillslope scale. Small RESDISP and RESTIME values will result in water being routed quickly to downslope land segments. High RESDISP and RESTIME values will have the opposite effect - i.e., water transported laterally over a long time.
Two other important variables in ACRU-Int, not considered a soil input but definitely influenced by the soil, are QFRESP and COFRU. According to the definition QFRESP is: 'Stormflow response fraction for the catchment/subcatchment, i.e. the fraction of the total stormflow that will run off from the catchment/subcatchment on the same day as the rainfall event' (Smithers et al., 2004, ch. 5 p. 85?). QFRESP ranges between 0 and 1 and is inversely correlated with catchment area and will increase with an increase in slope angle, area covered by impervious material, and rainfall intensity. Soils prone to topsoil crusting as well as very shallow or very wet soils should therefore give high QFRESP values. The coefficient of baseflow response (COFRU) is the fraction of water from the INT/GW zones that becomes streamflow on a particular day (Smithers et al., 2004).
METHODOLOGY
Study area
The study site forms part of the 4 001-ha SHRS, near Skukuza in the Kruger National Park (Fig. 1). The entire site falls within one land type (namely Renosterkoppies; Venter, 1990); thus it has a uniform climate, geology and soil and vegetation distribution pattern. It is located in the wetter part of the KNP with a mean annual precipitation of 560 mm (Smit et al., 2013). The granite and gneiss of the Nelspruit Suite (Venter, 1990) gives rise to coarse-grained sandy soils of the Clovelly, Pinedene and Glenrosa forms (IUSS Working Group, 2014: Arenosols, Leptosols), while dolerite dykes provide the parent material for more clayey soils of the Bonheim and Valsrivier form (IUSS Working Group, 2014: Luvisols, Phaeozems) (Van Zijl and Le Roux, 2014). The landscape has a high stream density and is highly dissected (Smit et al., 2013). The elevation above sea level varies between 304 and 433 m, generally with gentle slopes of under 10%, but the slope angle can go up to 30% around rock outcrops. The dominant vegetation can be linked to the terrain position. On the crests Combretum apiculatum and Combretum zeyheri dominate the woody vegetation. Between the crest and the midslope Terminalia sericea indicates a commonly occurring seepline. The midslopes and footslopes are dominated by fine-leaved woody species, especially Acacia nilotica. Below seeplines the so-called sodic sites are found, where Sterkspruit soils (IUSS Working Group, 2014: Solonetz) (Van Zijl and Le Roux, 2014) and Eucleadi vinoriumis dominate (Smit et al., 2013). This study focused on an area in the south of SHRS (Fig. 1b). This area, comprising of 3 stream orders (Fig. 1) has been subjected to hydrometric instrumentation and continuous monitoring since November 2011.
The study area was divided into 3 stream or catchment orders (Fig. 1c). The 1st order catchment is approximately 10.8 ha, the 2nd order 42.7 ha and the total area (3rd order) is 148.2 ha. Obviously the 2nd order includes the entire 1st order and the 3rd order catchment includes the 1st and 2nd order.
ACRU simulations and evaluations
Rainfall data were available from 14 November 2011 and this was the starting date for simulations. Simulations were conducted for the 3 stream orders (Fig. 1) with 3 levels of soil detail. In the 1st level (ACRU_lumped for the remainder of this paper), homogenous soil was assumed, using area-weighted average soil parameters. The next level (ACRU2000) made use of the spatial distribution of the soils and associated properties as presented in Van Zijl et al. (2014). In the most detailed level (ACRU-Int), the spatial distribution of soils and associated properties were used to construct surface and subsurface routing of water paths. In the ACRU-Int simulations efforts were made to include all relevant site information available, for example the absence of groundwater, in the model configuration.
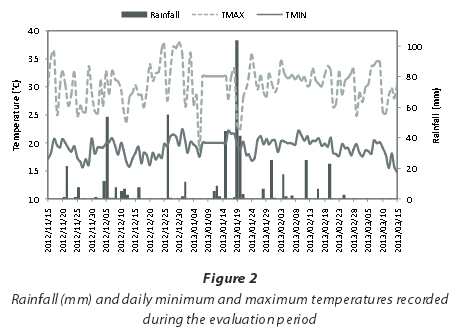
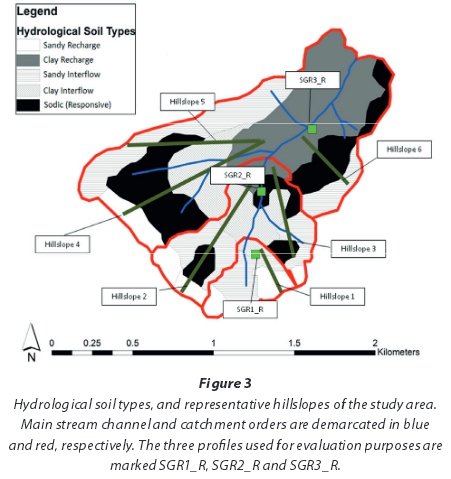
A 4-month period (15 November 2012 to 15 March 2013) was selected to evaluate the contribution of enhanced soil information to model outputs. This period was selected firstly to allow the model to 'settle' using observed climatic information (i.e. 14 November 2011 to 14 November) and secondly because detailed climatic information (Fig. 2) was available for the 4-month period starting on 15 November 2012 (Fig. 2). Simulation outputs were statistically compared to observed streamflow measured for each catchment order (Fig. 1), as well as against measured soil water potentials of selected soil profiles measured with Watermark sensors (Fig. 3). Soil water potentials were not yet calibrated against volumetric soil water content and only qualitative comparisons were possible at this stage. To ensure simplicity in visual comparisons measured tensions had to be log transformed and inversed.
Model parameterisation and configuration
Climatic information
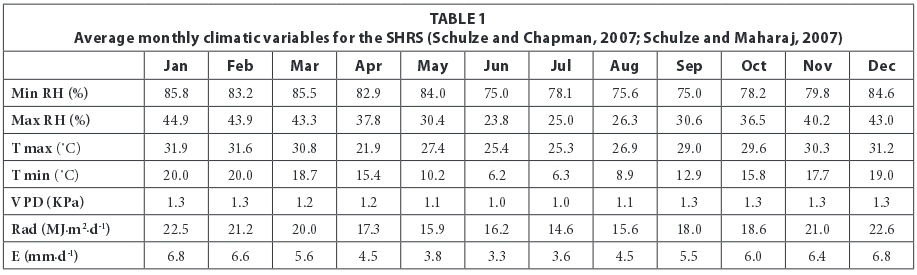
Rainfall was recorded with a Texas Instruments TE525 0.1 mm rain gauge since 14 November 2011. In November 2012 the latter was replaced with a compact Davis Vantage Pro 2 Automatic Weather Station logging rainfall (0.2 mm), temperature and relative humidity (RH) at 15-min intervals. Until November 2012, min and max RH and temperature were obtained as monthly averages from Schulze and Chapman (2007) and Schulze and Maharaj (2007); for the evaluation period daily measured data were used (Fig. 2). Vapour pressure deficit (VPD), solar radiation (Rad) and evaporation (E) presented in Table 1 were obtained for the site from Schulze and Chapman(2007) and Schulze and Maharaj (2007).
A total of 524.2 mm of rain was received during the evaluation period of which 194 mm was received between 15 and 22 January 2013 (Fig. 2). A total of 103.8 mm was recorded on 19 January. Between 7 and 14 January, temperature and relative humidity were not recorded and the monthly values (Table 1) were used.
Soil information
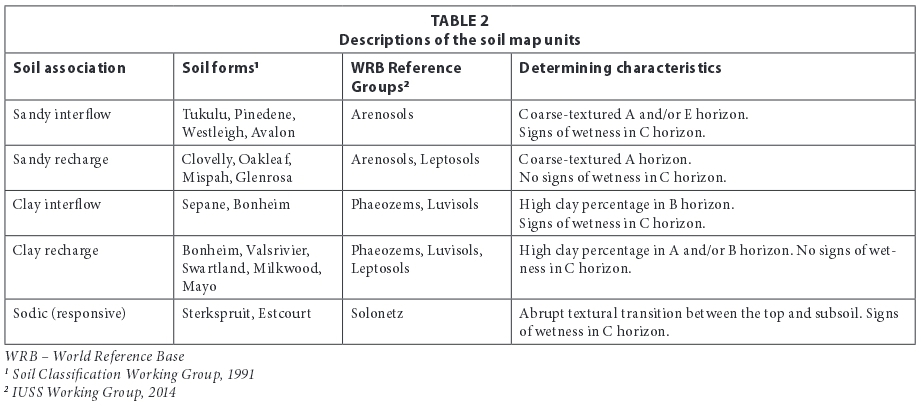
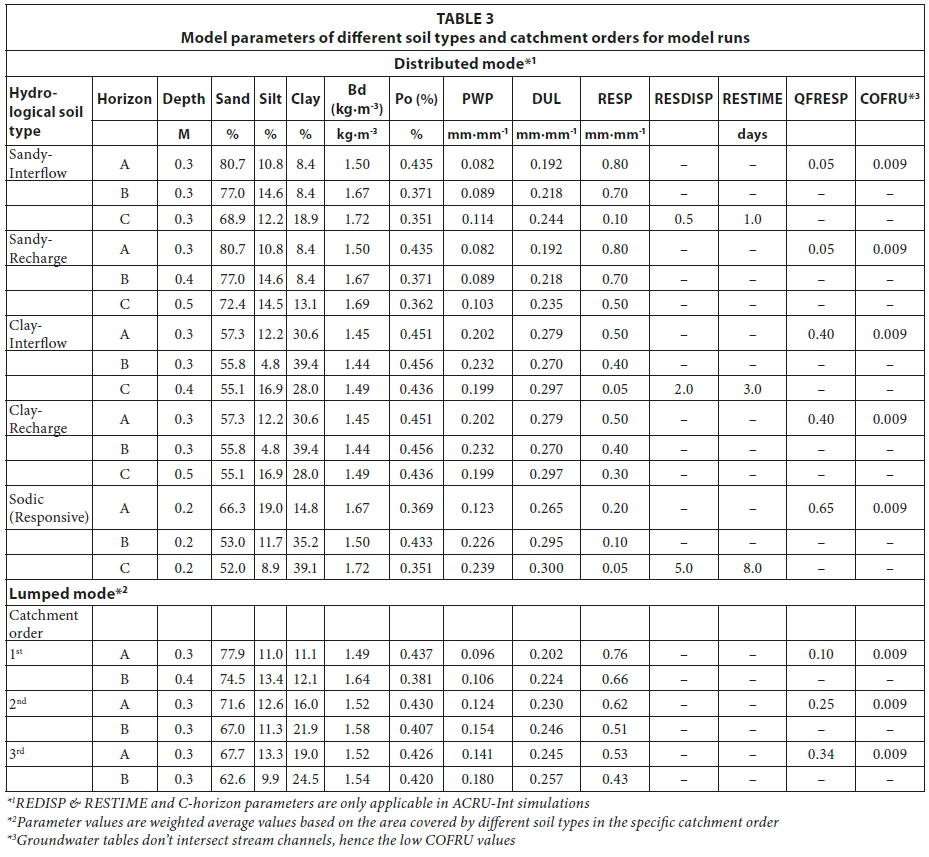
The hydropedological soil map of the study area is presented in Fig. 3 and descriptions of the soil map units are given in Table 2. Important model parameters of the different soil types are presented in Table 3. Recharge soils are soils that do not show any morphological indications of saturation, i.e., grey matrix or mottle colours within the soil profile. In this study, there was a distinction made between fast and slow recharge based on the expected rate of infiltration and redistribution through the soil profile, as influenced by texture. Clayey soils of the Bonheim, Valsrivier and Milkwood forms will presumably have a lower infiltration rate (QFRESP = 0.4), and redistribute water slower (ABRESP = 0.5 and BFRESP = 0.4) than sandy Clovelly, Mispah and Glenrosa soils (QFRESP = 0.05; ABRESP = 0.8 and BFRESP = 0.7). Since morphological indications of saturation are absent from these soils, it would be logical to assume that lateral flow at the soil/bedrock interface is negligible and that most of the water will drain into deeper groundwater aquifers (high INTRESP values of 0.5 and 0.3 for sandy and clayey recharge soils, respectively). Lateral distributions from these soils to lower lying land segments were therefore ignored in the model setup.
Similarly to the recharge soils, a distinction was also made between 2 types of interflow soil, i.e., sandy and clayey. In the interflow soils soil morphological indicators of saturation were observed at the soil/bedrock interface implying that saturation and lateral flow might occur in these soils. The redistribution rate from the surface to soil/bedrock interface, i.e., ABRESP and BFRESP, were the same as for sandy and clayey recharge soils; however, low INTRESP values (0.1 and 0.05 for sandy and clayey soils, respectively) should allow for the formation of temporal saturation as indicated by the soil morphology. The clayey interflow soils of the Sepane and Bonheim soil form will typically have a slower lateral redistribution rate (RESDISP = 2 and RESTIME = 3) than the sandy Pinedene, Avalon and Tukulu soil forms (RESDISP = 0.5 and RESTIME = 1).
Sodic soils are prone to crust formation due to dispersion caused by high Na contents. Low infiltration rates are typically associated with these soils, and it is expected that infiltration excess overland flow will be the hydrological process dominating on these soils (QFRESP = 0.65). Redistribution of water within the sodic soils is limited (ABRESP and BFRESP of 0.2 and 0.1, respectively), with limited drainage towards ground-water aquifers (INTRESP = 0.05). Lateral drainage in the saprolitic layer of the sodic soils is also expected to be very slow (RESDISP = 5 and RESTIME = 8).
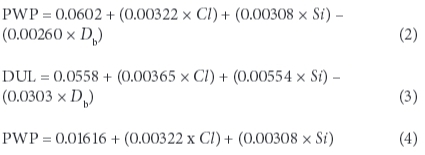
Permanent wilting points (PWP) and drained upper limits (DUL) for the soils were derived using a pedotransfer function developed by Hutson (1984). PWP is calculated by Eq. 2 for stable (i.e. not physically active) soils and by Eq. 4 for clayey soils; where Cl is clay (%) Si is silt (%) and Dbis the bull density (Mg.m-3):
Hillslopes and hillslope responses
From the hydrological soil map (Fig. 3), 6 dominant hillslopes with different soil distribution patterns and flow paths were identified (marked hillslope 1-6). These hillslopes represent 3-dimensional landscape elements and were the basis for the configuration for surface routing in ACRU2000 and ACRU-Int as well as subsurface routing in ACRU-Int simulations. The dominant hydrological flowpaths in the hillslopes are conceptually presented in Fig. 4.
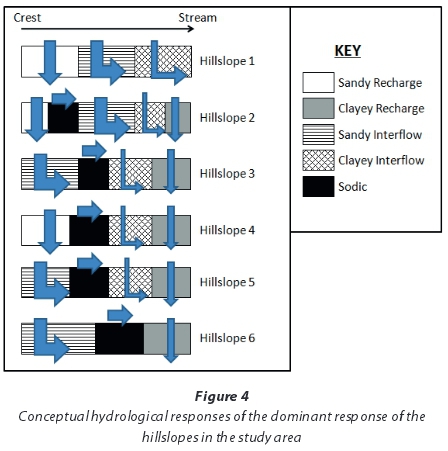
The conceptual flowpaths presented in Fig. 4 were used to structure the surface and subsurface (ACRU-Int only) flow from different land segments (Fig. 5). Before the start of the simulations it was known that groundwater tables only intersect stream channels of higher-order streams (5th and 6th order). The groundwater component was therefore routed in the detailed configuration (ACRU-Int) to a separate land segment which did not contribute to streamflow (GW in Fig. 5).
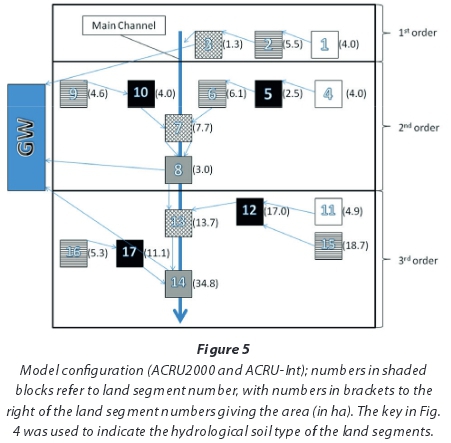
In distributed mode streamflow outputs from land segment 3, 8 and 14 represents streamflow from the 1st, 2nd, and 3rd order catchments, respectively. Land segments 3, 10 and 14 represents profiles SGR1_R, SGR2_R and SGR3_R, respectively.
RESULTS AND DISCUSSION
Simulated streamflow
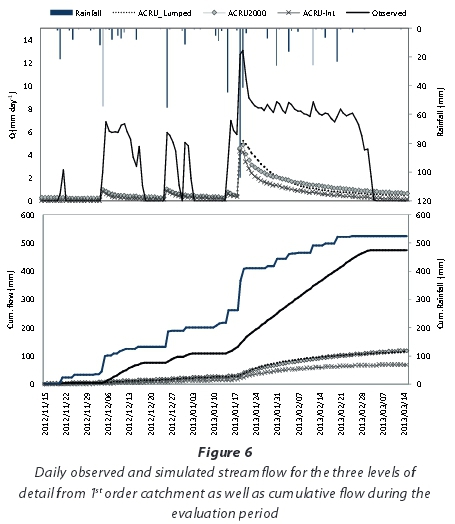
The efficiency of different simulations is presented in Table 4 and graphically in Figs 6 to 9. With the exception of the 1st order catchment, more detailed soil information improved the accuracy of simulations. In the 1st order catchment, all the levels of detail yielded poor results with negative Nash-Sutcliffe efficiency coefficients, implying that the observed mean value will be a better estimation of streamflow than what the model predicted. Figure 6 illustrates the reason behind the poor simulations. The 1st order stream is sustained by a seasonal contribution from a small narrow unchannelled valley bottom wetland, yielding higher streamflows than predicted. Figure 6 indicates that the discharge from this catchment is 4 times higher than simulated streamflow. This saturated area will also increase the amount of quick flow due to saturation excess overland flow as indicated by the underestimation of peak discharge throughout the evaluation period. In the soil map of Van Zijl and Le Roux (2014), this wetland was not recorded. It should however be noted that Van Zijl and Le Roux (2014) were tasked to map 4 001 ha and such a small wetland (< 1 ha) can easily be missed. It is clear that these areas can have a huge impact on the water regime of small catchments, and with large-scale (small-area) simulations more detail is required to ensure accuracy and efficiency of models.
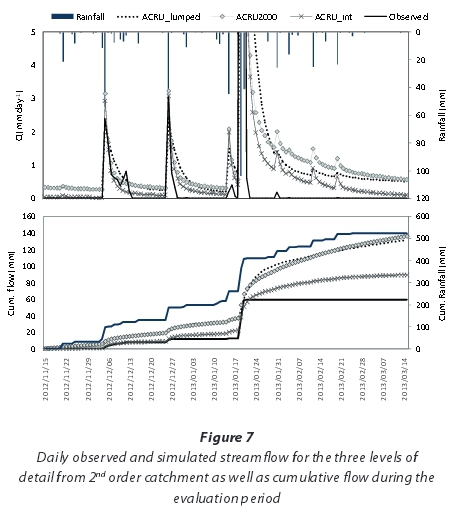
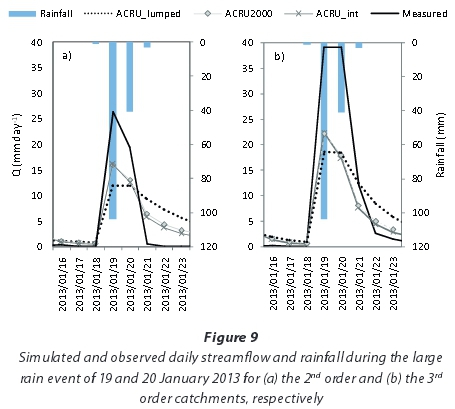
In the 2nd order catchment streamflow was simulated with reasonable accuracy (Table 3) especially during the 1st half of the evaluation period (Fig. 7). Until 17 January 2013 peak and low flows were slightly overestimated. Overestimation of low flows was especially made in ACRU2000 and ACRU_lumped simulations, even with very low COFRU values. The ability of ACRU-Int to divert the groundwater contribution from the stream seems to be effective. During the extreme rainfall event of 19 and 20 January 2013 (103.8 mm), peak flow was underestimated (Fig. 9). The overestimation of peak discharge during smaller rain events and underestimation during large rain events is noteworthy. It will imply that the parameter mainly responsible for quickflow (i.e. QFRESP) should be dynamic in nature, a notion also supported by Van Tol et al. (2011). Towardsthe end of the evaluation period observed streamflow showed little response to any rain received (Fig. 7). This lack of response seems spurious and it is hypothesized that the equipment might have been damaged during the extreme rain event of 19 and 20 January. Should this be the case, efficiency parameters in Table 3 will improve significantly. From the start of evaluation until 18 January 2014 the RMSE in simulations for the 2nd order were 0.04, 0.07 and 0.09 for ACRU-Int, ACRU2000 and ACRU_lumped, respectively.
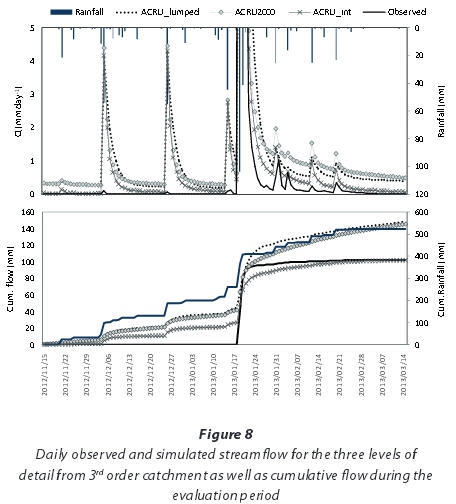
In the 3rd order catchment streamflow was overestimated during the 1st half of the simulation period (Fig. 8). After the high rainfall events of 19 and 20 January 2013 streamflow was maintained until the beginning of March 2013. During this periodthestreamresponded to relatively small rain events, suggesting that the soils surrounding the stream were near to or at drained upper limit (DUL), and additional precipitation was discharged to the stream. The stream channel consists of coarse sandy alluvial material and although the stream is flowing through the alluvial layer, surface flows are only observed during and after high rainfall events. Peak flow was again underestimated during the extreme rain event of 19 and 20 January 2013 (Fig. 9). The ACRU-Int model configuration yielded the most accurate streamflow simulations (Table 3), followed by ACRU2000. The cumulative observed flow during the evaluation period was 101.9 mm and that simulated by ACRU-Int was 102.3 mm. Although daily flows were not simulated with the same accuracy the outputs were still better than those for simulations with less soil information.
Simulated soil water contents
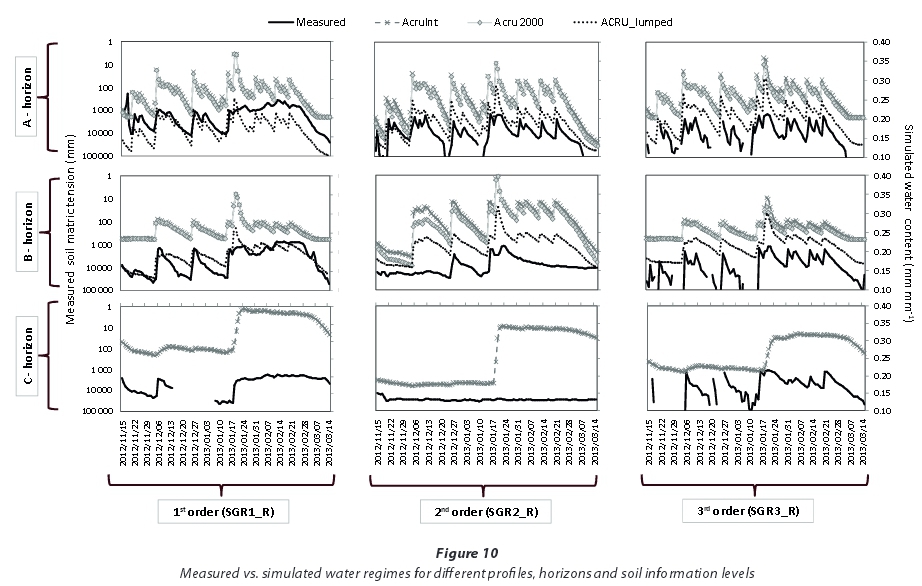
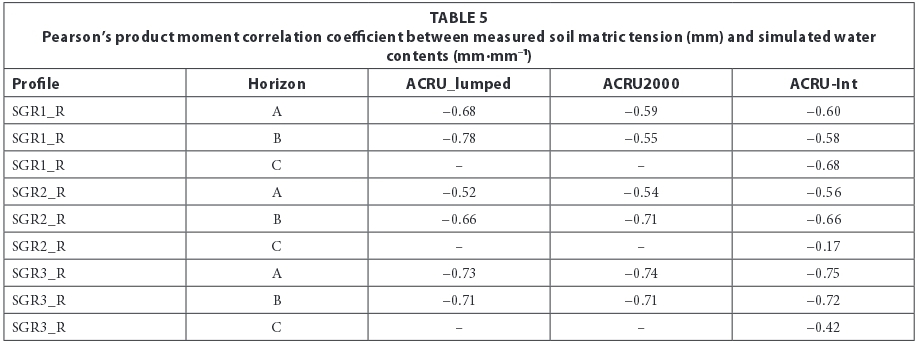
Figure 10 shows how the soil water status measurements and simulations reacted to rain events. Direct comparisons between simulated and measured data were not possible at this stage as the measured soil matric tensions were not yet calibrated against volumetric water content (mm.mm-1). Because these two variables are strictly related by the soil water retention function a number of noteworthy deductions can however be made from Fig. 10. In general, the efficiency of the simulations improved with increased catchment area/order. Simulations show the same reactions to rainfall events as the measured data. The Pearson correlation values confirm this (Table 5), with inverse correlation values below -0.5 for all soil horizons except the intermediate (C) horizons. The intermediate soil horizons were simulated erratically. On SGR1_R the simulation achieved the highest overall correlation, while the simulations of the other two intermediate horizons achieved the lowest correlations. Simulated water contents only showed a significant response to the high rainfall received on 19 January 2013. For SGR1_R and SGR3_R represented by clay-interflow and clay-recharge hydrological soil types, respectively (Table 2), it is clear that more should be allowed to drain to the C horizon, i.e., BFRESP is too low or INTRESP is too high. For the 2nd order catchment (SGR2_R; represented by the sodic (responsive) land segment in Table 2), the lack of simulated response is in accordance with the constant observed tensions. This confirms that infiltration and redistribution of water in these profiles is limited. The latter is also supported by the limited variation in observed tensions in the B horizon of SGR2_R, when compared to B horizons of the other two profiles.
The close association between simulated water contents of ACRU2000 and ACRU-Int exists because their A and B horizons were parameterised identically (Table 2). Figure 10 shows that the simulated water contents of the A-horizon of the ACRU_lumped simulation was lower than for the ACRU-Int and ACRU2000 simulations in the SGR1_R, most likely due to higher QFRESP values (0.10) in ACRU_lumped compared to 0.05 in ACRU-Int and ACRU2000 assigned to the land segment representing SGR1_R . The higher QFRESP will result in more overland flow (peak discharge) and less infiltration in the ACRU_lumped simulation SGR1_R. These same reasons can be attributed to the lower water contents simulated with ACRU_lumped in the 3rd order catchment, i.e., SGR3_R. In the 2nd order catchment represented by a sodic soil profile, simulated water contents of both the A and B horizons in the ACRU_lumped simulation were higher than that of ACRU-Int and ACRU2000. The influence of QFRESP values can again be attributed to the simulated differences. High QFRESP values for the distributed simulations (0.65) will result in the generation of overland flow and less infiltration than simulated in the lumped run with lower (0.25) values.
CONCLUSIONS
This paper illustrated how soil information in the form of a soil map constructed through digital soil mapping techniques can be utilised to configure a distributed model in the Stevenson-Hamilton Research Supersite (SHRS). We maintain that improved soil information can facilitate a more realistic representation of the landscape and landscape hydrological processes. The application of soil information, especially in ungauged catchments, can reduce uncertainty with regards to hydrological simulations.
In the SHRS the indications are that the simulations are increasingly correct when applied at smaller scales. The correlation coefficients and Nash-Sutcliffe values generally increased for ACRU-Int, ACRU2000 and ACRU_Lumped simulations from the 1st order to the 3rd order. Thus the optimal scale for the detailed soil information hydrological modelling is still unknown and is likely to differ based on the heterogeneity of the landscape. In the 1st order catchment, a small wetland had a large impact on measured streamflow values. This wetland was unaccounted for in the soil survey. The impact of such unaccounted for areas decreases as the catchment area increases. However, with a increase in catchment area other factors, such as climate, distance from and length of the stream channel, which operate over larger areas, overwhelm the effect of the soil and soil distribution patterns.
In this study it was shown that improved soil information does improve the ability of ACRU to simulate stream-flow in the SHRS. For the streamflow simulations ACRU-Int and ACRU2000 generally outperformed the ACRU_lumped simulations. The ability of ACRU-Int to simulate an intermediate horizon between the soil and the groundwater was also shown to improve the model's accuracy. In terms of water content simulations, direct comparisons between simulated and measured values were not possible. With the exception of the intermediate horizon, changes in simulated water contents compared reasonably well with measured soil matric tensions (Pearson correlations > -0.5). Interpretation of measured soil matric tensions in conjunction with other measurements (rainfall, conductivities, infiltration rates, etc.) to understand the hydrological functioning of soils and hillslopes in the study area should be a theme for future research.
ACKNOWLEDGEMENTS
The authors would like to thank the Water Research Commission for funding this study, Prof Robert Schall from the University of the Free State, who aided with the statistical analysis, and Ashton van Niekerk and Faith Jumbi who collected hydrological data. The valuable contributions from two anonymous reviewers are also highly appreciated.
REFERENCES
HUTSON JL (1984) Estimating hydrological properties of South African soils. PhD thesis, University of Natal, Pietermaritzburg. [ Links ]
IUSS WORKING GROUP (2014) World Reference Base for Soil Resources 2014 (WRB 2014). International soil classification system for naming soils and creating legends for soil maps. World Soil Resources Reports No. 106. FAO, Rome. [ Links ]
JENNY H (1941) Factors of Soil Formation, a System of Quantitative Pedology. McGraw-Hill, New York. [ Links ]
LILLY A, BOORMAN DB and HOLLIS JM (1998) The development of a hydrological classification of UK soils and the inherent scale changes. Nutr. Cycl. Agroecosyst. 50 299-302. [ Links ]
LIN HS, KOGELMAN W, WALKER C and BRUNS MA (2006) Soil moisture patterns in a forested catchment: A hydropedological perspective. Geoderma 131 345-368. [ Links ]
LORENTZ SA, BURSEY K, IDOWU O, PRETORIUS C and NGELEKA K (2007) Definition and upscaling of key hydrological processes for application in models. WRC Report No. K5/1320. Water Research Commission, Pretoria. [ Links ]
PARK SJ, MCSWEENEY K and LOWERY B (2001) Identification of the spatial distribution of soils using a process-based terrain characterization. Geoderma 103 249-272. [ Links ]
SCHULZE RE (1995) Hydrology and agrohydrology: A text to accompany the ACRU 3.00 agrohydrological modelling system. WRC Report No 63/2/84. Water Research Commission, Pretoria. [ Links ]
SCHULZE RE and CHAPMAN RD (2007) Estimation of daily solar radiation over South Africa. In: Schulze RE (ed) South African Atlas of Climatology and Agrohydrology. WRC Report No. 1489/1/06, Section 5.2. Water Research Commission, Pretoria. [ Links ]
SCHULZE RE and MAHARAJ M (2007) Temperature database. In: Schulze RE (ed) South African Atlas of Climatology and Agrohydrology. WRC Report No. 1489/1/06, Section 2.1. Water Research Commission, Pretoria. [ Links ]
SCHULZE RE (2007) Soils: Agrohydrological information needs, information sources and decision support. In: Schulze RE (ed). South African Atlas of Climatology and Agrohydrology. WRC Report No. 1489/1/06. Water Research Commission, Pretoria. [ Links ]
SIVAPALAN M (2003) Prediction in ungauged basins: a grand challenge for theoretical hydrology. Hydrol. Process. 17 3163-3170. [ Links ]
SMIT IPJ, RIDDELL ES, CULLUM C and PETERSEN R (2013) Kruger National Park research supersites: Establishing long-term research sites for cross-disciplinary, multiscaled learning. Koedoe 55 (1) Art. #1107, 7 pages. DOI: http://dx.doi.org/10.4102/koedoe.v55i1.1107. [ Links ]
SMITHERS J and SCHULZE RE (2004) ACRU Agrohydrological modelling system: user manual v4.00. School of Bioresources Engineering and Environmental Hydrology, University of Natal, Pietermaritzburg. [ Links ]
SOULSBY C and TETZLAFF D (2008) Towards simple approaches for mean residence time estimation in ungauged basins using tracers and soil distributions. J. Hydrol. 363 60-74. [ Links ]
TERRIBILE F, COPPOLA A, LANGELLA G, MARTINA M, and BASILE A (2011) Potential and limitations of using soil mapping information to understand landscape hydrology. Hydrol. Earth Syst. Sci. 15 3895-3933. [ Links ]
TICEHURST JL, CRESSWELL HP, McKENZIE NJ and CLOVER MR (2007) Interpreting soil and topographic properties to conceptualise hillslope hydrology. Geoderma 137 279-292. [ Links ]
TROMP-VAN MEERVELD I and WELIER M (2008) Hillslope dynamics modelled with increasing complexity. J. Hydrol. 361 24-40. [ Links ]
VAN TOL JJ, LE ROUX PAL, HENSLEY M and LORENTZ SA (2010) Soil as indicator of hillslope hydrological behaviour in the Weatherley Catchment, Eastern Cape, South Africa. Water SA 36 513-520. [ Links ]
VAN TOL JJ, LE ROUX PAL and HENSLEY M (2011) Soil indicators of hillslope hydrology. In: Gungor BO (ed) Principles-Application and Assessments in Soil Science. Intech, Turkey. [ Links ]
VAN TOL JJ, LE ROUX, PAL, LORENTZ SA and HENSLEY M (2013) Hydropedological classification of South African hillslopes. Vadose Zone J. 12 (4) DOI:10.2136/vzj2013.01.0007. [ Links ]
VAN ZIJL GM, and LE ROUX PAL (2014) Creating a conceptual hydrological soil response map for the Stevenson Hamilton Research Supersite, Kruger National Park. Water SA 40 331-336. [ Links ]
VENTER FJ (1990) A classification of land management planning in the Kruger National Park. PhD thesis, Department of Geography, University of South Africa. [ Links ]
Received 26 June 2014
Accepted in revised from 10 June 2015
* To whom all correspondence should be addressed.

