


Services on Demand
Article
 English (pdf)
 Article in xml format
 Article references
Indicators

Related links
-
 Cited by Google
 -
 Similars in Google
Share

 Permalink
Water SA
On-line version ISSN 1816-7950
Print version ISSN 0378-4738
Water SA vol.41 n.4 Pretoria Jul. 2015
http://dx.doi.org/10.4314/WSA.V41I4.18
ARTICLES
A demand-based management option to address boat congestion at the Sundays River Estuary, Eastern Cape, South Africa
Deborah E Lee*; Mario Du Preez
Department of Economics, PO Box 77000, Nelson Mandela Metropolitan University, Port Elizabeth, 6031, South Africa
ABSTRACT
The Sundays River Estuary situated in the Eastern Cape is an example of a South African Estuary experiencing congestion externalities, mainly vis-à-vis motorised boat use. This paper employs a choice model to estimate people's preferences for less boat congestion on the Sundays River Estuary. The results show that visitors to the estuary are willing to trade off a levy of ZAR 35/a (in addition to what they already pay) for a reduction of boat congestion during peak periods (only). This paper proposes that this amount be set as a user charge to manage excess recreational boat use.
Keywords: estuary, choice experiment, implicit prices, conditional logit, random parameter logit
INTRODUCTION
Not unlike many other South African estuaries, the Sundays River Estuary is subject to overcrowding as far as recreational boat use is concerned (Cowley et al., 2009; Lee et al., 2015). This type of overcrowding is a recreational demand-side issue, which requires a demand-side analysis in order to achieve optimal use of the resource. Various stakeholders have called for intervention to address this issue through the regulation of access (Grossman et al., 2006; Lee et al., 2015). These regulations may take the form of zoning regulations, spacing standards, or direct and indirect rationing mechanisms (Sowman and Fuggle, 1987; Grossman et al., 2006). Direct rationing entails the application of a quota system whereas indirect rationing entails the implementation of a user fee (Lee et al., 2015). Lee et al. (2015) have shown, in the case of the Kromme River Estuary located in the Eastern Cape (EC), that the use of a price rationing mechanism, such as an indirect user fee, could have the potential to address congestion by reducing motorised boat use to an optimal level. The user fee (levied over and above what users currently pay) was estimated through the use of a stated preference technique, namely the choice experiment (CE) method (Lee et al., 2015).
The aim of this paper is to derive an indirect user fee, which is to be levied during peak periods only, in an attempt to reduce the congestion externalities currently experienced at the Sundays River Estuary. To this end, the paper will employ the same methodology to the one used by Lee et al. (2015), namely, a discrete choice model. The latter estimates the economic value that estuary users, such as boaters, attach to selected estuarine attributes, including motorised boat congestion.
BACKGROUND TO THE STUDY
The Sundays River Estuary
The Sundays River Estuary (33°43'S, 25°25'E) is situated in the EC, approximately 40 km northeast of Port Elizabeth. The estuary is approximately 24 km long, is permanently open and discharges into Algoa Bay, in the Indian Ocean (MacKay and Schumann, 1990). The Sundays River has a catchment area of approximately 22 000 km2. It lies in a semi-arid region and has no tributaries (Scharler and Baird, 2003). The mean annual runoff (MAR) is approximately 186 x 106 m3. The two dams constructed in the catchment area have a combined storage of about 140% of the MAR (Reddering and Esterhuysen, 1981). A significant part of the freshwater inflow for the Sundays River comes from one of the largest rivers in South Africa, the Orange River. This occurs via an inter-basin water transfer scheme which provides water for irrigation purposes for the extensive citrus farming community in the Sundays River catchment area. This inter-basin water transfer scheme provides the Sundays River Estuary with a regular inflow of freshwater (Emmerson, 1989). The estuary's average depth and width, respectively, are 2 m and 75 m. The overall surface area covers approximately 156 ha (Scharler and Baird, 2003).
Three main species of fish are targeted in the Sundays River Estuary: the spotted grunter (Pomadasys commerson-nii), the dusky kob (Argyrosomus japonicas), and the white steenbras (Lithognathus lithognathus). The populations of these species have declined radically during the last decade due to the popularity of the Sundays River Estuary for recreational fishing (Cowley et al., 2009). An abundance of bird species also makes the Sundays River Estuary a popular location for bird watching.
The congestion issue described
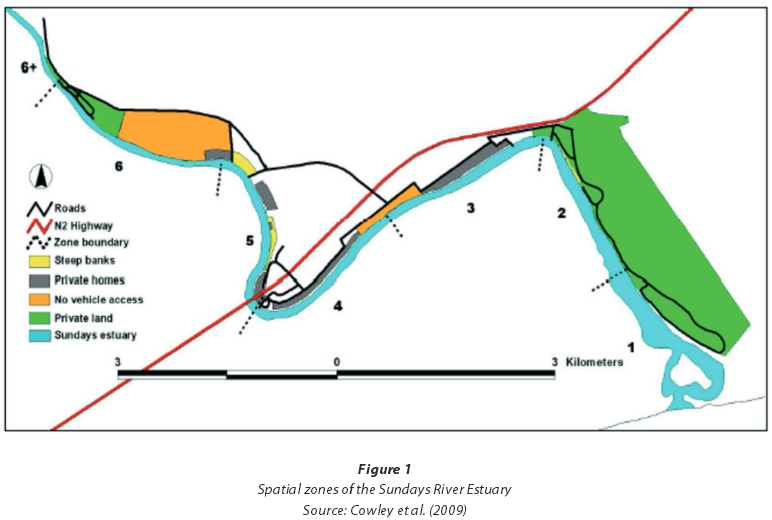
A study by Lee (2012) found that the main recreational activities for the Sundays River Estuary were: recreational shore fishing (41%), recreational boat fishing (41%), speed boating (11%), water skiing (1%), paddling (2%), jet skiing (1%), swimming (1%) and bird watching (1%). By way of comparison, the main estuary activities observed in a study conducted by Cowley et al. (2009) were recreational shore fishing (32%), recreational boat fishing (18%), speed boating (11%), water skiing (3%), paddling (2%), and jet skiing (1%). The Cowley et al. (2009) study divided the recreational boating area of the Sundays River Estuary into 6 zones (see Fig. 1).
These zones stretch for 12 km, starting at the mouth of the estuary and ending approximately 4.5 km beyond the N2 Bridge. Various recreational activities take place on this stretch of water, but some are focused within specific zones. Both Cowley et al. (2009) and Lee (2012) indicated that fishing and non-fishing motorised boating activities constitute a large part of all activities that occur in the Sundays River Estuary. The number of boats registered to use the Pearson Park Resort slipway (a private launching facility) for the years 2007 and 2008, respectively, were 774 and 812. These numbers exclude the boats that made use of the public launching facilities under the new Mackay Bridge (between Zones 4 and 5) - these figures are not available as no records are kept.
Recreational boat fishing is not confined to any particular part of the estuary, but is spread throughout. Boats in this case include motorised boats, canoes and kayaks. This type of fishing mostly takes place between 2 and 4 km from the estuary mouth. Motorised boating activities, excluding fishing, but including family outings, 'booze' cruises, leisure cruises and ferry trips, take place all along the estuary. The incidence of motorised boating activity is higher within 2 km on either side of each of the two main slipways (Cowley et al., 2009). Motorised boating activity related to water skiing, is mainly confined to the area between the two slipways. Non-ski motorised boating activity takes place anywhere in the estuary because no boundaries exist and there are no access restrictions limiting the movements of boats (Cowley et al., 2009). General motorised boating activity (excluding fishing) peaks during the summer months. Cowley et al. (2009) found that a maximum of about 40 boats use the estuary at any one time (survey conducted between September 2007 and August 2008 - excluding jet skis and wet bikes). The summer peak is from October to January. The development of space standards for recreational water activities has been advocated by Sowman and Fuggle (1987). Their space standards are displayed in Table 1.
If one takes the length of the Cowley et al. (2009) study area (12 km) and an average estuary width (between 50 m and 100 m with an average of 75 m), approximately 90 ha are available for recreational activities. Based on the abovementioned space standards and the total number of hectares available, it is possible to determine the extent of the boat congestion in the Sundays River Estuary. According to the space standards defined above, the maximum number of motorised recreational angling boats using the Sundays River Estuary at any one time should not exceed 23, i.e., 90 x 0.25. There should also be no more than 75 leisure cruises taking place at any one time, i.e., 90 x 0.83, or 9 water skiers or speed boaters on the water, i.e., 90 x 0.095, and 9 jet skiers or wet bikers at any one time, i.e., 90 x 0.095. This standard assumes only one of these recreational activities is taking place at a time. The policy challenge at the Sundays River Estuary is to determine a simultaneous capacity limit covering all these activities. When this determination is done by weighting each of these boating activities proportionally, the capacity limit at any one time for the whole Sundays River Estuary is 55 boats. More specifically, total motorised craft per hectare equals 1.27, of which boat angling, leisure cruising, water skiing/speed boating and jet skiing represent 20%, 65%, 7.5% and 7.5%, respectively. This implies 4.6 angling boats, 48.75 leisure boats, 0.675 water skiers or speed boaters and 0.675 jet skiers can make use of the estuary at one point in time. This represents a capacity limit for the Sundays River Estuary of 55 motorised crafts at one point in time (Lee, 2012).
Within any given zone, the capacity limit is less. Recreational boat angling, for example, is focused mainly in Zone 2; 2 to 4 km from the mouth of the estuary (Cowley et al., 2009). Within this zone of approximately 15 ha, only 4 fishing boats should ideally be active, or less than that, if other activities also take place in this area. By similar calculations, within the area of about 2 km on either side of each of the 2 main slipways (approximately 60 ha), no more than 50 leisure boats should be active at one time. Water skiing in the estuary is confined to Zones 3 and 4 (the area situated between the two main slipways at Pearson Park Caravan Park and at the N2 New Mackay Bridge). This stretch has a surface area of approximately 22.5 ha. In terms of the space standards formula of Sowman and Fuggle (1987) and the available surface area, no more than 2 crafts should be active. The same space standard applies to jet skis and wet bikes.
Similar international and local studies conducted
CE studies have been applied in many different countries to value wetland, estuary and river attributes as a means of investigating the optimality of various management options, including Vietnam (Nam Do and Bennett, 2007), Greece (Birol et al., 2006), England and Wales (EFTEC, 2002; Luisetti et al., 2008), Australia and Tasmania (Banzhaf et al., 2001; Kragt and Bennett, 2009), the Carribean (Beharry-Borg and Scarpa, 2010), and the United States of America and Canada (Heberling et al., 2000; Huang et al., 2007; Smyth et al., 2009).
The issue of congestion, in particular, has been addressed in the literature but largely through the application of contingent valuations and other revealed preference techniques. Some of the earliest studies on measuring congestion through estimating willingness-to-pay (WTP) included Anderson and Bonsor (1974), and Cicchetti and Smith (1976). More recently, a study by Banzhaf et al. (2001) applied a CE to the issue of boating congestion. The Banzhaf et al. (2001) study assigned 2 levels to the congestion attribute, namely 'Many people or boats in sight' and 'Some people or boats in sight'. Although the study found that the level of congestion is a highly significant determinant of angler choice, large variations in preferences across respondents were found (Banzhaf et al., 2001). Unfortunately, the Banzhaf et al. (2001) study did not estimate an implicit price for the congestion attribute.
In South Africa, there have only been a few studies reported that make use of the CE technique to value environmental attributes. Most notably, it was applied in order to value improvements in freshwater inflows into the Kruger National Park catchment areas (Turpie and Joubert, 2004) and the Bushmans River Estuary (Oliver, 2010). Of the South African studies, however, only one has been conducted in which boat congestion was included as an attribute, namely that by Lee et al. (2015). The study found that users of the Kromme River Estuary, EC, were willing to pay an extra user fee of ZAR 548 per year during peak periods (only) in order to experience a decrease in boat congestion (Lee et al., 2015). As a result, it was proposed that a user charge be instituted in order to manage the congestion issue (Lee et al., 2015).
THE CHOICE EXPERIMENT METHODOLOGY
Attribute selection
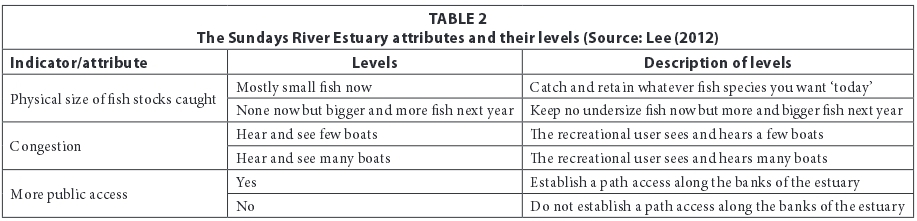
As the execution of this CE was guided by the need for the identification of adequate demand-side polices, consultation regarding attribute selection was mainly focused on those individuals, stakeholders and organisations responsible for policy-making. In order to facilitate attribute selection, interviews were conducted with estuarine experts (affiliated to various universities), the Chairman of the Sundays River Joint River Forum, as well as members of the Sundays River Ratepayers' Association. They were asked to list their concerns regarding the recreational use of the estuary, and to rank them in order of importance. Based on these consultations, 4 attributes were identified for inclusion in the CE - 3 qualitative attributes, with 2 levels each, relating to the effects of different management options in relation to the quality of estuarine services and the estuarine environment, and 1 quantitative attribute which specified the cost of the option. The payment vehicle selected was an annual environmental charge, levied on those who already had a boat licence. This was found to be the most understandable and least controversial option out of those discussed in the focus groups (Lee, 2012). The attributes of the Sundays River Estuary CE are presented in Table 2.
Each of the 3 attributes presented in Table 2 assumed 2 different levels. The cost variable was expressed by 4 different South African Rand values in the CE, namely ZAR 0 (the current status), ZAR 45, ZAR 90 and ZAR 120.
Experimental and survey design
Questionnaire development for the Sundays River Estuary took place over the 4-month period from March 2010 to July 2010. The process of questionnaire development included expert interviews, and the implementation of focus groups and pilot studies. The survey instrument comprised 4 sections: (i) an introductory section to collect introductory information from the respondent, (ii) the CE choice cards section, (iii) a follow-up question section, which allowed for reliability and validity checks, and (iv) a socio-demographic information section. One of the key elements in designing a survey instrument is to keep the format and language simple and consistent across all sections. The Dillman et al. (2009) publication was specifically consulted in order to ensure the development of a clear, concise and consistently written questionnaire. Different word choices were pre-tested in order to evaluate the ease of understanding of the various wording combinations for respondents. This pre-testing is essential in a context where there might be cultural and language differences between researchers and the study participants (Mangham et al., 2009). The questionnaire was also presented to the respondents in the pilot study to determine whether there was any 'respondent fatigue'. During the pilot study a significant problem was identified - a lack of understanding of the way to answer the CE section of the questionnaire. The impression some respondents gained was that only one choice had to be made out of all four choice sets given. In order to correct this potential problem, prior to the main survey, an example choice set, with a hypothetical choice already made, was included in the questionnaire.
A full factorial experimental design, consisting of 32 different treatment combinations or alternatives, was generated for the Sundays River Estuary sample using the SPSS econometric software (Lee, 2012). Two alternatives per choice set were adopted, which were randomly allocated to 32 different questionnaires. Four choice sets were assigned to each questionnaire.
Sampling procedure
The population of interest with respect to the Sundays River Estuary was all users and potential users (current non-users) of the recreational services provided by the estuary. This population included all individuals who, at the time of the survey, made use of the estuary for recreational purposes, as well as those individuals who had high potential to make use of the estuary for recreational purposes in the future. It was not feasible to survey the entire target population for the estuary (Lee, 2012).
Since the recreational user population of the estuary does not reveal itself until it visits the estuary, an adequate sample frame could not be assembled (Lee, 2012). An intercept survey, or on-site sampling, was used, and recreational users visiting the estuary during the interview process were selected based on underlying knowledge of the specific target population. The latter was mainly gleaned from the Cowley et al. (2009) study. It has been shown that this type of non-list sampling is sufficient when the target population of interest relates to visitors to a beach, lake, wetland or estuary (Bateman et al., 2002; Dillmanet al., 2009).
The Sundays River Estuary questionnaire was administered on-site by 4 trained interviewers during August, 2010. A face-to-face interview technique was adopted. Interviewers followed the intercept sample method whereby they approached every nth potential respondent and asked them if they would be willing to spend approximately 15 min filling in the questionnaire (Lee, 2012). In total, 175 completed questionnaires were collected.
Socio-economic characteristics of the sample
The only other socio-economic information available on the recreational users of the Sundays River Estuary was that gathered in the Forbes (1998) and, more recently, Cowley et al. (2009) studies. The Forbes (1998) study captured data on the recreational users of the estuary, while the Cowley et al. (2009) study captured data on both recreational and subsistence users of the estuary. Comparisons with the Cowley et al. (2009) study are possible for the following socio-economic characteristics: residential location, age, gender and education. The Forbes (1998) study allows comparisons for residential location only.
Not unlike the sample of respondents interviewed as part of the Forbes (1998) and Cowley et al. (2009) studies, most of the visitors (i.e. 91%) surveyed came from areas less than 50 km away from the estuary. The majority (55%) of recreational users surveyed were over the age of 35, whereas the majority (about 65%) of recreational users surveyed in the Cowley et al. (2009) study were over the age of 31. The majority (84%) of recreational users surveyed in this study were male, whereas about 92% were male in the Cowley et al. (2009) study. Of the respondents sampled, 35% had a matric qualification with university exemption, whereas only 27.5% of respondents in the Cowley et al. (2009) study had achieved a matric certificate.
Model form
The data was analysed using both a conditional logit (CL) and a mixed multinomial logit (random parameters logit (RPL)) model. The conditional logit model takes the following form (Louviere et al., 2000):
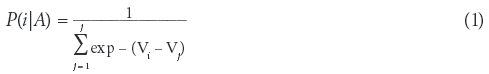
where: Pi is the probability of an individual choosing the ith over the jth alternative in the set of choices given A, Viis the representative utility derived from the ith alternative, and V is the representative utility from the jth alternative. The CL model is based on the following assumptions, namely, the scale parameters must have constant variance, the random components must be independent of irrelevant alternatives (IIA), and there can be no heterogeneity between individual preferences (Ben-Akiva and Lerman, 1985; Louviere et al., 2000). A more flexible model that relaxes the IIA assumption is the RPL model, which allows the variance of the error term to differ across alternatives within a choice set. The RPL also relaxes the assumption of homogeneity of preferences. A generalised version of the RPL choice model is given as:
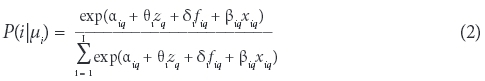
where: αJi, is a fixed or random alternative specific constant (ASC) with i = 1,....,I alternatives and q = 1,....,Q individuals;
α = 0,δj is a vector of non-random parameters, θi is a vector of individual-specific parameters βji is a parameter vector that is randomly distributed across individuals, μi is the individual-specific random disturbance of unobserved heterogeneity and is a component of the βji parameter vector, ziis a vector of individual-specific characteristics, for example, income, is a vector of individual-specific and alternative-specific non-randomised attributes, and xji is a vector of individual-specific and alternative-specific randomised attributes (Louviere et al., 2000).
Random parameters in the RPL can take on a number of different distributions, namely, normal, triangular, uniform and log-normal (Bhat, 2000; Bhat, 2001). The latter can be applied if the response parameter needs to be a specific sign, whereas a uniform distribution with a (0,1) bound is appropriate when dummy variables are used (Carlsson et al., 2003). In most cases, the non-cost variables are distributed and the cost coefficient is assumed to be constant, which allows the distributions of WTP to be easily calculated as the distribution of the marginal WTP for an attribute is simply the distribution of that attribute's parameter estimate (Scarpa et al., 2008).
RESULTS AND DISCUSSION Model estimation
Estimation results of two different choice model specifications, namely, a CL model and an RPL model, are presented in Table 3 below. The CL model only contains the variables representing the attributes of the estuary management alternatives and not the socio-economic characteristics of those that visit the Sundays River Estuary. The CL model thus represents the average preferences of the sample of respondents. The RPL model, however, is applied in this case in order to determine if respondents in the sample exhibit heterogeneous preferences with respect to the selected estuary characteristics. If heterogeneous preferences exist, then the sources of these preferences can be determined through the inclusion of interactions of respondent-specific social, economic, awareness and attitudi-nal characteristics with choice-specific attributes in the utility function. The inclusion of these interactions allows for the detection of preference variation in terms of both random heterogeneity and conditional heterogeneity (Hensher et al., 2005). The CL and RPL models were estimated using the LIMDEP NLOGIT Version 4.0 programme (Greene, 2007).

In the case of the CL model, all the coefficients were significantly different from zero at the 99% confidence level and had the correct signs, a priori. Respondents were more likely to choose an option if (i) there was an improvement in the physical size of fish stock, (ii) there was less motorised boat congestion, and (iii) there was an improvement in public access levels at the Sundays River Estuary through the introduction of a nature trail. With respect to the congestion variable in particular, the probability that an alternative would be chosen decreased the higher the amount of boat congestion. In terms of an odds ratio (calculated by taking the antilog of the relevant coefficient), an increase in boat congestion would result in a decrease in the probability of a respondent selecting this option by 2%. The overall fit, as measured by McFadden's R2, of the CL model was relatively high (values between 0.2 and 0.4 are considered extremely good fits for probabilistic discrete choice models). The explanatory power of the model, measured as 22%, was thus considered a good fit for this type of study (Louviere et al., 2000).
In the RPL model, a normal distribution was selected for all the random parameters, including 'Physical size of fish', 'Congestion' and 'Public access'. The 'Cost' variable was specified as fixed, which allowed the distribution of the marginal WTP for an attribute to assume the distribution of that attribute's coefficient. Comparing the results from the CL and RPL models revealed that the magnitudes, signs and statistical significance of the coefficients were very similar. Allowing preferences for recreational attributes to vary across respondents showed that there is very little unexplained heterogeneity in respondent preferences. All of the standard deviation coefficients were statistically insignificant, indicating statistically similar preferences for these attributes across respondents. The random variables specified in the RPL confirm preferences to (i) increase the physical size of fish stocks, (ii) reduce boat congestion on the estuary, and (iii) increase public access levels through an investment in the development of a public nature trail fronting the banks of the Sundays River Estuary.
Implicit price estimates
The calculation of the marginal rates of substitution between the attributes, using the coefficient for cost as the 'numeraire', provided estimates of implicit prices (Hanemann, 1984). The implicit prices for the congestion attribute were estimated using the Delta method (Wald procedure) in LIMDEP NLOGIT Version 4.0 (Greene, 2007). They amounted to negative values of ZAR 33 (6; 60) for the CL model and ZAR 35 (8; 62) for the RPL model. The difference in WTP between the two models was small. Overlapping 95% confidence intervals suggested that the CL and RPL models yielded statistically equivalent values. More specifically, the RPL model value indicated that the average boat user is willing to pay ZAR 35 per annum in order to reduce congestion on the Sundays River Estuary (2010 prices) during peak periods only.
In a study by Lee et al. (2015) it was argued that boat congestion at the Kromme River Estuary should be regulated by adjusting access cost (i.e. the pricing instrument) during peak periods to a level that regulates demand to the desired level. This type of pricing is deemed effective since it encourages visitors, via monetary incentives, to use the resource during off-peak periods, and it simultaneously ensures that those individuals who value the use of the resource the highest for motor-ised boating during peak periods are the ones that are actually willing to pay for it (Van Kooten and Bulte, 2000; Lee et al., 2015). Like the Lee et al. (2015) study, this paper investigated additional user fees as a way to regulate recreational boating demand on the Sundays River Estuary during peak periods. Consistent with previous studies, including the Lee et al. (2015) one, the results indicated that estuary users are willing to pay for fewer congestion externalities.
CONCLUSION
The aim of this paper was to derive an indirect user fee, which was to be levied during peak periods only, in an attempt to reduce the congestion externalities experienced at the Sundays River Estuary. In addition to the existing boat licence fee, a supplementary tariff was estimated for the Sundays River Estuary through the application of a CE. Congestion on the estuary occurs during the peak demand periods of the year; therefore this supplementary tariff needed to be worked into the cost structure for peak periods only. More specifically, this paper found that, in addition to the boat licence fee of ZAR 94 per annum, recreational users at the Sundays River Estuary in 2010 were willing to pay ZAR 35 per annum in additional user charges for a reduction in peak period boat congestion. This peak period covered the months from November to February.
As illustrated in the literature review, very few previous international studies have information on respondents' WTP for reduced negative crowding effects, and only one previous South African study contains this information - that for the Kromme River Estuary (Lee et al., 2015). This study found that the implicit price for reducing congestion on the Kromme River Estuary during peak periods (per boat user) was ZAR 304 (ZAR 145; ZAR 463) for the CL model, and ZAR 548 (ZAR 102; ZAR 994) for the RPL model (Lee et al., 2015). The implicit price for congestion, in the case of the CL model's coefficients, was approximately 10 times higher for the Kromme River Estuary users compared to that for the Sundays River Estuary users, and approximately 15 times higher in the case of the RPL model's coefficients. A possible explanation for the large discrepancy between the implicit prices for congestion for the Kromme and Sundays River Estuaries could be the income differences between the users of the estuaries - on average, sampled users at the Kromme River Estuary in 2010 had a gross income of ZAR 447 000 per annum, whereas those at the Sundays River Estuary in 2010 had an annual gross income of ZAR 184 000 (Lee, 2012; Lee et al., 2015).
Based on the results of this study, it is recommended that license fee adjustments be accepted as a potential pricing mechanism for managing demand at South Africa's estuaries. More specifically, in addition to the licence fee paid by boat users at the Sundays River Estuary, it is recommended that a further supplementary charge of ZAR 35 be added as a once-off payment for individuals making use of this estuary for motorised boating purposes during peak periods of the year.
ACKNOWLEDGEMENTS
The financial assistance and reference group inputs from the Water Research Commission (WRC Project K5/1924) are gratefully acknowledged.
REFERENCES
ANDERSON FJ and BONSOR NC (1974) Allocation, congestion, and the valuation of recreational resources. Land. Econ. 50 (1) 51-57. [ Links ]
BANZHAF MR, JOHNSON FR and MATHEWS KE (2001) Opt-out alternatives and anglers' stated preferences. In: Bennett J and Blamey RK (eds) The Choice Modelling Approach to Environmental Valuation. Edward Elgar Publishing, Cheltenham. 157-177. [ Links ]
BATEMAN IJ, CARSON RT, DAY B, HANEMANN M, HANLEY N, HETT T, JONES-LEE M, LOOMES G, MOURATO S, ÖZDEMIROGLU E, PEARCE DW, SUGDEN R and SWANSON J (2002) Economic Valuation with Stated Preference Techniques. A Manual. Edward Elgar Publishing, Cheltenham. [ Links ]
BEHARRY-BORG N and SCARPA R (2010) Valuing quality changes in Caribbean coastal waters for heterogeneous beach visitors. Ecol. Econ. 69 (5) 1124 - 1139. [ Links ]
BEN-AKIVA M and LERMAN S (1985) Discrete Choice Analysis: Theory and Application to Travel Demand. MIT Press, Cambridge. [ Links ]
BHAT CR (2000) Flexible model structures for discrete choice analysis. In: Hensher DA and Button KJ (eds) Handbook of Transport Modelling, Vol. 1: Handbooks in Transport. Pergamon Press, Oxford, 71-90. [ Links ]
BHAT CR (2001) Quasi-random maximum simulated likelihood estimation of the mixed multinomial logit model. Transp. Res. Board. 35 (7) 677-695. [ Links ]
BIROL E, KAROUSAKIS K and KOUNDOURI P (2006) Using a choice experiment to account for preference heterogeneity in wetland attributes: the case of Cheimaditida wetland in Greece. Ecol. Econ. 60 (1) 145-156. [ Links ]
CARLSSON F, FRYKBLOM P and LILJENSTOLPE C-J (2003) Valuing wetland attributes: an application of choice experiments. Ecol. Econ. 47 (1) 95-103. [ Links ]
CICCHETTI CJ and SMITH VK (1976) The Costs of Congestion: An Econometric Analysis of Wilderness Recreation. Ballinger, Cambridge. [ Links ]
COWLEY PD, CHILDS A-R and BENNETT RH (2009) A survey of fishery resource utilisation and recreational activities on the Sundays Estuary, with implications for management. World Wildlife Fund - South Africa Report. South African Institute for Aquatic Biodiversity, Grahamstown, South Africa. [ Links ]
DILLMAN DA, SMYTH JD and CHRISTIAN L-M (2009) Internet, Mail and Mixed-mode Surveys: The Tailored Design Method. Wiley and Sons, New Jersey. [ Links ]
EFTEC (ECONOMICS FOR THE ENVIRONMENT CONSULTANCY LTD) (2002) Valuation of benefits to England and Wales of a revised bathing water quality directive and other beach characteristics using the choice experiment methodology. Report to the Department for Environment, Food and Rural Affairs. EFTEC, London. [ Links ]
EMMERSON WD (1989) The nutrient status of the Sundays River Estuary, South Africa. Water Res. 23 (8) 1059-1067. [ Links ]
FORBES VR (1998) Recreational and resource utilisation of Eastern Cape estuaries and development towards a management strategy. MSc thesis, University of Port Elizabeth, Port Elizabeth. [ Links ]
GREENE WH (2007) NLOGIT: Version 4.0, User Manual. Econometric Software, Inc., New York. [ Links ]
GROSSMANN M, KLAPHAKE A and MEYERHOFF J (2006) Canoe trail congestion, quotas and user fees: Combining interview survey and visitor monitoring to inform paddling trail management in the Muritz National Park (Germany). Department of Environmental and Land Economics. Working Paper on Management in Environmental Planning, No. 017/2006. Technical University of Berlin, Germany. [ Links ]
HANEMANN WM (1984) Discrete/continuous models of consumer demand. Econometrica 52 (3) 541-561. [ Links ]
HEBERLING M, SHORTLE J and FISHER A (2000) The effect of the number of choice sets on responses in a stated choice survey. Paper presented at the American Agricultural Economics Association Annual Meeting, 30 July - 2 August 2000, Miami, Florida. [ Links ]
HENSHER D, ROSE JM and GREENE WH (2005) Applied Choice Analysis: A Primer. Cambridge University Press, Cambridge. [ Links ]
HUANG J, POOR PJ and ZHAO MQ (2007) Economic valuation of beach erosion control. Mar. Res. Econ. 22 (3) 221-238. [ Links ]
KRAGT ME and BENNETT JW (2009) Using choice experiments to value river and estuary health in Tasmania with individual preference heterogeneity. Environmental Economics Research Hub Research Report, No. 0916. Australian National University, Canberra. [ Links ]
LEE D (2012) An application of the choice experiment method to estimate willingness-to-pay for and guide management on estuarine recreational services. DComm thesis, Nelson Mandela Metropolitan University, Port Elizabeth. [ Links ]
LEE D, HOSKING SG and DU PREEZ M (2015) Managing some motorised recreational boating challenges in South African estuaries: a case study at the Kromme River Estuary. S. Afr. J. Econ. 83 (2) 286-302. [ Links ]
LOUVIERE JJ, HENSHER DA and SWAIT JD (2000) Stated Choice Methods: Analysis and Application. Cambridge University Press, Cambridge. [ Links ]
LUISETTI T, TURNER K and BATEMAN I (2008) An ecosystem services approach to assess managed realignment coastal policy in England. Working Paper ECM - 0804. CSERGE, London. [ Links ]
MACKAY HM and SCHUMANN EH (1990) Mixing and circulation in the Sundays River Estuary, South Africa. Est. Coast. Shelf Sci. 31 203-216. [ Links ]
MANGHAM LJ, HANSON K and MCPAKE B (2009) How to do (or not to do)... Designing a choice experiment for application in a low-income country. Health Polic. Plann. 24 (2) 151-158. [ Links ]
NAM DO NT and BENNETT J (2007) Estimating wetland biodiversity values: a choice modelling application in Vietnam's Mekong River delta. Economics and Environmental Network Working Paper No. EEN0704. The Australian National University, Canberra. [ Links ]
OLIVER C (2010) Comparing a contingent valuation of the river inflows into the bushman's river estuary with a choice experiment valuation. MSc dissertation, Nelson Mandela Metropolitan University, Port Elizabeth. [ Links ]
REDDERING JSV and ESTERHUYSEN K (1981) Sedimentation in the Sundays Estuary. ROSIE Report No. 3. University of Port Elizabeth, Port Elizabeth. [ Links ]
SCARPA R, THIENE M and TRAIN K (2008) Utility in willingness to pay space: a tool to address confounding random scale effects in destination choice to the Alps. Am. J. Agric. Econ. 90 (4) 994- 1010. [ Links ]
SCHARLER UM and BAIRD D (2003) The influence of catchment management on salinity, nutrient stoichiometry and phytoplank-ton biomass of Eastern Cape estuaries, South Africa. Est. Coast. Shelf. Sci. 56 (3-4) 735 - 748. [ Links ]
SMYTH RL, WATZIN MC and MANNING RE (2009) Investigating stakeholder preferences for managing Lake Champlain using a choice experiment. J. Environ. Manage. 90 (1) 615-623. [ Links ]
SOWMAN MR and FUGGLE RF (1987) Assessing recreational carrying capacity: A case study of the Kromme River Estuary, South Africa. J. Shoreline Manage. 3 (1) 53-75. [ Links ]
TURPIE JK and JOUBERT A (2004) Estimating potential impacts of a change in river quality on the tourism value of Kruger National Park: An application of travel cost, contingent and conjoint valuation methods. Water SA 27 (3) 387-398. [ Links ]
VAN KOOTEN GC and BULTE EH (2000) The Economics of Nature: Managing Biological Assets. Blackwell Publishers Ltd., Oxford. [ Links ]
Received 13 August 2014
Accepted in revised form 10 June 2015
* To whom all correspondence should be addressed. e-mail: deborah.lee@nmmu.ac.za

