


Services on Demand
Article
 English (pdf)
 Article in xml format
 Article references
Indicators

Related links
-
 Cited by Google
 -
 Similars in Google
Share

 Permalink
Water SA
On-line version ISSN 1816-7950
Print version ISSN 0378-4738
Water SA vol.41 n.4 Pretoria Jul. 2015
http://dx.doi.org/10.4314/WSA.V41I4.08
ARTICLES
Establishing a conversion factor between electrical conductivity and total dissolved solids in South African mine waters
Elena HubertI; Christian WolkersdorferII,III, *
ITU Bergakademie Freiberg, 09599 Freiberg, Germany
IITshwane University of Technology (TUT), Private Bag X680, Pretoria 0001, South Africa
IIILappeenranta University of Technology (LUT), Laboratory of Green Chemistry, 50130 Mikkeli, Finland
ABSTRACT
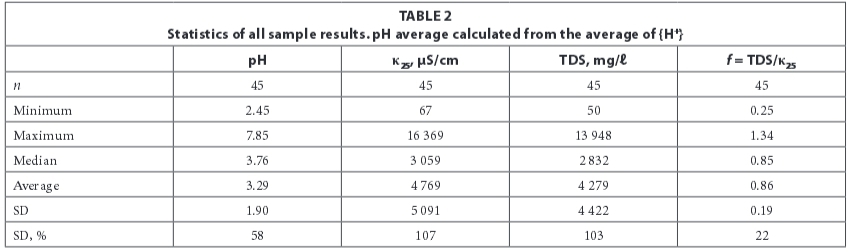
Total dissolved solids (TDS, in mg/ℓ) can be estimated from measurements of electrical conductivity at 25°C (EC, in μS/cm) by applying a conversion factor f. This factor is commonly reported to range from 0.54 to 1.1. For 45 South African mine-water samples, factors between 0.25 and 1.34, with a median of 0.85, were determined. The samples cover an EC-range of 70- 16 000 μS/cm and TDS of 50-14 000 mg/ℓ. Linear regression for the entire dataset yields a conversion factor of 0.88 but for samples with EC < 5 000 μS/cm, a conversion factor of 0.97 is recommended. However, both of these factors allow only estimates of TDS and for accurate TDS values it is necessary to determine the conversion factor specifically for each site. Besides spatial variations, temporal variations of conversion factors were also observed.
Keywords: EC, electrical conductivity, mine water, TDS, total dissolved solids, SA, South Africa
INTRODUCTION
Aim
Estimations of total dissolved solids (TDS) content are commonly based on electrical conductivity (EC) measurements, using a conversion factor retrieved from regulations or guidelines (Wolkersdorfer, 2008). One of the applications of these conversion factors is in the mine-water treatment schemes in post-mining areas of South Africa; but TDS content is also of relevance in other mine-water projects. The aim of this paper is to establish a conversion factor for those parameters using South African mine-waters as a case study and to identify if reported conversion factors are valid for mine-water (e.g. DWA, 2012).
Historical context for South African mine-water issues
Industrial mining in South Africa began in the mid-1800s with the exploitation of the country's copper resources. A large expansion of mining activity took place after the gold deposits in the Witwatersrand area were discovered in 1886 and the adjacent coal fields opened (Minerals Bureau, 1998). Meanwhile, many mine sites were abandoned, the pumps stopped and no appropriate steps of mine closure taken. This led to uncontrolled flooding and mine-water started to discharge, eventually interacting with natural ground and surface water. The issue received widespread attention, with the first mine-water discharging into the West Rand mine-water pool in 2002 (Coetzee et al., 2003; Hobbs and Cobbing, 2007), following water-level rise above the environmentally-critical level (ECL)in 2000 (Ramontja et al., 2010).
In large areas of South Africa, acid mine drainage (AMD) from gold, coal and base-metal mining causes a serious environmental problem (Makgae, 2012). The major sources of AMD are the di-sulphide minerals pyrite and marcasite, which, if coming into contact with oxygen, produce sulphuric acid and elevated concentrations of dissolved iron. Consequently, the acid facilitates the dissolution of other minerals, causing a high load of dissolved solids (Wolkersdorfer, 2008). However, not all waters in contact with mine voids have low pH, especially when buffering minerals are abundant or when no di-sulphides exist in the mine's host rocks.
Currently, water is being pumped from the three priority mine-water pools in the Witwatersrand area in order to keep or re-establish water levels below the ECL. The water most often is of inadequate quality for use in any field or for direct discharge into rivers. Consequently, treatment with respect to pH, acidity, iron and other metals is inevitable (Ramontja et al., 2010).
TDS is used to calculate the volume of sludge that will be generated by treating the mine-water (e.g. DWA, 2012). This parameter is thus essential for the dimensioning of storage basins for sludge deposits. Rarely is TDS being determined directly but rather is being estimated by different means, for which the conductivity method is but one option (DWA, 2012).
Several studies referring to EC/TDS ratios have already been conducted in South Africa. Simonic (2000) compiled chemical, physical and physico-chemical parameters from the Department of Water Affairs and Forestry (DWAF) database. Using the results of groundwater analysis, he compiled a spatial distribution map (Map C2) of the TDS/EC correlation using field and laboratory measurements. This map shows EC/TDS ratios from below 0.6 to above 0.8, unfortunately without giving statistical data for the map. Huizenga at al. (2013) used the 1972 to 2011 surface water data of the DWA dataset and compiled comprehensive datasets of South Africa's surface water chemistry. In their dataset, they included the 'total dissolved solids imbalance', which is based on the measured and calculated TDS from the chemical analysis. Van Niekerk et al. (2014) explicitly investigated the TDS/EC ratios for South African rivers at 38 sampling locations of the DWA database using 18 363 individual samples. Their TDS/EC ratios range between 0.50 and 0.80 with an average of 0.68, which is close to the ratio of 0.65 recommended by DWAF (1996b). None of these studies explicitly investigated mine-waters. Therefore, this study aims at filling this gap.
Electrical conductivity
Basics
Although practitioners and researchers perform electrical conductivity measurements on a regular basis, they do not always know the theoretical background. Therefore, the following sections will provide a short introduction to the subject. Only the most relevant equations will be given in helping to understand this relationship.
The electrical conductivity of an aqueous solution is its ability to pass an electric current. Being a characteristic property of solutions, it is used in a range of fields and industrial applications, e.g., mine-water management (Gelhaus and Lacourse, 2004). Electrical conductivity depends mainly on the concentration of dissolved electrolytes and gases. With respect to the dissociated ions in particular, EC is a function of their mobility, determined by charge and dissolved radius and the solution's viscosity and temperature (Coury, 1999).
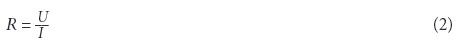
The parameter measured by the instrument is the conductance G, being the reciprocal of the resistance R.

Resistance R is defined by the current I that flows when a certain potential U is applied.
G, the electrical conductance, depends on the properties of the solution as well as on the dimensions of the measuring cell. Those dimensions, the physical shape and the size of the conductivity cell limiting the ions' movement, are represented by the cell constant K, which is constituted of the electrode distance l and the electrode surface A.

Multiplying the conductance G and the cell constant K results in the conductivity κ (sometimes also γ), which is thus a solution-specific parameter, independent of the instrument's geometry.

This calculation is usually performed within the instrument and the reading given is that of the (electrical) conductivity κ, sometimes also referred to as specific conductance (South African National Standard, 1985). Per definition, this is the conductance of a body of solution of a given unit length and cross section at a specified temperature θ (Hem, 1985). As the reciprocal of the resistance's unit, Ohm (Ω) is the Siemens (S), Siemens per meter (S/m) is the SI unit for conductivity at temperature θ. Internationally, figures in water science are commonly given in mS/cm or μS/cm, whilst in South Africa or Finland very often mS/m (South African National Standard, 1985), and in the US mmho/m, is used. The latter should be avoided, as it is not an SI unit. Different authors assume that the terms specific conductance (Atekwana et al., 2004) or electrical conductivity indicate that the solution-specific property of conductivity was normalized to 25°C, but this is not commonly accepted as a convention. Assumption that a temperature compensation was done can thus lead to misinterpretation of data.
Before measurements are performed, instrument calibration with a standard solution of known electrical conductivity ks is necessary (Gelhaus and Lacourse, 2004). This calibration determines the cell constant for the measured electrical conductance of that standard GS.
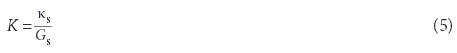
Subsequently, the cell constant will be used to convert conductance to conductivity, because although in theory the cell constant is defined by its geometry, it is practically only measurable under working conditions and also changes over time.
Temperature correction
Electrical conductivity strongly depends on the solution's temperature θ because the movement of ions is directly proportional to the temperature. Due to the large dependency of EC on temperature, values are only comparable if either measured at or converted to the same reference temperature (Smith, 1962). In most countries, the reference temperature for water is 25°C, but since this is not the same worldwide or across all fields of science, the reference needs mentioning with the data. This procedure is referred to as temperature correction or temperature compensation and is done by applying a linear or non-linear correction algorithm, which is even required for measurements close to 25°C.
For the purpose of temperature compensation, a temperature coefficient αθ is used. It characterizes the rate of conductivity change per degree of temperature change. For practicality, mean temperature coefficients for certain temperature ranges are used (Smith, 1962).
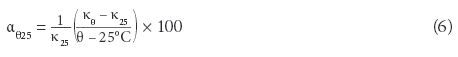
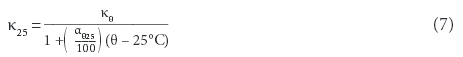
By applying this coefficient, electrical conductivity κ25 at 25°C can be calculated from a conductivity κθ measured at temperature θ (all temperatures in °C).
In case of a linear correction, the same coefficient is used across the whole temperature range. A common coefficient α for that purpose is 2%/K, which is derived from the coefficient of 1.91%/K for a standard KCl solution assumed to be an approximation for most natural waters (Standard Methods for the Examination of Water and Wastewater, 2005). Many conductivity meters have a built-in temperature compensation, using mainly linear algorithms to convert the sample conductivity to the chosen reference temperature. For natural waters with conductivities of approximately 60-1 000 μS/cm, a non-linear compensation can be used (South African National Standard, 1985: SANS 7888: identical to ISO 7888-1985). Yet, regardless of the compensation method used, the more the sample temperature deviates from 25°C, the larger the uncertainty of the temperature compensation.
Calculation of EC from ionic concentrations
If results from a chemical analysis are available, electrical conductivity can be computed from the ions' concentrations. Twelve different equations have been proposed and are discussed in McCleskey et al. (2012). They require knowledge of the tabulated molecular conductance λ of the individual types of ions (limiting ionic molecular conductivity), including their valence states Z. The method used in this paper is based on Rossum (1975) and Coury (1999), applying an extended table listed in Wolkersdorfer (2008):
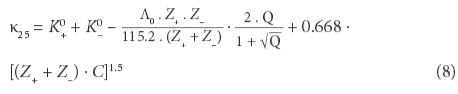
with:
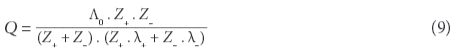
and: Λ0 , the total ionic conductance (λ+ + λ), as well as C, the concentration of the ion (mol/ℓ). At the assumed state of infinite dilution, the contribution of different types of ions in a complex solution to conductivity is additive. McCleskey et al. (2011) introduced the 'transport number for the individual ions' and could show that there are 3 groups of ions that contribute to the water's EC: significant (H+, Na+, Ca2+, Mg2+, NH4+, K+, Cl-, SO42-, HCO3-, CO32-, F-, Al3+, Fe2+, NO3-, HSO4-), moderate (Li+, Fe3+, Cu2+, Mn2+, Zn2+, OH-, NaCO3-) and very little contribution (Ba2+, Br-, Cs+, Sr2+, KSO4-). OH- needs to be considered for pH higher than 9 and H+ for pH below 5, since the conductance contributed by OH- and H+ is substantially greater than that of other ions (Rainwater and Thatcher, 1960).
Because the molecular conductance λ changes with concentration, the activity of the species in the sample needs to be known (Coury, 1999; McCleskey et al., 2012). For accurate EC calculations, it is therefore imperative to account for the individual concentrations of the ions in solution. PHRREQC is a chemical-thermodynamic computer code for calculating aqueous speciation, which computes the EC based on the results of the water analysis, based on Kohlrausch's law and the Debye-Hückel equation (Parkhurst and Appelo, 2013). For most waters with electrical conductivities below 60 mS/cm and MgSO4-rich waters below 20 mS/cm, this method results in sufficiently good results (Appelo, 2015). Those results can then be used to verify the accuracy of the chemical analysis, a method that is more reliable than the commonly-used ionic balance (Wolkersdorfer, 2008).
Total dissolved solids
Total dissolved solids (TDS) or filterable matter (ASTM D5907-13) is a measure of the total concentration of dissolvedmatter in a water sample (ASTM D5907-13; Hem, 1985; US Environmental Protection Agency, 1971). It includes all inorganic and organic dissociated anions and cations as well as undissociated dissolved species (McNeil and Cox, 2000). It is sometimes wrongly called total dissolved salts (Hobbs and Cobbing, 2007; Hobbs et al., 2008) or mistakenly confused with salinity (Scofield and Wilcox, 1931; Rainwater and Thatcher, 1960; McNeil and Cox, 2000; Zinabu et al., 2002; Oelofse and Strydom, 2010). Sometimes it is also defined as the content of dissolved inorganic salts (DWAF, 1996b). Results are reported as mass per volume units, most commonly mg/l Together with total suspended solids (TSS), TDS makes up the total solids (TS) content of water.
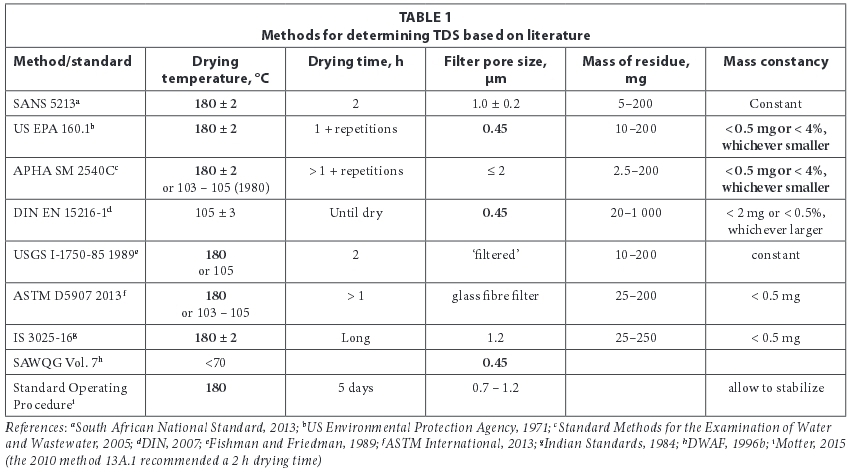
The standard method for the determination of TDS is gravimetric, where an accurately measured volume of filtered sample is evaporated and dried at a certain temperature (e.g. South African National Standard, 2013). The volume of sample to be evaporated depends on the expected TDS, which can be estimated from a quick EC measurement. If the sample volume chosen is too large, an excessive amount of residue can remain and water entrapped in the crust might not be released in its entirety during the drying process (Rainwater and Thatcher, 1960). Though the determination of TDS seems to be relatively straightforward, the results of TDS determination are influenced by various parameters, such as pore size, porosity and filter thickness, particle size, amount of sample and drying time as well as method used (Table 1).
Drying at 180°C for a duration of 1 to 2 h will lead to the release of almost all mechanically held water and most water of crystallization. At that temperature, all bicarbonate, which becomes unstable at 100°C, will be transformed to carbonate, releasing carbon dioxide (Rainwater and Thatcher, 1960). Some organic and also inorganic matter, such as nitrite and boron, will be volatilized (Howard, 1933; Hem, 1985), but not all of it will be removed completely. Especially at low pH, some anion content, such as chloride and nitrite, may be lost by the volatilization of acids (Standard Methods for the Examination of Water and Wastewater, 2005). Contrary to those losses, some weight gain can also happen due to oxidation or transformation into hydroxides. Some parameters may cause a longer drying time. These are a particularly high mineral content, a high bicarbonate concentration or large concentrations of calcium, magnesium, chloride and sulphate. Weighing will have to be done as soon as possible after the required cooling phase, in a desiccator (US Environmental Protection Agency, 1971). Even after the slower release of contained water, some crystallization water may remain in residue when rich in gypsum (Hem, 1985). At lower temperatures, not all of those processes occur until completion, usually leading to more water retained in the solids. Yet, different temperatures are recommended for drying by different standards (Table 1). In addition to the results, it is consequently necessary to record the drying temperature - even for more dilute natural waters for which differences in the drying temperature yield not substantially different results (Hem, 1985).
Because the evaporation method is time consuming and thus expensive, methods for determining TDS mathematically from ion concentrations, sulphate concentration and EC exist. If a reasonably complete chemical analysis was performed, a possible method for determining TDS is to add up all of the ion concentrations, which usually yields results quite close to the gravimetric method. Particularly in mine-water with elevated EC and low pH-values, metal ions such as Fe, Al and Mn can be abundant (Blowes et al., 2014). To avoid errors in the TDS calculation, those concentrations have to be added to the main ions. Rucker et al. (2009) estimated TDS with on-site geophysics and found good correlations (R2 = 0.85) between the measured resistivity and the TDS content of the mining-impacted groundwater, which can be used to map for potential ground-water contamination.
TDS-EC conversion factors
As a result of its own dissociation, the EC of pure water is 0.05483 μS/cm at 25°C (South African National Standard, 1985). Exposure to the atmosphere will raise the conductivity to > 2 μS/cm due to contamination with CO2. In natural waters, conductivity will typically range from tens of μS/cm to tens of mS/cm (Hem, 1985). Because almost all the conductivity is accounted for by the dissolved ions, there is a direct proportionality between EC and TDS:

This conversion factor f allows the estimation of TDS from a precisely measured EC (Singh et al., 1975) and is commonly used in all situations where TDS needs to be established quickly (e.g. agriculture, industry, water supply, resource management or mining; Van Niekerk et al., 2014).
At lower concentrations, the relation between concentration and EC for single electrolyte solutions is linear and flattens off for higher ones because the ionic mobility decreases with increasing concentration due to interferences and interactions between the ions. Yet, the slope of the linear part, as well as the degree of flattening off at higher concentrations, differs for different dissolved electrolytes. As natural waters are not simple solutions and contain various ionic and undissociated species with widely varying amounts and proportions, the relationship between EC and TDS becomes complicated. However, it is generally well enough defined to be of good practical value (Hem, 1985), and a linear relationship is usually a reasonably good estimate.
Commonly, predefined conversion factors without proper site-specific validation are used. Yet, the factors differ for different types of waters, depending on the dominant major ions varying between water bodies, sampling locations and seasons (Van Niekerk et al., 2014). Consequently, TDS calculated from a generalised factor is an estimate (Scofield and Wilcox, 1931) and accurate TDS calculations need site- and runoff-specific conversion factors (Smith, 1962).
The exact value for the conversion factor depends on the water's ionic composition, especially its pH and bicarbonate concentration (DWAF, 1996a) and the TDS of the solution (DWAF, 1996b; Van Niekerk et al., 2014). Van Niekerk et al. (2014) documented that factors were not consistent between sites belonging to different river systems, but varied little for individual sites. The ratio cannot be constant across wide ranges of TDS due to differences in the degree of dissociation of dissolved electrolytes at different solution concentrations and due to differences in the mobility of the ions in solutions of mixed dissolved electrolytes (Van Niekerk et al., 2014). While conductivity is only influenced by ionized constituents, TDS also contains non-conducting material, such as some organics and silica. Day and Nightingale (1984) found that incorporating groundwater SiO2 concentrations substantially increased accuracy of the regressions between TDS and EC.
Although f should have the unit (mg.cm)/(ℓ.μS) derived from TDS and EC, it is usually given without units. To avoid miscalculation, it is therefore relevant to know the used SI units. All of the following factors are for conversion from EC in μS/cm to TDS in mg/ℓ.
The South African National Standard for TDS (2013) recommends a factor of 0.75 to estimate the volume of water to be evaporated for TDS determination. Scofield and Wilcox (1931) discussed converting EC to 'total dissolved electrolytes'. For irrigation water, they recommend using 0.7 for sulphate-dominated waters with an EC > 1 000 μS/cm and 0.6 for chloride-dominated water with an EC below that threshold. A similar differentiation was made by Hem (1985) with factors of 0.54-0.94 for natural inland waters, where most fall between 0.55 and 0.75, and with higher ones for sulphate-rich and lower ones for chloride-rich waters. This latter span was adopted by the DWAF for the South African Water Quality Guidelines (DWAF, 1996b) for the use of water in various fields, including domestic, industrial and agricultural, with strong emphasis put on the average lying at 0.65. The US Geological Survey has long been suggesting 0.65±0.1 (Rainwater and Thatcher, 1960), stating that the factor increases for higher TDS (especially when containing substantial amounts of non-ionized silica) and is lower for waters high in free acid, alkalinity and NaCl. For Australian surface waters, McNeil and Cox (2000) ascertained factors of 0.59-0.72, with a normal variability between < 0.35 and > 1.00 in a conductivity range of 50-1 000 μS/cm. For mountain streams, Singh et al. (1975) determined 0.54-0.55. Atekwana et al. (2004) report a factor of 0.55-0.8 with a regression providing 0.64. Van Niekerk et al. (2014) recommended factors of 0.48 - 0.86 for individual samples with a median of 0.7, where NaCl-dominated waters were prone to lower - and Ca(HCO3)2 dominated waters to higher - conversion factors. Other scientists use regressions between EC and TDS that do not intersect at the origin, avoiding a simple factor for conversion (Day and Nightingale, 1984). Instruments for measuring and logging EC often have built-in options to perform the conversion to TDS with settings ranging from 0.5 to 0.7, though the factor can usually be set manually (Van Niekerk et al., 2014). No publications on determining conversion factors specifically for mine-water were found.
In its 'Feasibility Study for a Long-Term solution to Address the Acid Mine Drainage Associated with the East, Central and West Rand Underground Mining Basins' (2012), the Department of Water Affairs (DWA, formerly known as DWAF) used a factor of 1.1 to calculate TDS in some cases; in other sections it was not indicated which method was used to estimate TDS, although several options are referred to in the theoretical section. In its report to the Inter-Ministerial Committee on Acid Mine Drainage, the same institution referred to using a factor of 1.06 in the same context (Ramontja et al., 2010). Hobbs (2013) mentions using 0.77 and 0.7 to derive TDS from EC. The frequently recommended factor of 0.65 in praxis also gets applied in the context of mine-water (e.g. Hobbs 2011) and other applications (e.g. Kempster et al., 1997; Reinders, 2010).
METHODS
Sampling
A total of 45 samples from 38 locations in the South African provinces of Gauteng and Mpumalanga were investigated. Most samples were taken from surface discharges, a few from shafts and some from mine-water influenced surface water. 1-l plastic sampling bottles were cleaned and rinsed 3 times with the unfiltered water to be sampled before being filled entirely and then stoppered. Samples were stored in cool and dark conditions at 4°C until analysis.
EC measurements
EC, κθ, as well as temperature, θ, were measured with an IntelliCAL graphite, 4-pole conductivity probe (CDC40101) attached to a Hach HQ40d handheld meter. The instrument was calibrated daily using a 0.01 M KCl standard solution with an EC of 1 413 μS/cm at 25°C. In addition, a daily calibrated IntelliCAL gel-type pH probe (PHC20101) was employed. Laboratory EC measurements were performed at ambient room temperature, between 18.3°C and 26.3°C (mean 23.2°C), with subsequent manual temperature correction.
In order to set up an accurate temperature-conductivity relation for each single sample, conductivity was measured constantly while slowly heating up a cold portion of each sample. Heating occurred from 5-10°C to 35-45°C over the course of 30 min on a heating plate with a magnetic stirrer. Regression analyses were made using the program TableCurve and linear temperature coefficients determined for the required temperature sections. These were applied for computing the temperature-corrected value κ25 of EC at 25°C.
Measuring errors for EC are due to contamination between samples, suspended matter in the sample, grease or oil, and air bubbles forming on the electrodes while warming up. Contamination was minimized by rinsing the probe with deionized water and blotting it dry with a lint-free paper cloth. By keeping the sample in motion with a magnetic stirrer, most of the bubbles were eliminated. In addition, EC for 12 samples that had been chemically analysed was calculated from the ionic concentrations.
Determining TDS
Clean and empty beakers for evaporation were dried at 180°C for 1 h, cooled in a desiccator for 30 min and weighed to an accuracy of 0.1 mg, followed by half-hour drying phases in the drying-cooling-weighing cycle until constant mass was obtained, which was defined as a mass change < 0.5 mg between successive measurements. The beakers were then stored in a desiccator until use on the same day.
Each sample was filtered (0.45 μm cellulose nitrate membrane filters) with Millipore filtration units and a vacuum pump. The required volume of sample was pipetted into the evaporation dish and samples were evaporated in a drying oven overnight (just below boiling temperature). The drying cycle as described for beaker preparation encompassed a first 2-h drying step, followed by half-hour drying steps until constant mass was achieved. The beakers subsequently were left to cool in a desiccator for 30 min, which was long enough to bring them to almost-ambient temperature, but short enough that the more hygroscopic minerals could not collect too much moisture. Longer cooling times often resulted in mass gain.
TDS was then calculated with the following equation (Standard Methods for the Examination of Water and Wastewater, 2005):
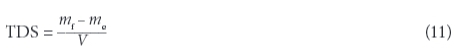
with: V the volume of sample before evaporation, me the mass of the empty beaker and mf the mass of the beaker containing residue. All samples were analysed in duplicates, some in triplicates; TDS standards and deionized water as blanks were handled in the same way as the samples.
Calculation of EC from chemical analysis
Often, the TDS determined through evaporation is greater than that obtained by summation of the individual constituents, due to the retention of crystallization water and small quantities of undetermined constituents. However, the concentrations of all individually determined constituents were added together as their anhydrous residue (Rainwater and Thatcher, 1960). Bicarbonate and carbonate content were calculated from total alkalinity in CaCO3 eq mg/ℓ (TAL) as a function of pH and the fractions of CO32- and HCO3- were estimated using the carbonate equilibrium system. The bicarbonate content in solution was then divided by 2.03 to account for its transformation to carbonate - the form it will have in the residue - and the correlated loss of CO2.
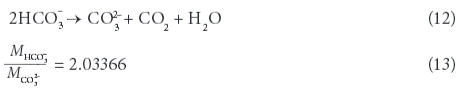
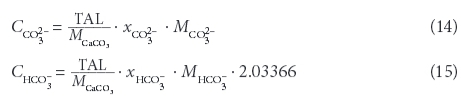
with xCO32- and xHCO3- being the fractions of CO32- and HCO3-based on the carbonate equilibrium.
All other constituents were assumed to be in the same form in the anhydrous residue as analysed in the water. Crucial for the EC are the following constituents: Na+, K+, Mg2+, Ca2+, Ba2+, Cu2+, Ni2+, Fe2+, Fe3+, Mn5+, Cl, F-, NO3-, SO42-, PO42-, NH4+, as well as total alkalinity and pH.
Calculating conversion factors
For each sample, the average for the duplicate or triplicate measurements was used to determine the conversion factor. Average TDS and EC measurements of each sample were plotted to determine a general conversion factor by linear regression. For the 12 samples where chemical analyses were available, the factor was calculated from the computed TDS and EC values.
RESULTS AND DISCUSSION
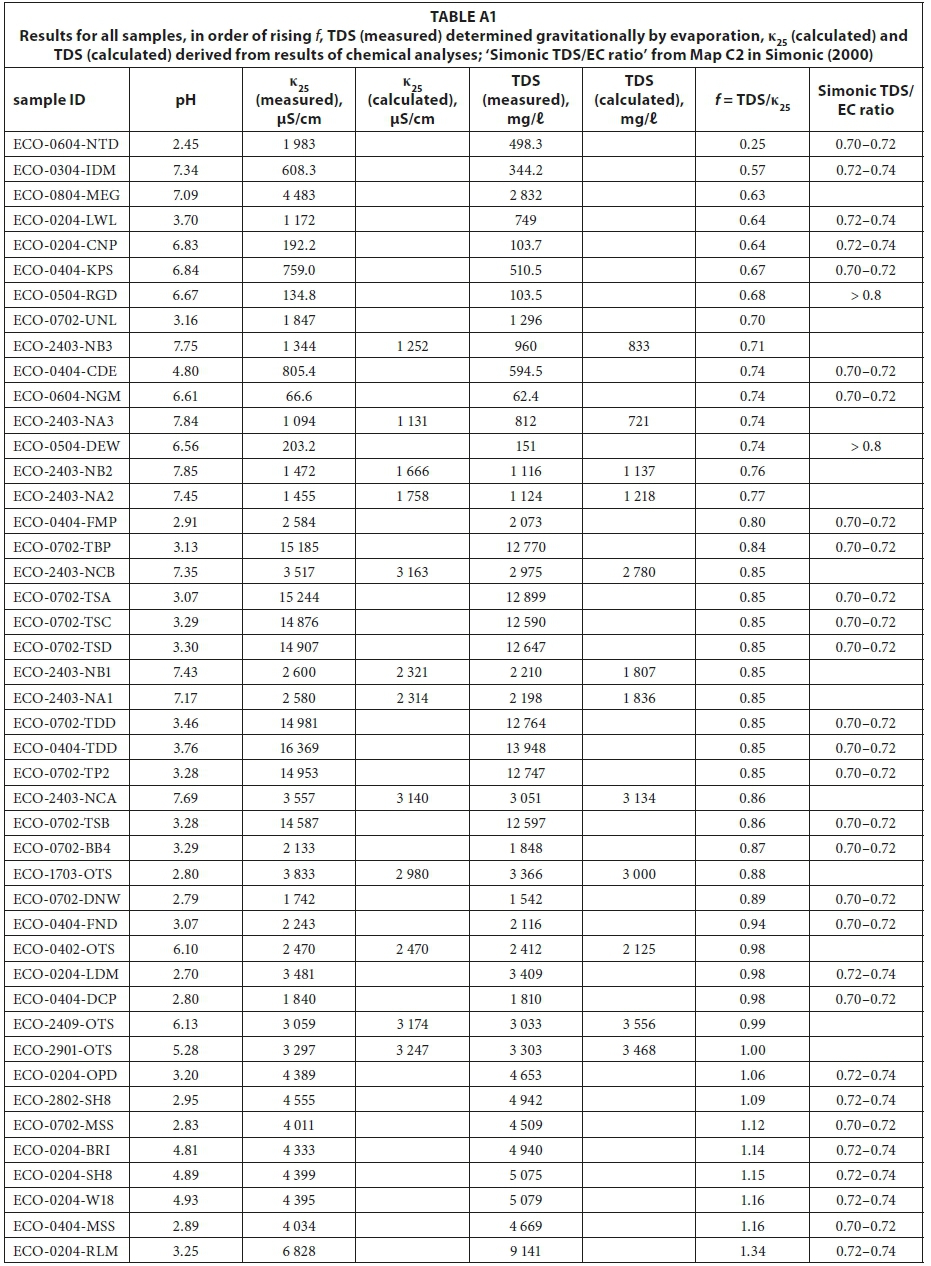
It could be shown that the individual results show a high variability (Appendix: Table A1). In addition, the appendix shows the TDS/EC ratio from Map C2 in Simonic (2000). As can be seen, there is no correlation between the conversion factors for mine-waters and the groundwater ratios established by Simonic (2000). The highest conversion factor (1.34) is for a sample from Robinson Lake in the West Rand that is strongly influenced by evaporation, with its banks being yellow from precipitated iron compounds. In contrast, the lowest factor (0.25) is for a sample from a rainfall pond on top of an uncovered tailings dam on the former Nestor gold mine near Sabie. Thus, this water is interacting with man-made solids and requires a factor very different from the 0.74 for the water from the nearbyby mine itself, where quartzite is the predominant rock type. Very low conversion factors may be due to loss of volatile constituents in the drying process (e.g. organ-ics, ammonia or nitrite) and very high conversion factors could be caused by the presence of large amounts of poorly dissociated calcium, sulphate ions or silica (Day and Nightingale, 1984).
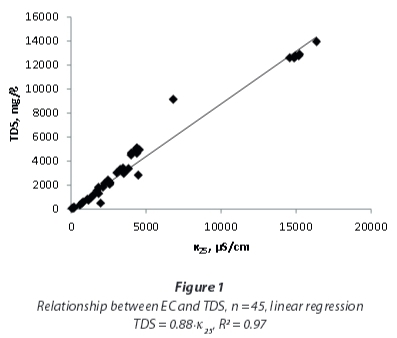
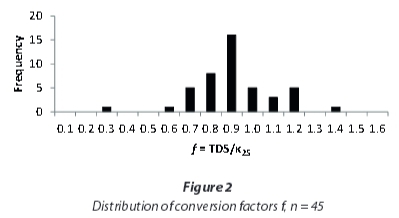
The 45 samples provide a wide range of EC, TDS and conversion factors (Table 2, Fig. 1) with a median EC of 3 059 μS/cm and a median TDS of 2 832 mg/ℓ, showing a bimodal distribution, with EC < 5 000 μS/cm and EC around 15 000 μS/cm. However, the conversion factors calculated from single measurements are close to a normal distribution (Fig. 2), ranging around a median of 0.85 with only a minor indication for a bimodal distribution. A linear regression including the full range of results (Fig. 1) leads to a conversion factor of 0.88.
At Lancaster Dam in the West Rand, the water is very acidic and has a relatively high EC and TDS and a conversion factor of 0.98. Downstream of the dam, the water flows through a wetland area, which lowers the pH slightly and EC and TDS considerably. The sample from the wetlands requires a conversion factor of 0.64, which is much lower than that at the dam and very close to the generally recommended factors for natural waters.
The samples from Oak Tree Spring below Hippo Dam in the Krugersdorp Game Reserve illustrate that the conversion factor may have to be adjusted even for a single site, when conflux conditions change. Over the course of 14 months f first slowly and then abruptly dropped, from 1.00 to 0.88, with the latter, sudden drop correlating with a period of extensive rainfalls.
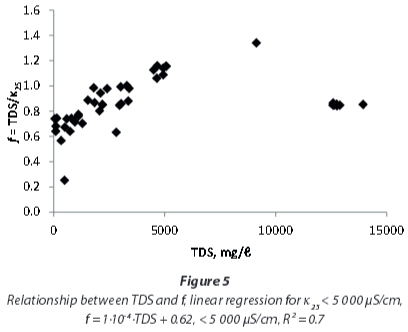
As Hem (1985) showed for single electrolyte solutions, the linear correlation between EC and TDS at lower concentrations will flatten at higher concentrations. A regression including only the samples with EC < 5 000 μS/cm (Fig. 3) yields a higher conversion factor, of 0.97, compared to the one including all samples that also is applicable to the samples with very high conductivities.

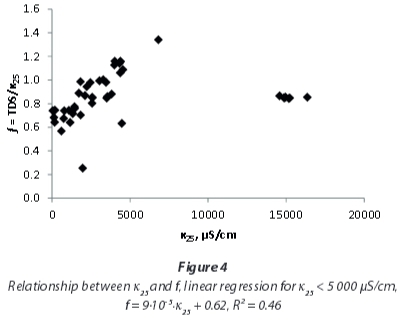
Yet, a detailed investigation of EC and TDS influences on the conversion factor (Fig. 4 and Fig. 5) shows that the correlation of EC and TDS is not linear for the mine-water samples examined in this study. At EC < 5 000 μS/cm, f is not constant, but shows a rise with EC and TDS respectively. For very high EC and TDS values the rise does not continue, but conversion factors are again lower.
For local studies with water of similar chemistry, conversion factors provide better TDS estimations compared to regional factors. This shall be exemplified by the following paragraphs focussing on the local results. The median conversion factor 0.94 for samples with EC < 5 000 μS/cm from northwest of Emalahleni (Table 3), influenced by coal mining, coincidentally is similar to that of the whole dataset for that range of conductivity. But even within this group of samples variation off between individual sites is obvious.
The origin of all samples with very high EC, between 14 587 μS/cm and 16 369 μS/cm (Table 4), and similarly high TDS between 12 590 μS/cm and 13 948 μS/cm, also lies northwest of Emalahleni, about 4-5 km away from the sampling sites of the previous group. All those samples have very similar conversion factors, with a median of 0.85.
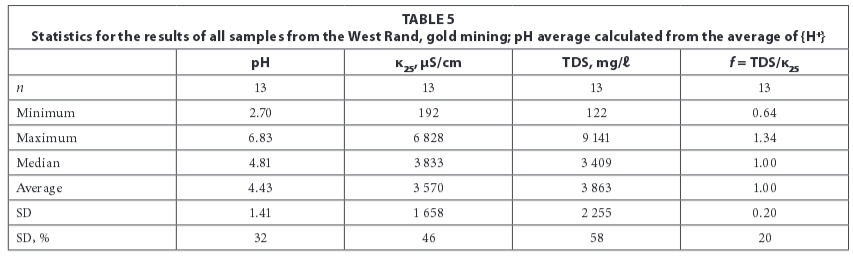
The samples from the Western Gold Field of the Witwatersrand mining area (Table 5) show a greater variation, also encompassing a larger spatial distribution and consequently water chemistry. The median conversion factor for those samples is 1.00, with a range from 0.64 to 1.34.
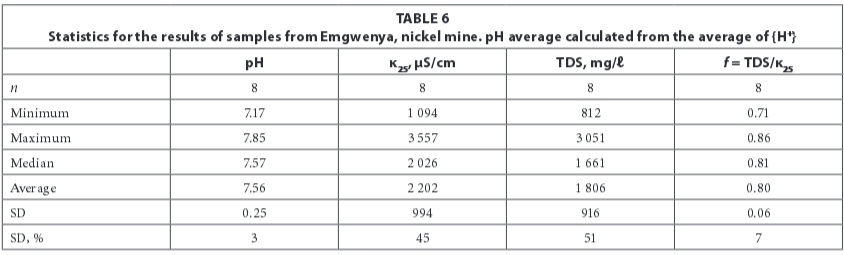
For the samples from a nickel mine in Emgwenya (Table 6), a conversion factor of 0.81 was derived. Those samples are characterized by neutral pH with EC and TDS higher than commonly observed for natural waters.
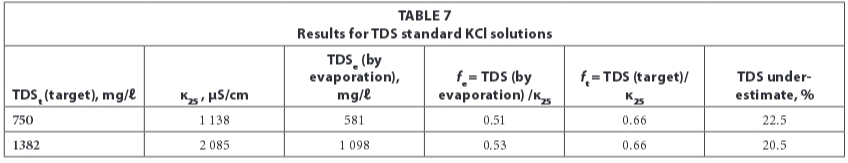
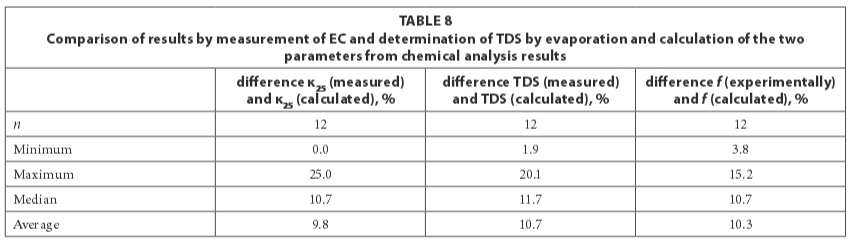
To investigate the accuracy of TDS determination by evaporation of the sample, the same experiment was performed with TDS standard KCl solutions (Table 8). It could be shown that TDS was underestimated by more than 20%, which led to relativelylow conversion factors. There were substantial losses of dissolved solids through volatilization and the evaporation method is not suitable to check TDS of single electrolyte standard solutions. The measured EC with the TDS allows one to suggest that the solutions should truly have yielded conversion factors of 0.66, which is very close to the factor of 0.65 that is generally recommended for use when no source for the factor is given. This could suggest that factors are sometimes determined from single electrolyte standards, which are not representative, per se, of the waters to be examined.
In some cases, a chemical analysis of the water sample might be available, but not an evaporative determination of TDS. Therefore, a comparison between the experimentally determined conversion factor, calculated from measured EC and directly-determined TDS, and the factor calculated from the two parameters, as computed from results of chemical analysis, was made (Table 8). The conversion factors determined with those two different methods differed by as much as 15%, with a median difference of 10.7%, approximately the same as the differences between TDS and EC from the two methods. Factors determined with the two methods cannot be treated equally in one dataset.
CONCLUSIONS
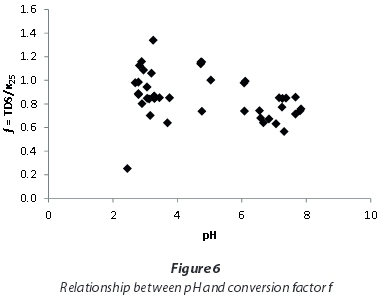
This study showed that applying a uniform conversion factor for EC and TDS for all of the investigated mine-waters results in wrong estimations of TDS. Total dissolved solids (TDS) from Mpumalanga and Gauteng waters with EC < 5 000 μS/cm can be approximated by using a conversion factor of 0.97, and for higher ECs a factor of 0.85 may be used instead. Yet, the relatively large range of factors spanning from 0.25 to 1.34 excludes the use of a standard factor for all mine-waters. Consequently, it is recommended that site-specific conversion factors should be determined with the gravitational method. A dependence of the conversion factor on pH, as stated by the DWAF (1996a) in the South African Water Quality Guidelines, cannot be supported by this study (Fig. 6).
Because of the variety of different methods available for determining TDS, the method used should always be mentioned, including the drying temperature and filter pore size. When using the conductivity method for estimating TDS, it is essential to mention the conversion factors and to carefully choose an appropriate factor for each sample in those cases where laboratory determination is not possible.
Even regional conversion factors based on groundwater data (Simonic, 2000) do not reflect the peculiar characteristics of mine-water. Based on the literature, similar results are expected in other areas of the world, where a single conversion factor is used to estimate the TDS based on the measured EC. It is therefore highly recommended that site-specific conversion factors be established for each mine-water project in order to achieve accurate TDS estimations.
ACKNOWLEDGEMENTS
We thank Prof M Momba at the Department of Environmental, Earth and Water Science at Tshwane University of Technology for providing us with the laboratory space and equipment for conducting the experiments. Jacoba, Lettie and Joyce helped out with tools and material required. Finally, but not at all least, we thank everyone who provided samples, and in some cases even results of chemical analyses: Henk Coetzee from CGS, Ed and Jenny Hardwick from Cwenga, Jannie Maree, Mariekie Gericke from Mintech and Sibusiso Sidu from Gold One.
Two anonymous reviewers helped to improve this paper and Broder Merkel pointed out a shortfall in the section about EC calculations. All comments are included in this final revision. This work has been financed by a SARChI grant to TUT from the National Research Foundation (NRF) under grant number 86948.
REFERENCES
APPELO CAJ (2015) Specific Conductance: how to calculate, to use, and the pitfalls. URL: http://www.hydrochemistry.eu/exmpls/sc.html (Accessed 27 June 2015). [ Links ]
ASTM D5907-13 (2013) Standard Test Methods for Filterable Matter (Total Dissolved Solids) and Nonfilterable Matter (Total Suspended Solids) in Water. in ASTM Internationals (ed), West Conshohocken. [ Links ]
ATEKWANA EA, ATEKWANA EA, ROWE RS, WERKEMA JR DD and LEGALL FD (2004) The relationship of total dissolved solids measurements to bulk electrical conductivity in an aquifer contaminated with hydrocarbon. J. Appl. Geophys. 56 (4) 281-294. [ Links ]
BLOWES DW, PTACEK CJ, JAMBOR JL, WEISENER CG, PAKTUNC D, GOULD WD and JOHNSON DB (2014) The Geochemistry of Acid Mine Drainage. in Turekian HD and KK Hollands (eds), Treatise on Geochemistry, Elsevier, Oxford, pp. 131-190. [ Links ]
COETZEE H, HORSTMANN U, NTSUME G and CROUKAMP L (2003) The potential impact of the decant water from Witwatersrand. In: Mine Water and the Environment, Proceedings of the 8th International Mine Water Association (IMWA) Congress, Johannesburg, 201-217. [ Links ]
COURY L (1999) Conductance Measurements: Part 1: Theory. Current Separations 18 (3) 91-96. [ Links ]
DAY BA and NIGHTINGALE HI (1984) Relationships Between Ground-Water Silica, Total Dissolved Solids, and Specific Electrical Conductivity. Ground Water 22 (1) 80-85. [ Links ]
DWAF (DEPARTMENT OF WATER AFFAIRS AND FORESTRY) (1996a) South African Water Quality Guidelines. Volume 1: Volume 1: Domestic Water Use, Pretoria. 190 pp. [ Links ]
DWAF (DEPARTMENT OF WATER AFFAIRS AND FORESTRY) (1996b) South African Water Quality Guidelines. Volume 7: Volume 7: Aquatic Ecosystems, Pretoria. 161 pp. [ Links ]
DWA (DEPARTMENT OF WATER AFFAIRS, SOUTH AFRICA) (2012) Feasibility study for a long-term solution to address the acid mine drainage associated with the East, Central and West Rand underground mining basins. DWA Report. No.: P RSA 000/00/16512/2. Resource Water Quality Objectives (RWQOs), Directorate: Water Resource Planning Systems, Chief Directorate: Integrated Water Resource Planning. Department of Water Affairs, Pretoria. 201 pp. [ Links ]
DIN (2007) Charakterisierung von Abfâllen - Bestimmung des Gesamtgehaltes an gelósten Feststoffen (TDS) in Wasser und Eluaten (EN 15216:2007). Deutsches Institut für Normung, Berlin. 11 pp. [ Links ]
FISHMAN MJ and FRIEDMAN LC (1989) Techniques of water-resources investigations of the United States Geological Survey Book 5, Laboratory analysis Chapter A. Volume 1: Methods for determination of inorganic substances in water and fluvial sediments (3rd edn.). United States Geological Survey, Washington, D.C. 545 pp. [ Links ]
GELHAUS SL and LACOURSE WR (2004) Measurement of Electrolytic Conductance. In: Cazez Js (ed.) Ewing's Analytical Instrumentation Handbook. CRC Press, Boca Raton. 561-580. [ Links ]
HEM JD (1985) Study and interpretation of the chemical characteristics of natural water. U.S. Geol. Surv. Water Suppl. Pap. 2254 1-263. [ Links ]
HOBBS PJ, OELOFSE SHH and RASCHER J (2008) Management of environmental impacts from coal mining in the upper Olifants River catchment as a function of age and scale. Int. J. Water Resour. Dev. 24 (3) 417-431. [ Links ]
HOBBS PJ and COBBING JE (2007) A hydrogeological assessment of acid mine drainage impacts in the West Rand Basin, Gauteng Province. CSIR Report No. CSIR/NRE/WR/ER/2007/0097/C. CSIR, Pretoria. 59 pp. [ Links ]
HOBBS PJ (ed) (2011) Situation assessment of the surface water and groundwater resource environments in the Cradle of Humankind World Heritage Site: Report prepared for the management authority, Gauteng Province, South Africa. 276 pp. [ Links ]
HOBBS PJ (2013) Pilot implementation of a surface water and groundwater resources monitoring programme for the Cradle of Humankind World Heritage Site. CSIR Report No. CSIR/NRE/WR/ER/2013/0023/B. CSIR, Pretoria. [ Links ]
HOWARD CS (1933) Determination of total dissolved solids in water analysis. Ind. Eng. Chem. Anal. 5 (1) 4-6. [ Links ]
HUIZENGA JM, SILBERBAUER M, DENNIS R and DENNIS I (2013) An inorganic water chemistry dataset (1972-2011) of rivers, dams and lakes in South Africa. Water SA 39 (2) 335-339. [ Links ]
INDIAN STANDARDS (1984) IS 3025: Method of Sampling and Test (Physical and Chemical) for Water and Wastewater, Part 16: Filterable Residue (Total Dissolved Solids) (First Revision) (3025 Part 16). 6 pp. [ Links ]
KEMPSTER PL, VAN VLIET HR and KÜHN A (1997) The need for guidelines to bridge the gap between ideal drinking-water quality and that quality which is practically achievable and acceptable. Water SA 23 (2) 163-167. [ Links ]
MAKGAE M (2012) The status and implications of the AMD legacy facing South Africa. in McCullough CD, Lund MA and Wyses L (eds). International Mine Water Association Symposium, 30 September - 4 October 2012, Edith Cowan University, Bunbury. 327-334. [ Links ]
MCCLESKEY RB, NORDSTROM DK and RYAN JN (2011) Electrical conductivity method for natural waters. Appl. Geochem. 26 (Supplement) S227-S229. [ Links ]
MCCLESKEY RB, NORDSTROM DK, RYAN JN and BALL JW (2012) A new method of calculating electrical conductivity with applications to natural waters. Geochim. Cosmochim. Acta 77 369-382. [ Links ]
MCNEIL VH and COX ME (2000) Relationship between conductivity and analysed composition in a large set of natural surface-water samples, Queensland, Australia. Environ. Geol. 39 (12) 1325-1333. [ Links ]
MINERALS BUREAU (1998) An overview over the South African minerals industry. In: Wilson MGC and Anhaeusser CR (eds) Handbook. Volume 16: The Mineral Resources of South Africa (6th edn). Council for Geoscience, Silverton. viii, 740, 5-10. [ Links ]
MOTTER K (2015) Standard Operating Procedure for the Determination of Total and Total Dissolved Solids: CCAL 13A.2. Corvallis, Oregon. 11 pp. [ Links ]
OELOFSE S and STRYDOM W (2010) A CSIR perspective on water in South Africa, 2010. CSIR Report No. CSIR/NRE/PW/IR/2011/0012/A. CSIR, Pretoria. 74 pp. [ Links ]
PARKHURST DL and APPELO CAJ (2013) Description of input and examples for PHREEQC Version 3 - a computer program for speciation, batch-reaction, one-dimensional transport, and inverse geochemical calculations. U.S. Geol. Surv. Tech. Methods 6 (A43) 1-497. [ Links ]
RAINWATER FH and THATCHER LL (1960) Methods for Collection and Analysis of Water Samples. Geol. Surv. Water Suppl. Pap. 1454 1-301. [ Links ]
RAMONTJA T, COETZEE H, HOBBS PJ, BURGESS JE, THOMAS A and KEET M (2010) Mine water management in the Witwatersrand Gold Fields with special emphasis on acid mine drainage: Report to the Inter-Ministerial Committee on Acid Mine Drainage. 146 pp. [ Links ]
REINDERS FB (2010) Standards and guidelines for improved efficiency of irrigation water use from dam wall release to root zone application - guidelines. Water Research Commission, Pretoria. [ Links ]
RUCKER DF, GLASER DR, OSBORNE T and MAEHL WC (2009) Electrical resistivity characterization of a reclaimed gold mine to delineate acid rock drainage pathways. Mine Water Environ. 28 (2) 146-157. [ Links ]
SCOFIELD CS and WILCOX LV (1931) Boron in irrigation waters. U.S.D.A. Tech. Bull. 264 1-65. [ Links ]
SIMONIC M (2000) The assessment of ambient groundwater quality at a national scale in the Republic of South Africa - an electronic atlas. WRC project K5/841. Water Research Commission, Pretoria. [ Links ]
SINGH T and KALRA YP (1975) Specific conductance method for in situ estimation of total dissolved solids. J. Am. Water Works Assoc. 67 (2) 99-100. [ Links ]
SMITH SH (1962) Temperature corrections in conductivity measurements. Limnol. Oceanogr. 7 (3) 330-334. [ Links ]
SOUTH AFRICAN NATIONAL STANDARD (2005) Water quality - determination of electrical conductivity (SANS 7888:2005). South African Bureau of Standards, Pretoria. 10 pp. [ Links ]
SOUTH AFRICAN NATIONAL STANDARD (2013) Water - dissolved solids content (SANS 5213:2013). South African Bureau of Standards, Pretoria. 5pp. [ Links ]
STANDARD METHODS FOR THE EXAMINATION OF WATER AND WASTEWATER (2005) Conductivity (2510). American Public Health Organization, Washington. 8 pp. [ Links ]
STANDARD METHODS FOR THE EXAMINATION OF WATER AND WASTEWATER (2005) Solids (2540). American Public Health Organization, Washington. 10 pp. [ Links ]
US EPA (UNITED STATES ENVIRONMENTAL PROTECTION AGENCY) (1971) Method 160.1 - Revision 11/16/1999. 3 pp. [ Links ]
VAN NIEKERK H, SILBERBAUER MJ and MALULEKE M (2014) Geographical differences in the relationship between total dissolved solids and electrical conductivity in South African rivers. Water SA 40 (1) 133-137. [ Links ]
WOLKERSDORFER C (2008) Water Management at Abandoned Flooded Underground Mines - Fundamentals, Tracer Tests, Modelling, Water Treatment. Springer, Heidelberg. [ Links ]
ZINABU G, CHAPMAN LJ and CHAPMAN CA (2002) Conductivity as a predictor of a total cations and salinity in Ethiopian lakes and rivers: revisiting earlier models. Limnologica 32 (1) 21-26. [ Links ]
Received 8 December 2014
Accepted in revised form 5 June 2015
* To whom all correspondence should be addressed. e-mail: christian@wolkersdorfer.info
APPENDIX

