


Serviços Personalizados
Artigo
 Inglês (pdf)
 Artigo em XML
 Referências do artigo
Indicadores

Links relacionados
-
 Citado por Google
 -
 Similares em Google
Compartilhar

 Permalink
Water SA
versão On-line ISSN 1816-7950
versão impressa ISSN 0378-4738
Water SA vol.41 no.4 Pretoria Jul. 2015
http://dx.doi.org/10.4314/WSA.V41I4.05
ARTICLES
Incorporating seepage losses into a 1D unsteady model of floods in an ephemeral stream
Rasool Ghobadian*; Masumeh Khalaj
Department of Water Engineering, Razi University, PO Box 1158, Kermanshah, Iran
ABSTRACT
Zangemar River is an ephemeral river located in the northwestern part of Iran. Maku and Poldasht are hydrometric stations located upstream and downstream of Zangemar River, respectively. The measured flood hydrograph indicates that the output hydrograph volume from Poldasht station is significantly less than the input hydrograph for Maku station, though there are no lateral outflow branches and the amount of evaporation and direct removal from the river reach during flood events is negligible. These transmission losses can be caused by infiltration into the streambed and floodplain. Due to transmission losses and lack of initial flow, flood routing in these rivers is impossible to achieve through conventional methods and it is essential to develop new flood routing methods. Therefore, in this study a computer model for natural river cross-sections has been developed in which partial differential equations of non-uniform unsteady flow (Saint-Venant equations) are solved by finite difference methods. These equations have been developed by adding Muskat's equation in such a way that seepage losses can be calculated simultaneously. The results showed that with consideration of seepage losses the developed model can predict the output hydrograph with good accuracy, compared to the field data. The results of flood routing for 13 input hydrographs showed that the seepage loss volume in the river reach is about 74% of the input hydrograph volume, on average. The model predicts seepage losses with a mean error of about 9.93% and the maximum error is less than 20%.
Keywords: flood routing, seepage losses, unsteady flow, Zangemar River
INTRODUCTION
Flooding flow volume in seasonal streams decreases due to evaporation as well as channel wall and bed penetration. Effective parameters determining transmission losses are (Joseph et al., 2004): (i) runoff volume and velocity; (ii) channel geometry; (iii) vegetation presence on the river path; (iv) man-made hydraulic structures like dams, checks and bridges; (v) location of groundwater table; (vi) characteristics of river side and bed soil; (vii) total volume of porosity of side and bed soil and pore size, shape and continuity; and (viii) the evaporation process. Boroto and Gõrgens (2003) revealed that the transmission losses could be as high as 30% of the runoff discharge. In dry regions, the groundwater table is fed mostly by transmission losses, which are considered to be the key factor for replacing the freshwater extracted from the groundwater table (De Vries and Simmers, 2002). Knighton and Nanson (1994) studied a long river (400 km) and a short river (32 km) in Australia. Their results showed that the Muskingum methodology could only estimate the short river's output hydrograph correctly. Vivarelli and Perera (2002) classified the methods for estimating transmission losses into 5 groups: (i) simple regression equation; (ii) simplified differential equation; (iii) combined use of simplified differential and regression equation; (iv) flow routing model (kinematic wave, Muskingum, and Saint-Venant equation); and (v) hydrologic budget. Using each of these methods has certain restrictions, such as the scale of the problem. Simple methods require less information about the physical features of the channel but are less general in application. According to Lane et al. (1980), the combined method, because of its ability to take losses into consideration, and the regression method, due to its development of prediction equations, are the most reliable amongst the mentioned methods.
Dynamic wave-based flood routing models can be useful for flow analysis and transmission loss estimation. But infiltration and seepage losses are complex issues in flood events, and model accuracy depends on using a suitable equation for a special condition (Liu et al., 2011). Ghobadian (2011) evaluated seepage losses for a branch of Hughes wash ephemeral stream (in Walnut Gulch watershed in southeastern Arizona) by solving 1-D flow equations (Saint-Venant) coupled with seepage equations such as Muskat's, Davis-Willson, and Ingham. He demonstrated that Muskat's equation estimates seepage losses better than other equations for single channels. Ghobadian and Fathi-Moghadam (2013) developed a computer model to calculate unsteady transmission losses in ephemeral branching unsteady streams. The Saint-Venant equations in their model were coupled with seepage equations in order to evaluate leakage losses. Their analysis indicated that Muskat's equation is able to estimate seepage losses much more realistically than Davis-Willson's and Ingham's equations. Also, the results of their model for a complex network of channels showed that seepage is sometimes high enough to change flow direction in a branch.
Lang (2005) predicted seepage losses for 14 flood events in 150 km of the Kuiseb River in the Namib Desert, Namibia. His results showed that input hydrographs with higher peak discharges have greater seepage losses. Cataldo et al. (2005) proposed that discharge appears to be the initial factor affecting transmission losses, not only in the arid west of the United States but also in some Midwestern streams. Moreover, they indicated that in regions in which most flood events result from intensive convectional storms, the location of the storm over the watershed also affects transmission losses. Tewolde and Smithers (2006) assessed the Muskingum-Cunge method for flow routing in ungauged river reaches both with and without lateral inflows. Their results showed that the computed outflow hydrograph generated using the Muskingum-Cunge method, with variables estimated using both the empirical relationships or assumed cross-sectional shapes, was reasonably accurate with respect to volume, peak discharge, timing of peak flow, and shape.
Al Faruque and Balachandar (2013) investigated the effect of seepage on different turbulent characteristics for an open channel flow. Their results revealed that the effect of seepage on different turbulent characteristics was not restricted to the near-bed region but could be seen for most of the flow depth. Also the effect of injection on different turbulent characteristics was more evident with the lower flow rate.
Battle-Aguilar and Cook (2012) artificially flooded 7 m of an ephemeral stream in southern Australia to calculate stream infiltration rates and to determine how the infiltration rate varies with stream depth. Infiltration rates were found to vary between 0.3 and 1.8 m2/d for water depths between 0.2 and 0.38 m. in some studies, satellite imagery has been used to discern flow loss rates along a stream reach (Walter et al., 2012) where an adequately long period of record is available and a number of flow events are captured. In another use of satellite imagery, Costa et al. (2012) integrated gauged flow measurements with satellite imagery to determine riverbed geometry and river dynamics between stream gauges, in order to estimate relationships between input flow and transmission losses for 60 km of the Middle Jaguaribe River, Brazil. Using this method they were able to develop an empirical relationship for transmission losses over a range of input flows. Owing to the inability of the kinematic wave to match flood wave timings in several large, very gently sloped channels in Colorado, USA, Shanafield et al. (2014) used the more complicated diffusion wave comparability to better capture momentum losses along 0.1-0.4 km segments of the channel. Shanafield and Cook (2014) developed a model that couples the diffusion-wave approximation with Philip's infiltration equation and MODFLOW to estimate the streambed's saturated hydraulic conductivity.
A computer model for flow routing of seasonal streams must be able to evaluate transmission losses in order to provide the users with the correct runoff water level and rate of groundwater recharge. In the present study a 1D computer model is developed in which the unsteady flow equations are coupled with Mouskat's equation in order to calculate seepage losses in Zangemar River. In the mentioned model, a finite difference scheme is used to solve Saint-Venant equations.
MATERIALS AND METHODS General characteristics of the area
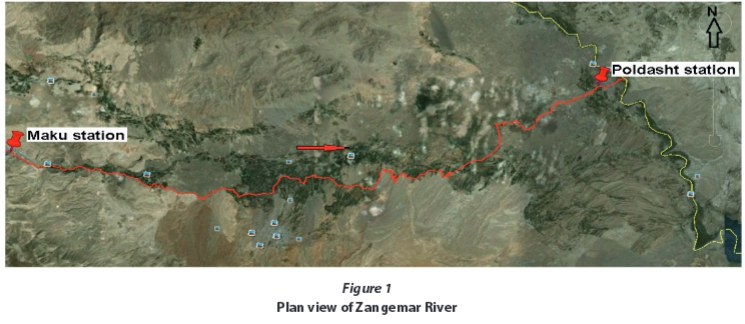
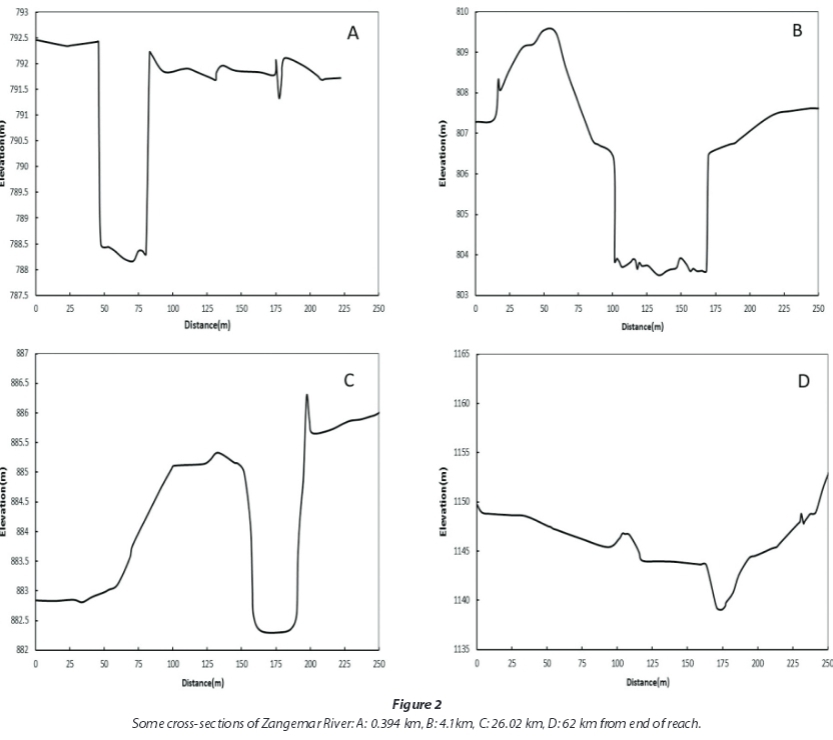
Aras catchment is located in the northwestern part of Iran and Zangemar River is one of the major drainages of this basin, draining 5 574 km2 of its area. In this study hydrodynamic data from Maku hydrometric station, located upstream, and Poldasht hydrometric station, located downstream, are used in order to estimate Zangemar River flood routing. Figure 1 shows the route of Zangemar River between Maku and Poldasht hydrometric stations. Some of the river reach cross-sections are shown in Fig. 2. Maku station is located at 44°31'36.8" longitude and 39°17'20.3" latitude and Poldasht station is located at 45°3'36.86" longitude and 39°20'48.3" latitude; Maku and Poldasht stations altitudes are 1 200 and 800 m, respectively. The length of Zangemar River between the two stations is 62 km; the slope of the first 10 km upstream is 0.02 and the slope of the 52-km downstream end of the river is between 0.003 and 0.007. The roughness coefficient varies along the 62-km length of the river reach based on characteristics such as bed roughness, type and density of vegetation, and path shape, and ranges from 0.035 to 0.05.
Numerical model
Due to substantial differences between the measured input/ output hydrograph volumes at Poldasht and Maku stations and the lack of a tributary branch between the two stations, flood routing is performed for this river by solving continuity and momentum equations known as Saint-Venant equations simultaneously, and by taking seepage losses into account. In the developed model, the following equations are solved:

where: Q= flow discharge, A= flow area, Z= water surface elevation, Tw= water surface width, β = momentum coefficient, n = Manning's roughness, R= hydraulic radius, x =distance along the channel length, t = time, ql= lateral input/output discharge per unit length of canal which is considered equal to seepage losses in the present study. In order to calculate the seepage discharge through wetted boundary of river (qL), the following Muskat's equation is used (Fotuhi and Hosseini, 2007):
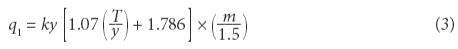
where: k = saturated hydraulic conductivity (m/s), y= flow depth (m), m = side slope of channel. It should be noted that Eq. 3 has been written for conditions under which the groundwater level is extremely far away from the channel bed. The Muskat's equation is valid when the distance between groundwater tables and the river water surface is 2 times more than the water depth in the river.
Continuity and momentum equations are discretized using finite difference methods. The river reach is gridded using the staggered grid scheme (Fig. 3), that is, the continuity equation is discretized on even-numbered cross sections and the momentum equation is discretized on odd-numbered cross sections.
The input hydrograph and stage-discharge relation are used as upstream and downstream boundary conditions, respectively.
For the case of using Muskat's equation for estimating the seepage losses, the linear form of the continuity equation on even nodes is used as follows:

where:
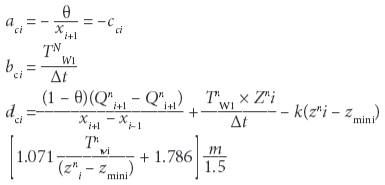
Discretizing the momentum equation on odd nodes results in the following linear equation:

where:

where: nand n+1 show time steps, Zmini is the minimum elevation of the ith cross section, and θ is the time-related weight parameter. A completely explicit scheme is used for the discretization of θ = 0 and a completely implicit scheme is used for θ = 1. In order to solve the equations set to obtain discharge and water level, a computer program is written, wherein the resulting equation set is solved with a 3-diagonal matrix algorithm (TDMA).
RESULTS AND DISCUSSION Model verification
Measured data by Putz and Smith (2000) were used in order to evaluate the capability of the unsteady model to simulate steady-state flow in natural cross sections. Their study reach is located downstream of the Wildwoods of Canada Ltd. effluent diffuser structure on the Athabasca River near Hinton, Alberta. The river discharge encountered during the field survey was close to seasonal norms and the average flow at Hinton during August is 354 m3/s, based on the Canada Records Water Survey (1961-1995).
Flow depths across each cross-section were measured with echo-sounding equipment and velocity measurements were taken across each of the cross-sections using a standard Price current meter. The geometry and distance between 23 of the river reach cross-sections, spanning a total distance of 20.6 km, were introduced to the model.
The upstream boundary condition had an input discharge equal to 354 m3/s and the downstream boundary condition was a stage-discharge relation that was calculated by the model using Manning's equation. The model was run with a 60-s time step. The calculated water surface elevation and average velocities of each cross-section were compared with the measured values.
Figure 4 plots the model and measured water surface elevation data against distance downstream and clearly indicates the model's accuracy in simulating steady flow in natural rivers. Figure 4 also compares the water surface elevation calculated by MIKE 11 and SMS models (reported by Zargar and Salehi Neishabouri (2009)) with the present model. It can be observed that the water surface profile calculated by the model shows a better fit with the measured data than the MIKE 11 and SMS models.
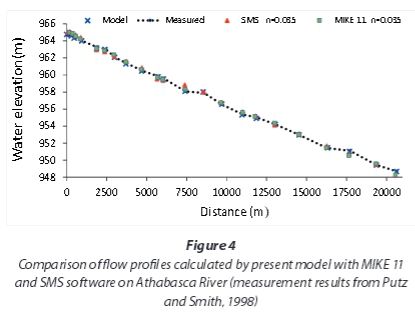
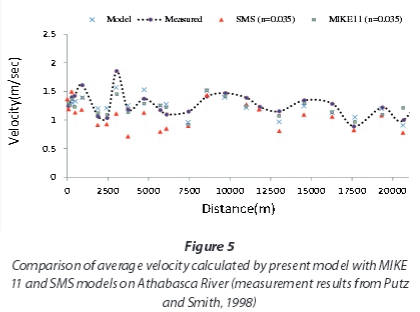
Figure 5 compares the velocity calculated by the present model and that calculated by the MIKE 11 and SMS models (reported by Zargar and Salehi Neishabouri, 2009) with the measured data. Once again the results show that the present model is more accurate than the MIKE 11 and SMS models.
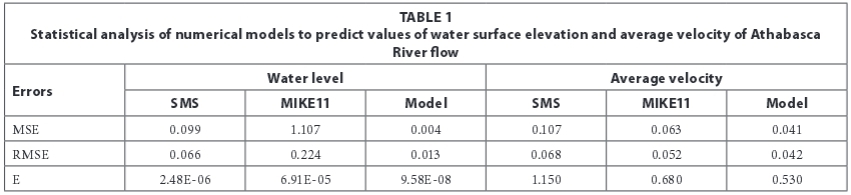
In order to compare the results, some statistical parameters were used:

where: C0 is the measured water surface elevation or velocity and Ccal is the calculated one.
Table 1 compares the statistical analysis results for the present model with that of other numerical models, indicating that the present model generates fewer errors in calculating the water surface elevation and flow velocity compared to the MIKE 11 and SMS models.
522 cross-sections of Zangemar River were used to determine whether the model is able to simulate a uniform and unsteady flow or not. In order to show that the computer model is able to satisfy the continuity equation, the riverbed was assumed to be impermeable. A trapezoidal shape hydrograph with a long period of steady-state flow (Fig. 6, blue colour) was supplied to the model for the upstream boundary condition. The downstream boundary condition was a stage-discharge relation that was built by the model using Manning's equation. The model output stage-discharge at the downstream end is shown in Fig. 6. The model was run with time steps ∆t = 25 s and θ = 0.75.

Figure 6 shows the input/output hydrographs calculated by the model in sections 200 and 500. The results of the model indicate the capability of the model for simulating steady flows because the output hydrograph's long horizontal sections that demonstrate steady flow are similar to those of the input hydrograph.
Moreover, the calculations demonstrate that the input and output hydrograph volumes at sections 200 and 500 are 5 644 800, 5 702 400 and 5 713 200 m3, respectively. An approximately 1% difference between the output and input hydrograph volumes indicates the model's high precision in satisfying the continuity equation.
Comparison of model results with field measurements
Flood data for Zangemar River from Maku and Poldasht hydrometric stations were used to evaluate the model's ability in simulating the output hydrograph.
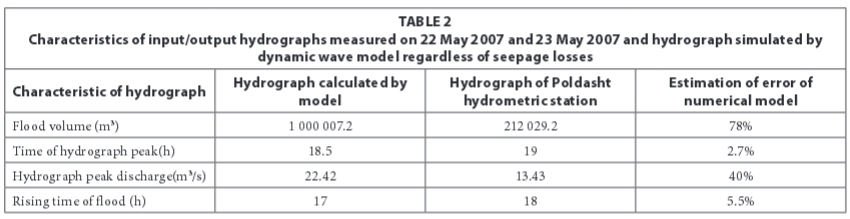
In order to compare the model's results with the field data, Maku hydrometric station's measured flood hydrograph from 22 to 23 May 2007and stage-discharge relation from Poldasht hydrometric station were employed as upstream and downstream boundary conditions, respectively. Flood routing was performed with time steps = 25 s and θ = 0.75. The results of this model are given in Fig. 7 and Table 2, and indicate that the model predicts the timing of the flood event and hydrograph peak time accurately in comparison with the field data. Also, the output hydrograph volume calculated by the model gives a 0.8% difference compared to the input hydrograph volume (1 000 000 m3); therefore it can be concluded that the model is capable of satisfying the continuity equation with high precision. A significant difference between the input/output hydrograph volumes as well as the lack of a lateral branch in Zangemar River attracted our attention to a phenomenon called water transmission losses.

Thus, in the next step, flood routing was carried out by modifying continuity and momentum equations to consider water seepage losses from the river's side and bed using Muskat's equation. For this reason, Zangemar River's hydraulic conductivity was initially calculated.
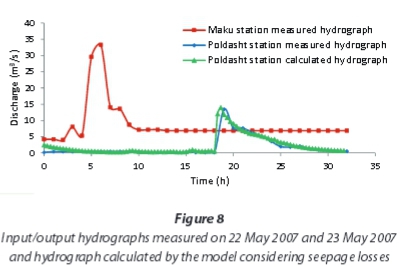
Due to the length of the river it is difficult to determine the river bed's hydraulic conductivity with field methods; therefore, this task was performed as follows: Primarily, Maku hydrometric station's flood-measured hydrographs on 22 May 2007 and 23 May 2007 and the stage-discharge relationship from Poldasht hydro-etric station on the same date were respectively introduced as upstream and downstream boundary conditions. Subsequently, the model was run with a 25-s time step and θ = 0.75 for various permeabilities. Ultimately, the average value of the river bed permeability coefficient k= 4.8 x 10⁻⁶ (m/s) was calculated.
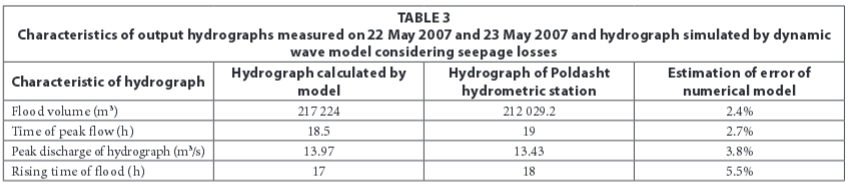
Flood routing for measured hydrographs on 22 May 2007 and 23 May 2007, considering seepage losses and the mentioned permeability coefficient, are shown in Fig. 8 and Table 3. It is indicated that the flood-routing process, with modified Saint-Venant equations considering the seepage losses, completely matches the measured data. Therefore, the model predicts the hydrograph's peak time, peak discharge and flood volume, measured at Poldasht station, with high precision. Also the estimated and measured transmission losses are 782 784 and 788 004 m3, respectively, which shows that the model's estimation is only 0.6% lower than the field measurements.
Estimation of average seepage losses
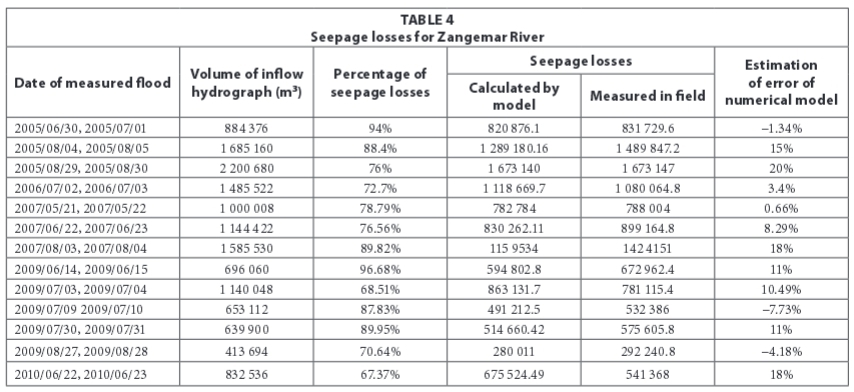
The calibrated riverbed permeability (k = 4.8 x 10⁻⁶ (m/s)) with time step = 25 s, θ = 0.75 and 13 hydrographs from 2005 to 2010 were used to verify the model and calculate the average seepage losses. The seepage losses were determined by subtracting the output hydrograph volume from the input hydrograph volume and then comparing this with the measured losses. The results are shown in Table 4.
Table 4 indicates that the average seepage losses in the river are about 74% of the input hydrograph's volume. Moreover, it can be seen that the model predicts seepage losses with an average error of about 9.93%; however, the maximum error is less than 20%. These differences can be due to the following reasons:
• Flow assumptions in Saint-Venant equations, particularly in rivers with high slopes: One-dimensional modelling is only appropriate for modelling well-defined and constant flow paths; the model cannot match the flexibility of two-or three-dimensional modelling necessary for representing complex channel/floodplain interactions. Also, many numerical models assume that the channel slope is less than 1:10, therefore the sine and cosine of the channel slope can be assumed to be equal to zero and unity, respectively. This allows numerous geometric implications to be ignored; was the cross-section originally defined vertically or perpendicular to the invert, and are the water-level results projected vertically or perpendicular to the invert (Toombes and Chanson, 2011)?
• Selecting a constant value for Manning's roughness in each cross-section while flow depth and velocity vary with the changes in input discharge: The numerical models are very sensitive to the nm-value. Fathi-Moghadam et al. (2011) showed that the nm-value varies considerably with flow depth and velocity. Also the experimental results of Wang et al. (2011) showed gravel-bed channel roughness has significant effects on flow structure and the mean velocity distribution.
• Estimation of permeability coefficient (k)and using semi-empirical equations to estimate seepage losses: Many parameters affect the permeability coefficient. In the present study only an average permeability coefficient along 62 km of the river reach has been calibrated. Determining the permeability coefficient along the studied reach using field and laboratory methods should be useful to enhance the model's accuracy, although costly and time consuming.
• Neglecting the changes in riverbed permeability and river cross-section geometry over time: Time-dependent erosion and sedimentation along the river reach can change the cross-section geometry, river morphology and riverbed material gradation. Therefore the riverbed permeability changes and is not constant.
CONCLUSIONS
In order to estimate transmission losses in Zangemar, an ephemeral river, a 1-D computer model was developed in which the unsteady flow equations (Saint-Venant equation) are coupled with Muskat's equation to estimate the seepage losses. A trapezoidal shape hydrograph with a long period of steady-state flow and 522 cross-sections of Zangemar River were used to determine the model's accuracy and its capability in satisfying the continuity equation.
The analysis showed that Muskat's equation is able to predict seepage losses realistically. Considering seepage losses, the flood routing model's outputs were in agreement with the practical field measurements. The results of flood routing for 13 input hydrographs revealed that the seepage losses in the river reach are, on average, about 74% of the input hydrograph's volume. The developed computer model predicts seepage losses with a mean error of about 9.93%. Also, the transmission losses in the practical field measurements and model, using Muskat's equation, are 788 004 and 782 784 m3, respectively, which shows that the model's estimate is only 0.6% lower than the field measurements.
REFERENCES
AL FARUQUE MA and BALACHANDAR R (2013) Study the effect of seepage on the higher order moment to extract information about the turbulent flow structure in an open channel flow. 5th BSME International Conference on Thermal Engineering. Procedia Eng. 56 263-268. [ Links ]
BATLLE-AGUILAR J and COOK PG (2012) Transient infiltration from ephemeral streams: A field experiment at the reach scale. Water Resour. Res. 48 (11) 1-12. [ Links ]
BOROTO RAJ and GÖRGENS AHM (2003) Estimating transmission losses along the Limpopo River - an overview of alternative methods. In: Hydrology of the Mediterranean and Semiarid Regions. IAHS Publ. No. 278. 138-143. [ Links ]
CATALDO J, BEHR C, MONTALTO F and PIERCE RJ (2005) An Analysis of transmission losses in ephemeral streams: A case study in Walnut Gulch Experimental Watershed, Tombstone, AZ. A report for the National Center for Housing and the Environment, Wetland Science Applications, Poolesville, USA. 41 pp. [ Links ]
COSTA A, BRONSTERT A and DE ARAÚJO J (2012) A channel transmission losses model for different dryland rivers. Hydrol.Earth Syst. Sci. 16 1111-1135. [ Links ]
DE VRIES J and SIMMERS I (2002) Ground water recharge: an overview of process and challenges. Hydrogeol. J. 10 5-17. [ Links ]
FATHI-MOGHADAM M, KASHEFIPOUR M, EBRAHIMI N and EMAMGHOLIZADEH S (2011) Physical and numerical modeling of submerged vegetation roughness in rivers and flood plains. J. Hydrol. Eng. 16 (11) 858-864. [ Links ]
FOTUHI M and HOSSEINI SM (2007) Analyzing sensitivity of parameters of flood routing and seepage losses in arid region rivers. Iran. J. Watershed Eng.Sci. 1 (1) 12-23. [ Links ]
GHOBADIAN R (2011) Estimation of seepage losses in an ephemeral multibranched stream by simultaneously solving for seepage and unsteady flow. In: Proceedings 3rdInternational Conference on Managing Rivers in the 21" Century: Sustainable Solutions for Global Crisis of Flooding, Pollution and Water Scarcity, 8 June 2011, Malaysia. [ Links ]
GHOBADIAN R (2011) Flood routing and estimation of transmission losses in ephemeral streams by simultaneity solution of unsteady flow equations and infiltration. Iran. J. Soil Water 25 (2) 25-33. [ Links ]
GHOBADIAN R and FATHI-MOGHADAM M (2014) Estimation of seepage losses in ephemeral network and branching streams. J. Hydrol. Eng. 19 (2) 299-307. doi:10.1061/(ASCE)HF.1943-5584.0000788 [ Links ]
JOSEPH C, CHRISTOPHER B, FRANCO M and ROBERT JP (2004) A summary of published reports of transmission losses in ephemeral streams in the U.S.A. Report to the National Center for Housing and the Environment, West New York. 42 pp. [ Links ]
KNIGHTON AD and NANSON GC (1994) Flow transmission along an arid zone anastomosing river, Copper Creek, Austoralia. Hydrol. Process. 8 137-154. [ Links ]
LANGE J (2005) Dynamics of Transmission Losses in a large arid Stream Channel. J. Hydrol. 306 112-126. [ Links ]
LANE LJ, FERREIRA VJ and SHIRLEY ED (1980) Estimating transmission losses in ephemeral stream channels: Hydrology and water resources in Arizona and the South West.In: Proceedings 1980 meeting Arizona Section, A.W.R.A. and Hydrology Section Arizona Nevada Academy of Science. 193-202. [ Links ]
LIU G, CRAIG JR and SOULIS ED (2011) Applicability of the Green-Ampt infiltration model with shallow boundary conditions. J. Hydrol. Eng. 16 (3) 266-273. [ Links ]
TEWOLDE MH and SMITHERS JC (2006) Flood routing in ungauged catchments using Muskingum methods. Water SA 32 (3) 379-388. [ Links ]
TOOMBES L and CHANSON H (2011) Numerical limitations of hydraulic models. In: Proceedings 10th Hydraulics Conference, 26 June to 1 July 2011, Brisbane, Australia. 2322-2329. [ Links ]
SHANAFIELD M and COOK PG (2014) Transmission losses, infiltration and groundwater recharge through ephemeral and intermittent streambeds: A review of applied methods. J. Hydrol. DOI:http://dx.doi.org/10.1016/j.jhydrol.2014.01.068. [ Links ]
SHANAFIELD M, NISWONGER RG, PRUDIC DE, POHLL G, SUSFALK R and PANDAY S (2014) A method for estimating spatially-variable seepage and hydraulic conductivity in channels with very mild slopes. Hydrol. Process. 28 (1) 51-61. [ Links ]
VIVARELLI R and PERERA BJC (2002) Transmission losses in natural rivers and streams - a review. In: Proceedings 2002 River Symposium, 3-6 September 2002, Brisbane. [ Links ]
WALTER GR, NECSOIU M and MCGINNIS R (2012) Estimating aquifer channel recharge using optical data interpretation. Ground Water 50 (1) 68-76. [ Links ]
WANG X, SUN Y, LU W and WANG X (2011) Experimental study of the effects of roughness on the flow structure in a gravel-bed channel using particle image velocimetry. J. Hydrol. Eng. 16 (9) 710-716. [ Links ]
ZARGAR M and SALEHINEISHABOURI SA (2009) A Comparison of MIKE11 & SMS model for modelling of the advection-diffusion in rivers. 8thInternational Congress on Civil Engineering, 11-13 May 2009, Shiraz. Iran. [ Links ]
Received 30 June 2013
Accepted in revised form 3 June 2015
* To whom all correspondence should be addressed. +989188332489; e-mail: Rsghobadian@gmail.com

