


Servicios Personalizados
Articulo
 Inglés (pdf)
 Articulo en XML
 Referencias del artículo
Indicadores

Links relacionados
-
 Citado por Google
 -
 Similares en Google
Compartir

 Permalink
Water SA
versión On-line ISSN 1816-7950
versión impresa ISSN 0378-4738
Water SA vol.41 no.4 Pretoria jul. 2015
http://dx.doi.org/10.4314/WSA.V41I4.01
ARTICLES
Impacts of fish on phosphorus budget dynamics of some SA reservoirs: Evaluating prospects of 'bottom up' phosphorus reduction in eutrophic systems through fish removal (biomanipulation)
RC HartI, *; WR HardingII
ISchool of Life Sciences (Pietermaritzburg Campus), University of KwaZulu-Natal, Private Bag X01, Scottsville, 3201, South Africa
IIDH Environmental Consulting (Pty) Ltd, Somerset West, South Africa
ABSTRACT
Data on fish standing stocks in 7 South African reservoirs were used to assess prospects of reducing in-lake amounts of total phosphorus (TP) through remedial biomanipulation - the removal of fish to deplete internal stocks of biomass-incorporated TP and especially to restrict enhancement of TP availability through internal 'bottom up' recycling by fish. Literature-derived conversion functions were used to estimate the quantity of TP stored in fish biomass, recycled by fish through excretion, and released from bottom sediments through carp and catfish bioturbation. This provided a quasi mass-balance assessment of these contributory influences of fish on TP budgets of reservoirs ranging from mesotrophy to hypertrophy in trophic status (annual mean TP levels of 0.04-0.51 mg/l). Absolute contributions of fish were inevitably related directly to reservoir-specific fish stock abundance, both total-fish and coarse-fish biomass levels which increased with trophic status, generating parallel absolute increases in TP sinks and internal TP loading fluxes. On overall average, total fish stock sequestered 2.2 kg TP/ha in biomass, recycled 13.8 kg TP/ha/yr through excretion, and mobilized 8.0 kg TP/ha/yr through sediment bioturbation. Average values relative to external loadings in 5 reservoirs amounted to 3.8% (biomass), 22.8% (excretion) and 11.8% (bioturbation), totalling 38.4%. Most pertinently, the relative importance of fish in reservoir TP budgets declined progressively with rising trophic status, with corresponding averages less than half (1.4, 8.7 and 5.4%, total = 15.4%) in 3 hypertrophic reservoirs (> 0.10 mg TP/ℓ). While total fish eradication plausibly reduces average internal phosphorus by some 40% relative to external load, the corresponding average reduction in hypertrophic reservoirs in greatest need of nutrient reduction is far less (~ 15%). 'Bottom-up' bioremediation accordingly offers little help in the management of nutrient-enriched reservoirs, and is essentially futile where high external nutrient loading persists.
Keywords: biomanipulation, biomass sinks, bioturbation, eutrophication management, excretion, fish, phosphorus, recycling, reservoir ecosystems
INTRODUCTION
All living organisms obviously contain biomass-incorporated nutrients that collectively constitute internal nutrient pools (within-ecosystem sinks). Furthermore, life depends upon various physiological processes that drive continuous metabolic recycling of nutrients derived from food consumption or extracted from the ambient environment. Unless physically or biotically translocated, biomass-stored nutrients return to the source environment following death and decomposition. In aquatic ecosystems subjected to nutrient enrichment (eutrophication), reduction or removal ('harvesting') of biota to reduce internal biotic nutrient pools and accompanying nutrient recycling is widely advocated as a strategy to ameliorate afflicted systems. Harvesting of animal rather than plant biomass is favoured by the considerably higher specific nutrient content of the former (e.g., Vanni et al., 2013). Fish are particularly targeted, on account both of their often sizeable contributions to total biomass and the practical feasibility of their removal (unlike microscopic plankton) (e.g., Lammens, 1999; S0ndergaard et al., 2008). However, while macrobiota like fish can comprise a large internal nutrient pool often serving as a nutrient 'sink' (Vanni et al., 2013), their role in recycling of internal nutrients is relatively small on account of comparatively slow biomass turnover times - for example, 367 vs. 3.2 days for fish and phytoplankton, respectively (Griffiths, 2006). Consequently, more effective reductions of nutrient availability in eutrophic systems plausibly favour the 'protection' rather than removal of fish to allow sequestration of internal nutrients into biomass of macrobiota rather than microphytic organisms (Reynolds, 2003; Griffiths, 2006).
Eutrophication is rated as the greatest threat to freshwater and coastal marine ecosystems globally (Smith and Schindler, 2009), on account of its well-known adverse impacts on aquatic ecosystem structure and functioning. For phosphorus, assimilable loading thresholds have been exceeded for many global water resources (WWF, 2014). In South African inland waters, nutrient enrichment is widespread and severe (e.g., DWA, 2013; Matthews, 2014; Matthews and Bernard, 2015; Harding, 2015). Much of the total volume of reservoir-stored freshwater is eutrophic (with annual median in-lake concentrations of 0.035-0.100 mg/ℓ TP) or hypertrophic (> 0.100 mg/l TP). Estimates of the volume affected range from 41% (based on 'spot' grab sampling) to 76% (derived from more realistic synoptic remote sensing), with the higher value considered more accurate (Harding, 2015). To achieve preferable but still suboptimal mesotrophic conditions (< 0.035 mg TP/ℓ), phosphorus load reductions of the order of 80% are required (Harding, 2008). In reality, however, restrictions on phosphorus discharge in wastewater (the dominant source of TP) are increasingly ineffectual, while discharge requirement standards are insufficiently stringent, with lax and lenient enforcement. Declining 'preventative' control has generated interest in 'curative' in-lake options to reduce in-lake phosphorus levels and the resulting impacts of eutrophication on reservoir ecosystem health and concomitant human health threats arising from their use as a primary source of potable water (e.g., Harding and Paxton, 2001; Harding et al., 2009; Van Ginkel, 2011; Harding, 2015).
On this basis, recent eutrophication management endeavours in South Africa, notably within the multi-pronged Hartbeespoort Dam Bioremediation Programme (HDBP) that commenced in 2008 (DWA, 2012; Venter, 2012a), incorporate an explicit 'biomass harvesting' thrust - removal of floating hydrophytes (water hyacinth - Eichhornia crassipes) and 'algae' (especially surface scums of the cyanobacterium Microcystis aeruginosa) (Croucamp and Venter, 2012). It is also a tacit consequence of the 'food-web restructuring thrust', designed to effect 'restructuring of the fish population ... to achieve a balanced ecosystem' through removal of fish taxa 'responsible for the re-suspension of nutrients into the water column due to their benthic (bottom) feeding behaviour' (Venter et al., 2012 p. 31). Reduction of 'coarse' fish (common carp - Cyprinus carpio, sharptooth catfish - Clarias gariepinus and canary kurper -Chetia flaviventralis) was expected to result in 'rehabilitated biotic assemblages', able to achieve 'efficient nutrient and energy flow throughout the food web' (with no mechanistic basis being elaborated).
Food-web management (biomanipulation) is well-known as a prospective remedial tool to ameliorate in-lake impacts of eutrophication, relying on one or both of two mechanisms: first, 'top-down' enhancement of predatory interactions to maximize grazing pressure on and thereby reduce the biomass of autotrophs stimulated by nutrient enrichment; and second, 'bottom-up' resource-based interventions to reduce biotic recycling of internal nutrients (see Hansson et al., 1998; Horppila et al., 1998; Mehner et al., 2002; Hodgson, 2005 - among many). The mechanistic suitability of 'top-down' biomanipulation in South African reservoirs was critically evaluated (Hart, 2006) and empirically negated on several grounds (Hart, 2011; 2012; Harding and Hart, 2013). A parallel mechanistic consideration of 'bottom-up' management through biomass harvesting (specifically and exclusively of fish) is provided here to evaluate its prospective utility in eutrophic reservoir management.
Logical justification for harvesting rests on the quantity of nutrients 'locked' in internal biomass pools (sinks) and internally recycled by organisms, especially relative to amounts received from external sources. This consideration is especially important for reservoir ecosystems that typically receive high external nutrient loads from large volumes of water carried by influent rivers draining relatively large catchment areas and/or highly urbanized watersheds; short hydraulic retention times (i.e. rapid flushing by inflows large relative to storage capacity) further exacerbate the external loading problem. The role and importance of fish in the phosphorus budget dynamics of some SA reservoirs is accordingly assessed here in regard to 3 questions: (i) How much phosphorus is stored in fish biomass? (ii) How much phosphorus is excreted by fish? (iii) How much sediment-associated phosphorus is re-suspended through fish bioturbation? These questions are considered in relation both to crude estimates of total internal TP pool size in 7 reservoirs, and relative to external TP loads in 5 reservoirs for which suitable data exist. We assess the potential consequences of hypothetical total fish removal on within-reservoir TP pool size and availability, and thereby its efficacy as a nutrient-reduction strategy to counter/offset the growing eutrophication problem in SA reservoir ecosystems. 'Nutrient' is used generically, but generally implies phosphorus (P), although other nutrients - particularly nitrogen (N) - may be equally or more important than P as a limiting nutrient in low latitude warm-water systems, and eutrophic systems in general - especially where ambient N:P ratios are distorted by N-fixing cyanobacteria (e.g., Kalff, 2002).
MATERIALS AND METHODS
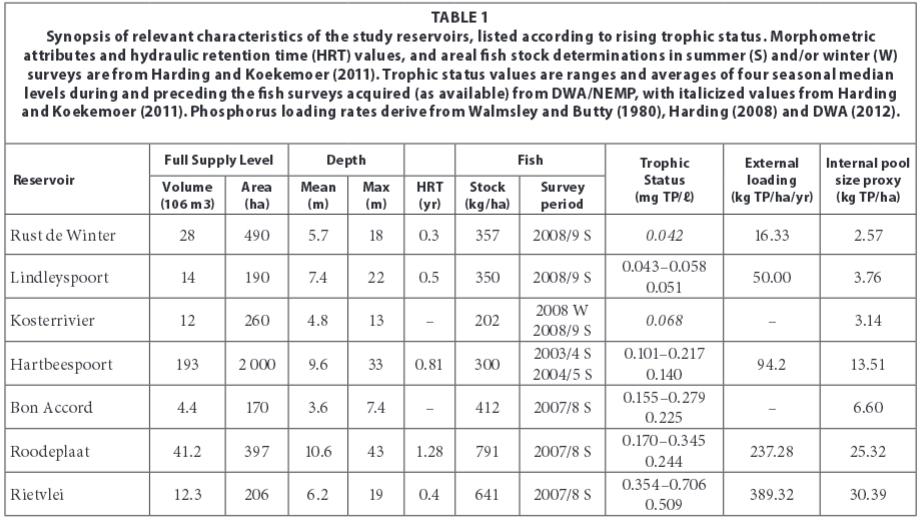
This analysis is based on twice-yearly fish stock determinations using a consistent gill-net sampling and analysis protocol (Harding and Koekemoer, 2011) in 7 reservoirs (in Gauteng, North West and Limpopo provinces) varying in nutrient enrichment level (Table 1). Fish stock levels are examined in relation to reservoir 'trophic status' (TS) level, classed on TP values (the combined average of 4 median seasonal TP values reported by the National Eutrophication Monitoring Programme (NEMP; DWA, 2014) for corresponding summer and winter periods during and preceding the fish surveys (see Table 1). As the NEMP database excludes Rust de Winter and Kosterrivier Dams, values given by Harding and Koekemoer (2011) were used. Time-averaged TP values were used for TS classification to cater for the reality that fish biomass is a cumulative outcome reflecting trophic conditions over time, rather than an instantaneous result of contemporaneous nutrient levels. TS classification was based on defined standard criteria of TP content (OECD, 2002) to ensure international consistency (Harding, 2015).
Temporally comparable annual areal TP loading rate values were available for only 2 reservoirs - direct measurements for Hartbeespoort (DWA, 2012) and modelling predictions for Roodeplaat (Harding, 2008). Loading rates for 3 other reservoirs were derived from 'historical' analyses (Walmsley and Butty, 1980), uniformly inflated by 160% to approximate known time-related increases for Roodeplaat (the only system with comparative historical and recent data). Determinations only possible for or relevant to these 5 reservoirs are subsequently identified as 'subset' values. With the uncertainty in external loading rate values, and their absence for 2 reservoirs, a proxy of loading rate for all 7 reservoirs was calculated using the classic Vollenweider principle (OECD, 1982) of loading rate vs. in-lake concentration. This crude proxy - total pool size of in-lake TP, was approximated as the product of full supply volume and TP concentration in near-surface water, generally the 0-5 m layer (Table 1). Resulting pool size estimates are certainly very conservative, being based on almost invariably lower concentrations of TP in surface waters than the entire water column, and disregarding both the dilution effects of flushing and the often large 'losses' of internal TP through sedimentation (e.g. estimated accumulated total of ~ 2 000 t over 85 years in Hartbeespoort or ≅ 12 kg/ha/yr (Cukic and Venter, 2012)). Nevertheless, they provide a uniform comparative index for all reservoirs.
Reported values of TP content of fish biomass vary roughly 2-fold (1.5 to 3.38% of total dry weight (DW)) according to fish taxon, ontogeny, food type, and food nutrient stoichiometry, etc. (Gehrke and Harris, 1994; Vanni, 2002; Torres and Vanni, 2007; McManamay et al., 2011). The TP content of SA reservoir fish stocks was calculated as a standard 2.3% of fish DW (Cyr and Peters, 1996; Griffiths, 2006), 'generously' assuming DW as 22% of wet weight (WW) (Cyr and Peters, 1996) rather than only 16.7% (Gehrke and Harris, 1994).
Although published rates of fish P excretion vary widely, between 81.4 and 181.0 g P/kg DW fish/yr (Torres and Vanni, 2007; McManamay et al., 2011, respectively), a definitive assessment by Griffiths (2006) revealed an almost direct relationship between excretion and fish biomass (see Fig. 2 - Griffiths (2006)), regardless of differences in mean body mass, species composition and diet of fish in lakes spanning a wide productivity range of ~ 0.05 to 0.25 mg/ℓ TP. Excretion rates were accordingly calculated for total stocks of reservoir fish using the regression relationship for that data (Griffiths, 2014):

log10Excretion = - 1.353 + 1.108 log10Fish Biomass
where:
Excretion = g TP/ha/day and Fish Biomass = kg/ha WW).
Contrary to the general decline in mass-specific metabolic rate with body size (Peters, 1984), the slope of this regression exceeds unity. Predicted excretion values increase disproportionately with rising biomass (e.g. from 266 g TP/kg fish/yr at 100 kg fish/ ha to 341.4 g TP/kg fish/yr at 1000 kg fish/ha), exaggerating excretion values in reservoirs carrying larger fish-stocks.
Sediment re-suspension was calculated using a rate of '33 kg/ha/d/100 kg carp/ha' (Akhurst et al., 2012 - p 220) (≡ 0.33 kg sediment DW/kg carp WW/d, or 390% body mass/d as WW) derived from mesocosm studies of carp in Australia. This value was applied directly to carp stocks in SA reservoirs, but reduced to 0.18 kg/kg/d for catfish - based on their 54% lower reliance on benthic food resources than carp (Ashton et al., 1985). Bioavailable-P content of sediment was set constant at 0.5 g TP/kg DW sediment - higher than algal-available (AA) sediment P levels of 0.36 and 0.3 g AAP/kg DW in the eutrophic Hartbeespoort and Roodeplaat reservoirs in 1979 (Grobler and Davies, 1981) and that of 0.44 g TP/kg (incorrectly reported as mg/kg) for the most enriched sediments in Hartbeespoort Dam in 2003 (Harding et al., 2004). Sediment bioturbation coefficients derived from the above values (0.33*0.5*365 = 60.23 g TP/kg carp/yr and 0.18*0.05*365 = 26.9 g TP/kg catfish/yr; NB - g TP, not kg) were used to calculate TP bioturbation in all study reservoirs, ignoring likely system-specific differences. Resulting calculations probably overestimate bioturbation in the study reservoirs (see Discussion).
The inter-relationships of dependent variables with trophic status were examined using various regression models; the best-fitting model (invariably a polynomial or power function) was tested for statistical significance at the 95% level or above (p < 0.05). Low sample size inevitably limited the number of cases meeting this criterion. Where appropriate, a distinction is made between overall values derived for all 7 reservoirs and 'subset' values derived for 5 (explained above).
RESULTS
General
Morphometric and general attributes of the study reservoirs given in Table 1 are self-explanatory. In-lake TP concentration - used here as the direct proxy measure of reservoir 'trophic status'- was strongly correlated with corresponding external TP loading (r2= 0.985, p < 0.002) in the 5 'subset reservoirs'. This relationship is contextually pertinent to various data considerations and interpretations that follow.
Fish biomass and associated internal storage sinks of phosphorus
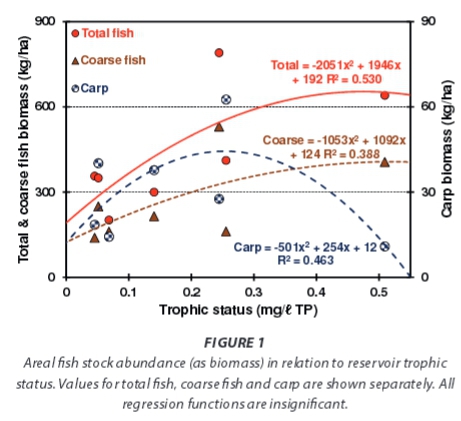
Total areal standing stock biomass levels of fish (i.e. all taxa totals) increased with reservoir trophic status (Fig. 1), as did that of its component coarse taxa (catfish and carp together) -despite a contrasting response in the small overall average carp fraction (11.4%). Corresponding changes in TP pools stored in fish biomass were inevitably parallel (Fig. 2). Biomass-stored TP pools increased with rising trophic status (Fig. 2), but averaged only 2.21 kg TP/ha overall. In relative or fractional terms - the corresponding subset average (2.47 kg TP/ha) equates to 3.7% of external load inputs - clearly indicating that fish biomass is unimportant as a TP storage compartment. External inputs potentially suffice to replenish this storage pool ~27 times per annum. The decline in relative values with rising trophic status (Fig. 2), although exaggerated by a high value of in the least-enriched reservoir (which also inflates the average), is fundamentally important. In hypertrophic reservoirs, TP stored in fish biomass averaged only 1.4% of external TP inputs.
Internal phosphorus recycling/regeneration through fish excretion
Annual excretion of TP by fish rose with reservoir nutrient status (Fig. 3) - an inevitable consequence of the underlying increase in fish biomass (Fig. 1), resulting in sizeable internal TP loadings - 13.8 kg TP/ha/yr on overall average. The subset average (15.5 kg TP/ha/yr) was equivalent to 22.8% of external TP loads reaching the reservoirs. However, as both averages are strongly inflated by the high value of 66.8% in the least-enriched Rust de Winter Dam, the corresponding lower (overall and subset) median statistic of 11.1% is plausibly more representative for this assessment. The relative importance of excretion as an internal TP source declined significantly with rising reservoir trophic status (Fig. 3), amounting to merely 8.7% of external nutrient loading in hypertrophic reservoirs.

Internal phosphorus loading associated with sediment bioturbation by carp and catfish
Sediment bioturbation by catfish averaged 6.2 kg TP/ha/yr overall - resulting in sizeable translocations of TP from bottom deposits. Absolute values rose with reservoir trophic status (Fig. 4) in line with corresponding increases in fish abundance (Fig. 1), with catfish biomass comprising 52% of total fish stock and 83% of coarse fish stock on average across all reservoirs.

Bioturbation by carp released considerably less TP from bottom sediments (1.83 kg TP/ha/yr on overall average - Fig. 4), in keeping with corresponding lower average abundance levels -30.3 kg/ha carp vs. 230.3 kg/ha catfish. Contrary to the general increase in contributions of fish to TP compartment size with rising trophic status evident in biomass sinks (Fig. 2), excretory releases (Fig. 3) and catfish bioturbation (Fig. 4), carp bioturba-tion changed unimodally (Fig. 4) - consistent with the underlying difference between changes in carp stock and total fish stock with trophic status (Fig. 1). However, low carp abundance trivializes this discrepancy.
As with biomass and excretion, the relative importance of sediment bioturbation as a potential internal TP source declined significantly with rising nutrient status (Fig. 4). It averaged 11.8% overall, but was limited to 5.4% of external load inputs in hypertrophic reservoirs.
Contributions of fish to internal phosphorus budgets, relative to external TP inputs
A synoptic summary of contributions by fish to within-reser-voir phosphorus budgets, relative to corresponding external TP loading inputs, shows exponential declines (significant negative power regressions) of all contributory influences (biomass storage, excretion and bioturbation) with rising trophic status (Fig. 5). Total fish removal is equivalent to reducing external TP inputs by 38.3% on average - a statistic certainly inflated by high values for one low trophic status system. The corresponding median value of 19.1% is transparently more realistic, and accords with case data for reservoirs with internal TP concentrations > 0.10 mg/ℓ (see Fig. 5). In these hypertrophic systems, external TP inputs are at least 5-fold greater than the collective internal contributions made by fish.

Proportional significance of fish relative to total within-reservoir phosphorus stocks
Based on the crude estimate of total within-reservoir TP stock as a 'proxy' of external loading, a consistent decline in fish-related contributions with rising trophic status was evident across all 7 reservoirs (Fig. 6) - mirroring the pattern shown in Fig. 5. Although absolute values of these fraction al contributions to internal lake pool sizes are ~10-fold greater than the corresponding relative contributions to external loading rates (averages of 31.3 vs. 3.7% for biomass, 189.4 vs. 22.8% for excretion, and 111.1 vs. 11.8% for sediment mobilization), the disparity is considered an artefact of under-estimating total internal pool size (see Methods).

DISCUSSION
Animals generally have strong effects on nutrient cycling in freshwater ecosystems, although this is not inevitable (Vanni, 2002). The present study shows that the influence of fish on reservoir TP budgets was limited. The unambiguous general decline in the relative contribution of fish to reservoir TP budgets with rising trophic status is directly and fundamentally significant and highly relevant to reservoir management. However, various limitations and deficiencies in the underlying data that inevitably temper the certainty of this assessment merit consideration. Annual fluctuations in external loading inputs and the reliability of loading rate values are particularly pertinent in this regard. In-lake TP concentration - the basis of trophic status evaluation- is directly determined by annual external TP loading (r2 = 0.985, p < 0.002), known to vary widely from year to year. A simulation analysis of the most consistent and extensive data-set available - that for Hartbeespoort Dam - helps to examine the consequences of this variability on the credibility of present evaluations of the role of fish in nutrient budgets: does it negate our overall conclusion regarding their 'marginal' impact?
Between 1999/2000 and 2010/2011, total annual external TP loads to this reservoir ranged from 92.3 to 650.3 t, load retention varied between 44.3 and 82.7%, and average in-lake concentrations of TP varied from 0.104 to 0.615 mg/ℓ (DWA, 2012); direct inter-correlation between these parameters was weaker than anticipated. Simplistically assuming a static fish stock of 300 kg/ha (see Table 1), the hypothetical median percentile contributions (and ranges) of fish relative to corresponding annual external TP loads over the decade amounted to 0.9% (0.5-3.3) for biomass, 5.2% (2.8-19.5) for excretion, and 3.8% (2.0-14.3) for bioturbation, and 9.9% (5.3-37.0) in total.
Fish contributions to the TP budget thus amount to ~10% (the cumulative median) of external inputs. While more accurate and temporally contemporaneous data will undoubtedly result in different absolute values regarding the contributions of fish to reservoir TP budgets, our general overall conclusion that fish play a marginal role in the phosphorus dynamics of these reservoirs is unlikely to be invalidated.
This conclusion accords exactly with Griffiths' (2006) substantiated generalization that fish play a minor role in internal nutrient recycling of P in lakes, certainly a minor role compared to that played by metabolically more active plankton (e.g., Hudson et al., 1999). The general validity of Griffith's (2006) posit is realistically pertinent and undoubtedly even more certain in river-reservoirs than natural lakes, on account of the former's substantially greater nutrient loadings derived from 10- to 100-fold greater drainage basins and shorter hydraulic retention times that ensure faster renewal of water-borne nutrient inputs (Wetzel, 2001). In any case, fish merely serve as sinks and recycling agents of existing internal nutrient pools; they cannot generate genuinely 'new' additional nutrient inputs - a fundamental reality that cannot be over-emphasized. Deliberations on the role of fish in providing 'new' inputs (Schaus and Vanni, 2000; Vanni, 2002; Nowlin et al., 2005) simply relate to vertical and/or horizontal translocations of nutrient between different within-lake habitats or communities - most notably between benthic and pelagic compartments, but also fringing littoral zones (as explicitly or tacitly acknowledged by the deliberators). Bioturbation is likely the most significant influence of fish, in so far as it enables the re-introduction of existing historically-accumulated stocks of P 'lost' through sediment deposition.
Many SA reservoirs, including several in the present subset (see Table 1), are deep enough to stratify strongly and often develop hypoxic or even anoxic hypolimnia (Walmsley and Butty, 1980), with consequent influences on bioavailability of both excreted and sediment-derived phosphorus. The complex redox- and pH-sensitive chemistry of phosphorus, linked to ambient dissolved oxygen level, pH, and availability of various metal ions such as hydrated ferric oxides, is well-known. Adámek and Marsálek (2013) found that phosphorus releases from pond sediments through bioturbation did not relate directly to the amount of sediment disturbed, specifically on account of differences in phosphorus sorption at the sediment-water interface resulting from such chemical reactions. Likewise, despite often large quantities of SRP released from anaerobic sediments in deep stratified systems, little may reach the epilimnion (Nowlin et al., 2005) to stimulate euphotic zone primary production.
In the reservoirs considered here, sediment bioturbation by carp and catfish collectively ranged from 13.2 to 30.1 tons sediment DW/ha/yr, mobilizing an estimated 6.6 to 15.0 kg TP/ha/ yr. Even these low values are plausibly over-estimates. The rate used here to calculate sediment processing values - 390% body mass/d (cf. 230% by carp at 100 kg/ha - Breukelaar et al., 1994) - derives from back-calculation of results measured in experimental mesocosms (depth = 1 m, volume = 3.2 m3) stocked with carp at 1 875 kg/ha, i.e., 0.1875 kg carp/m2 (Akhurst et al., 2012). At this concentration, repetitive sediment 'reworking' (bioturbation) by carp would be required to meet ongoing daily food requirements of between 3% (Bajer and Sorensen, 2014) and 5% (Zambrano et al., 2001) of body mass, almost irrespective of starting levels of food in enclosure sediments. Quantities of suspended food resources available as possible dietary supplements in the overlying water column would be depth-limited in 1 m deep mesocosms, likely compounding this need. Such experimental artefacts collectively inflate apparent bioturbation rates and resulting predicted values. The bioturbation levels calculated here are likely to be exaggerated considerably by the reduction of all 'concentration' artefacts. Lower stocks (140 to 526 kg/ha carp and catfish vs. 1875 kg/ha carp) of free-ranging fish are able to search continuously for, and exploit most profitable 'new pastures', obviating the need for repetitive sediment winnowing - especially where benthic food resouces are rich. In Hartbeespoort, the only reservoir with relevant data, zoob-enthos abundance was notably high - 3.1 g DW/m2, some 155 kg WW/ha (Ashton et al., 1985). In all study reservoirs, alternative or supplementary suspended food resources are accessible from greater volumes of water (mean depth 3.6 to 10.6, average = 6.6 m vs. 1 m). Such factors are incorporated in the concept (considered below) of a catastrophic 'threshold level' for carp (Zambrano et al., 2001).
Common carp are notorious for uprooting hydrophytes and re-suspending sediment, and consequent adverse changes in water clarity and water quality (e.g. Zambrano et al., 2001) directly attributable to their bottom-grubbing feeding behaviour. However, negative impacts are neither linearly related to carp biomass (Zambrano et al., 2001) nor inevitably great. For example, Bajer and Sorenson (2014) found that neither bioturbation nor excretion by carp, at 300 kg/ha, contributed significantly to the phosphorus budget of a stratified eutrophic lake. Furthermore, their experimental reduction of carp from 300 to 40 kg/ha had no discernible effect on TP levels in the water column, negating the anticipated role of carp in nutrient transport from benthic sediments (Bajer and Sorenson, 2014). Likewise, little of the variation in water quality attributes measured in experimental mesocosms in Australian billabongs was attributable to carp (King et al., 1997; Robertson et al., 1997), although converse evidence exists (e.g. Akhurst et al., 2012).
Excretion accounted for the largest contribution by fish to TP budget dynamics of our study reservoirs, recycling an (inflated) average of 13.8 kg TP/ha/yr - 22.8% of corresponding external TP loading. By contrast, TP excretion by a fish stock of 1 200 kg/ha (about 3-fold higher than the average in our study reservoirs - 436 kg/ha) in the large Lake Texoma was considered to be 'of little importance' when external nutrient loading from tributary inflows exceeded 0.06 kg TP/ha/day - effectively some 60% of the study period (Gido, 2002). The annualized external loading rate of Lake Texoma (21.9 kg TP/ha) is only 14% of the average loading rate for 5 SA reservoirs considered here (157.4 kg TP/ha). Contradictory interpretations of the relative contributory roles of fish excretion arising from these data remain irreconcilable.
Carp removal potentially benefits the restoration of mac-rophyte communities in inshore littoral zones of stratified eutrophic lakes (Bajer and Sorensen, 2014) but may be effective only when initial carp stock is high - in excess of 300 kg/ ha. Below 100 kg/ha, carp damage to macrophytes was relatively slight (Bajer et al., 2009), affirming an earlier conclusion (Zambrano et al., 2001) that catastrophic effects arise only above a threshold biomass level. Carp biomass in our study reservoirs was low (14.3 to 62.6 kg/ha) - on average (30.3 kg/ha) less than a third of the suggested threshold level for potential damage (100 kg/ha) proposed by Bajer et al. (2009).
In most SA reservoirs, habitat area suitable for rooted macrophytes is constrained by fluctuations in water level that accompany natural seasonal draw-downs and/or controlled water releases: Macrophyte stands are alternately stranded dry, or drowned when water exceeds euphotic-zone depth; hypsographic (depth-area) features further constrain the areal extent of suitable habitat independently of water-level changes in many reservoirs. Purported and possibly specious improvements in water quality, such as increased dominance of the benthic green filamentous alga Spirogyra in the littoral zone following food-web management (Koekemoer et al., 2012; Venter et al., 2102), are accordingly spatially constrained, benefitting only a relatively minor fraction of reservoir-stored water. Improvements to the major volumes of water stored in open-water offshore reaches clearly require directed interventions other than fish removal. Indeed, positive and sustainable effects based on fish removal remain contentious and questionable, and of likely management benefit only in small, shallow waterbodies where controlled, high-level harvesting can be maintained (e.g., Matëna and Vyhnálek, 1994).
The present analysis indicates that complete fish eradication (if possible) would impact only marginally on internal nutrient stocks and nutrient recycling within the study reservoirs - unlike the common reliance on fish removal as an adjunct component of biomanipulation management in many eutrophic temperate lakes and reservoirs (e.g., Bendorff, 1995; Mehner et al., 2002; Kasprzak et al., 2007; Scharf, 2007; Søndergaard et al., 2008; Pedusaar et al., 2010). This difference appears largely attributable to the inordinately high external nutrient loadings impacting our study reservoirs (Table 1) - 1 to 2 orders of magnitude higher than a critical 'biomanipulation efficiency threshold of phosphorus loading' limit (0.6 to 0.8 g TP/m2/yr (< 10 kg TP/ha/yr)) suggested by Bendorff (1987 - see Bendorff 1990). This 'threshold' concept is widely recognized by experienced lake scientists.
Fish harvesting accordingly has little or no merit as a nutrient management tool in SA reservoirs, especially the hypertrophic reservoirs in greatest need of remediation. The clear, unambiguous decline in contributory importance of fish in internal phosphorus budget dynamics with rising trophic status (Figs 5 and 6) is a definitively major caveat to functional utility of biomass reduction in these reservoirs. Although some improvement is preferable to none, underlying cost-benefit issues arise. And apart from ineffectiveness in nutrient reduction, fish eradication would thwart concerted drives to encourage multi-purpose reservoir use, particularly economically valuable recreational angling (e.g., Ashton et al., 1985).
The Hartbeespoort Dam Bioremediation Programme (HDBP) provides an informative practical case study to test the effective impact of fish removal retrospectively. The reported removal of '190.4 tons of coarse fish ... Between February 2008 and June 2012' (Venter et al., 2012 p. 33) represents direct (instantaneous) removal of 0.96 tons biomass-stored TP with accompanying 'preventative' reductions of internal recycling of 18.6 tons TP through excretion and 21.6 tons TP through sediment bioturbation over 41 months (presuming catfish remained a static 80.9% fraction of fish removals). Based on annual loading rate values reported for this period (DWA, 2012), external TP loads over the corresponding 41-month period totalled 1 692.2 t. Direct reduction of TP through fish removal corresponds to merely 0.06% of this external TP input - quite literally a 'drop in the ocean'. Fish contributions in 'recycling' TP were greater, but nevertheless negligible in proportion to external P inputs - 1.14% (excretion) and 1.33% (bioturbation), with both values potentially over-estimated (excretion inflated by rate-scaling issues discussed in 'Methods', and bioturbation for reasons considered above). In any event, whatever their absolute magnitude, these metabolic activities merely reflect recycling of existing internal TP, not new additions. The likely influence of this 'regenerated' phosphorus on reservoir primary productivity does not even merit assessment: the exercise is fundamentally redundant at the P levels that prevail in this reservoir, particularly since P-limitation of phytoplankton is widely known to decline with rising trophic status (e.g. Marsden, 1989).
It is not surprising that no improvement was evident in phytoplankton indicators of trophic status determined in independent twice-weekly synoptic satellite imagery surveys (Matthews, 2014; Matthews and Bernard, 2015) before (n = 486) and after (n = 475) initiation of the HDBP. Median values of chlorophyll-a (70.8 vs. 74.3 μg/ℓ), cyanobacterial fraction of chlorophyll-a (39.6 vs. 49.8%), and average cyanobacterial scum coverage (8.1 vs. 9.5% of reservoir surface area) were almost indistinguishable. Improvements in water quality within 18 months of initiating HDBP purportedly evidenced on 'more and longer periods of clear water... absence of bad odour, etc.' (Venter, 2012b p. 53) are irreconcilable with objective satellite evidence for 24 months before and after February 2008: median values of both chlorophyll-α (73 vs. 85 μg/ℓ) and cyanobacterial chlorophyll (39 vs. 57%) were higher, as was average scum coverage (9 vs. 12%) on 231 vs. 259 sampling dates.
Recommendations prior to initiation of the HDBP (Koekemoer and Steyn, 2005) included: (i) biomass reduction of planktivorous fish (listed as canary kurper, catfish and carp) by 75% at least; (ii) efficient and rapid reduction of the above species in a 'few' years; (iii) reduction of benthivorous catfish and carp (classed as planktivorous above); and (iv) reduction of external nutrient loads prior to implementing biomanipulation. They noted (p. 5) that 'In order to achieve the desired bioremediation effect it is recommended that the fish community be restructured by the removal of 200-300 t of coarse fish (carp and catfish) during the first year of the fisheries exploitation project, and to continue the reduction of the standing crop to 20% during the second year'. In practice, fish removal only approached the lower target level after 41 months (Venter et al., 2012).
Ongoing annual operation and maintenance of the overall HDBP programme costs at least R25 million (~US $ 2.0 million), potentially increasing to roughly R100 million/yr (~US $ 8.5 million) with planned fast-track allocations and full-scale implementation (Venter, 2012b p. 55). Although proportional costs of the food-web restructuring thrust are unspecified, expenditure therein can be deemed virtually fruitless. No impartial scientific evidence exists to support the claim that 'it is of extreme importance that at least the biomass management and food web restructuring programmes [of HDBP] continue' (Venter, 2012a p. 23).
'Top-down' food-web management plans of the HDBP were identified as scientifically unfounded prior to initiation by desk-top literature analysis of known and anticipated ecological constraints (Hart, 2006). Neither carp nor catfish are important 'top-down' planktivores (Ashton et al., 1985; Harding and Hart, 2013). The present study reveals that 'bottom-up' reduction of internal loading through (coarse) fish removal is at best an ineffective tool to ameliorate eutrophication, and virtually futile where high external nutrient loading persists. A desk-top feasibility assessment would surely have identified the prospective ineffectiveness of 'bottom-up' food-web management in the HDBP.
These findings are directly pertinent to any objectively informed Phase 2 roll-out of the HDBP approach as a generic model for eutrophication management of South African reservoirs (Venter, 2012a). Rationally informed consideration of the plausible effectiveness of envisaged bioremedial (and other) management approaches prior to their extension and application to other reservoirs can limit or avoid misguided monetary and manpower expenditure. The following extract from Wetzel (2001) has compelling pertinence:
'Fish "biomanipulation" [...] requires a continual, sustained removal effort [only used] effectively in tandem with many simultaneously (sic) nutrient retention and control mechanisms [which] cannot be readily realized on a sustained basis in lakes that experience continued high nutrient loadings [our emphasis] [...] unless intensive management strategies are constantly applied. Even coupled with [reduced nutrient loading] such manipulations [...] are only of short-lived therapeutic value [temporarily displacing but not removing nutrient pools] from the ecosystem, and continued nutrient loading will be directed to maximizing primary productivity' - the very symptomatic problem that biomanipulation seeks to redress! 'With [future monitoring and regulation] biomanipulation will [...] be a useful, albeit expensive, therapeutic tool to minimize the effects of eutrophication'.
CONCLUSION
The role of fish in TP budget dynamics of SA reservoirs is effectively marginal. Their impacts decline exponentially with rising trophic status (i.e. external TP inputs) and become virtually insignificant in the most severely enriched reservoirs. No objective scientific basis exists to justify food-web management as a 'bottom-up' (resource limitation) strategy to tangibly reduce the quantity of within-reservoir phosphorus stock and its internal recycling in nutrient-polluted reservoirs. With 'top-down' biomanipulation already discredited (see Introduction), the present negation of 'bottom-up' intervention renders prospects of food-web manipulation unsuitable for realistic eutrophication management of SA reservoirs. 'Techno-transfer' of techniques developed in bio-physically different regions can (and must) be tested critically to ensure objectively informed implementation and prevent fruitless expenditure.
ACKNOWLEDGEMENTS
This work was supported by an Incentive Funding for Rated Researchers award to RCH from the South African National Research Foundation (NRF). Library and related facilities enabling the study were provided by the University of KwaZulu-Natal. Dr David Griffiths kindly supplied the regression equation relating fish TP excretion rate to fish biomass plotted as Fig. 2 in Griffiths (2006). Original satellite imagery data on chlorophyll-a concentrations and associated information on cyanobacteria in Hartbeespoort between December 2002 and April 2012 were kindly provided by Dr Mark Matthews. We thank three anonymous reviewers for firm endorsements of this study, and various inputs and suggestions offered to improve this paper. These were incorporated as appropriate in its revision.
REFERENCES
ADÁMEK Z and MARSÁLEK B (2013) Bioturbation of sediments by benthic macroinvertebrates and fish and its implication for pond ecosystems: a review. Aquacult. Int. 21 1-17. [ Links ]
AKHURST DJ, JONES GB, CLARK M and REICHELT-BRUSHETT A (2012) Effects of carp, gambusia, and Australian bass on water quality in a subtropical freshwater reservoir. Lake Reserv. Manage. 28 212-223. [ Links ]
ASHTON PJ, CHUTTER FM, COCHRANE KL, DE MOOR FC, HELY-HUTCHINSON JR, JARVIS AC, ROBARTS RD, SCOTT WE, THORNTON JA, TWINCH AJ and ZOHARY T (1985) The limnology of Hartbeespoort Dam. South African National Scientific Programmes Report No 110. National Scientific Programmes Unit: CSIR, Pretoria. 269 pp. [ Links ]
BAJER PG and SORENSEN PW (2014) Effects of common carp on phosphorus concentrations, water clarity, and vegetation density: a whole system experiment in a thermally stratified lake. Hydrobiologia DOI: 10.1007/s10750-014-1937-y. [ Links ]
BAJER PG, SULLIVAN G and SORENSEN PW (2009) Effects of a rapidly increasing population of common carp on vegetative cover and waterfowl in a recently restored Midwestern shallow lake. Hydrobiologia 632 235-245. [ Links ]
BENNDORF J (1990) Conditions for effective biomanipulation: conclusions derived from whole-lake experiments in Europe. Hydrobiol. 200/201 187-203. [ Links ]
BENNDORF J (1995) Possibilities and limits for controlling eutrophication by biomanipulation. Int. Rev. Ges. Hydrobiol. 80 519-534. [ Links ]
BREUKELAAR A, LAMMENS E, KLEIN BRETELER JGP and TATRAI I (1994) Effects of benthivorous bream (Abramis brama) and carp (Cyprinus carpio) on sediment resuspension and concentrations of nutrients and chlorophyll a. Freshwater Biol. 32 112-121. [ Links ]
CROUCAMP L and VENTER P (2012) Hartbeespoort Dam Remediation: Biomass removal and management. Civ. Eng. 20 (7) 25-29. [ Links ]
CUKIC Z and VENTER P (2012) Hartbeespoort Dam Remediation: Sediment removal and management. Civ. Eng. 20 (7) 42-47. [ Links ]
CYR H and PETERS RH (1996) Biomass-size spectra and the prediction of fish biomass in lakes. Can. J. Fish. Aquat. Sci. 53 994-1006. [ Links ]
DWA (DEPARTMENT OF WATER AFFAIRS, SOUTH AFRICA) (2012) Hartbeespoort Dam Bioremediation Programme: Integrated Monitoring Programme - Progress Report April 2014. DWA, Pretoria. [ Links ]
DWA (DEPARTMENT OF WATER AFFAIRS, SOUTH AFRICA) (2013) National Water Resource Strategy. Water for an Equitable and Sustainable Future. June 2013 Second Edition. DWA, Pretoria. 145 pp. [ Links ]
DWA (DEPARTMENT OF WATER AFFAIRS, SOUTH AFRICA) (2014) National Eutrophication Monitoring Programme. URL: https://www.dwa.gov.za/iwqs/eutrophication/NEMP/report/NEMPyears.aspx Accessed October 2014). [ Links ]
GEHRKE PC and HARRIS JH (1994) The role of fish in Cyanobacterial blooms in Australia. Aust. J. Mar. Freshwat. Res. 45 905-915. [ Links ]
GIDO KB (2002) Interspecific comparisons and the potential importance of nutrient excretion by benthic fishes in a large reservoir. Trans. Am. Fish. Soc. 131 260-270. [ Links ]
GRIFFITHS D (2006) The direct contribution of fish to lake phosphorus cycles. Ecol. Freshwater Fish 15 86-95. [ Links ]
GRIFFITHS D (2014) Personal e-mail communication to R C HART. [ Links ]
GROBLER DG and DAVIES E (1981) Sediments as a source of phosphate: a study of 38 impoundments. Water SA 7 54-60. [ Links ]
HANSSON L-A, ANNADOTTER H, BERGMAN E, HAMRIN SF, JEPPESEN E, KAIRESALO T, LUOKKANEN E, NILSSON P-A, SØNDERGAARD M and STRAND J (1998) Biomanipulation as an application of food-chain theory: constraints, synthesis, and recommendations for temperate lakes. Ecosystems 1 558-574. [ Links ]
HARDING WR (2008) The determination of annual phosphorus loading limits for South African Dams. WRC Report No. 1687/1/08. Water Research Commission, Pretoria. ISBN: 978-1-77005-866-6. [ Links ]
HARDING WR (2015) Living with eutrophication in South Africa: a review of realities and challenges. Trans. R. Soc. S. Afr. DOI: 10.1080/0035919X.2015.1014878. 17 pp. [ Links ]
HARDING WR, DOWNING TG, VAN GINKEL CE and MOOLMAN PM (2009) An overview of cyanobacterial research and management in South Africa post-2000. Water SA 35 479-484. [ Links ]
HARDING WR and HART RC (2013) Foodweb structure in the hyper trophic Rietvlei Dam based on stable isotope analysis: Specific and general implications for reservoir biomanipulation. Water SA 39 615-616. [ Links ]
HARDING WR and KOEKEMOER JH (2011) Characterization of the fishery assemblages in a suite of eutrophic and hypertrophic South African Dams. WRC Report No. 1643/1/10. Water Research Commission, Pretoria. ISBN: 978-1-4312-0054-2. [ Links ]
HARDING WR and PAXTON BR (2001) Cyanobacteria in South Africa: a review. WRC Report No. TT53/01. Water Research Commission, Pretoria. ISBN: 1 86845 7745. [ Links ]
HARDING WR, THORNTON JA, STEYN G, PANUSKA J and MORRISON IR (2004) Hartbeespoort Dam Remediation Project (Phase 1).Volume I. 158 pp. Department of Agriculture, Conservation, Environment and Tourism of the North West Province Government (DACET, NWP). [ Links ]
HART RC (2006) Foodweb (bio-)manipulation of South African reservoirs - viable eutrophication management prospect or illusory pipe dream? A reflective commentary and position paper. Water SA 32 567-576. [ Links ]
HART RC (2011) Zooplankton biomass to chlorophyll ratios in relation to trophic status within and between ten South African reservoirs: Causal inferences, and implications for biomanipulation. Water SA 37 513-522. [ Links ]
HART RC (2012) Zooplankton abundance and composition in the hypertrophic Rietvlei Dam, South Africa, negate prospects for its remedial 'top-down' biomanipulation. Afr. J. Aquat. Sci. 37 311-321. [ Links ]
HODGSON JYS (2005) A trophic cascade synthesis: review of top- down mechanisms regulating lake ecosystems. Bios 76 137-144. [ Links ]
HORPPILA J, PELTONEN H, MALINEN T, LUOKANNEN E and KARESALO T (1998) Top-down or bottom-up effects by fish: issues of concern in biomanipulation of lakes. Restor. Ecol. 6 20-28. [ Links ]
HUDSON JJ, TAYLOR WD and SCHINDLER DW (1999) Planktonic nutrient regeneration and cycling efficiency in temperate lakes. Nature (Lond.) 400 659-661. [ Links ]
KALFF J (2002) Limnology: Inland Water Ecosystems. Prentice Hall, New Jersey, USA. 592 pp. [ Links ]
KASPRZAK P, BENNDORF J, GONSIORCZYK T, KOSCHEL R, KRIENITZ L, MEHNER T, HÜLSMANN S, SCHULTZ H and WAGNER A (2007) Reduction of nutrient loading and biomanipu- lation as tools in water quality management: Long-term observations on Bautzen Reservoir and Feldberger Haussee (Germany) Lake Reserv. Manage. 23 410-427. [ Links ]
KING AJ, ROBERTSON AI and HEALEY MR (1997) Experimental manipulations of the biomass of introduced carp (Cyprinus carpio) in billabongs. I. Impacts on water-column properties. Mar. Freshwater Res. 48 435-443. [ Links ]
KOEKEMOER JH and STEYN GJ (2005) Fish community study of Hartbeespoort Dam: Final report. Department of Agriculture, Conservation, Environment and Tourism; North West Province (DACET, NWP). 81 pp. [ Links ]
KOEKEMOER JH, STEYN GJ, VENTER P, CILLIERS C, VAN GINKEL C, BARNHOORN IEJ and WAGENAAR GM (2012) Hartbeespoort Dam Remediation: Food web and integrated monitoring. Civ. Eng. 20 (7) 35-37. [ Links ]
LAMMENS EHRR (1999) The central role of fish in lake restoration and management. Hydrobiologia 395/396 191-198. [ Links ]
MARSDEN MW (1989) Lake restoration by reducing external phosphorus loading: the influence of sediment phosphorus release. Freshwater Biol. 21 139-162 [ Links ]
MATTHEWS MW (2014) Eutrophication and cyanobacterial blooms in South African inland waters: 10 years of MERIS observations. Remote Sens. Environ. 155 161-177. [ Links ]
MATTHEWS MW and BERNARD S (2015) Eutrophication and cyanobacteria in South Africa's standing water bodies: A view from space. S. Afr. J. Sci. 111 (5/6) Art. #2014-0193, 8 pp. DOI: http://dx.doi.org/10.17159/sajs.2015/20140193. [ Links ]
MATĔNA J and VYHNÁLEK V (1994) Food web management in reservoirs. In: Eiseltová M and Björk S (eds) Restoration of Lake Ecosystems: A Holistic Approach. IWRB Special Publication 32. International Waterfowl and Wetlands Research Bureau, Slimbridge. 169-173. [ Links ]
McMANAMAY R, WEBSTER JR, VALETT HM and DOLLOFF CA (2011) Does diet influence consumer nutrient cycling? Macroinvertebrate and fish excretion in streams. J. N. Am. Benthol. Soc. 30 84-102. [ Links ]
MEHNER T, BENNDORF J, KASPRZAK P and KOSCHEL R (2002) Biomanipulation of lake ecosystems: successful applications and expanding complexity in the underlying science. Freshwater Biol. 47 2453-2465. [ Links ]
WALMSLEY RD and BUTTY M (eds) (1980) The limnology of some selected South African impoundments. A collaborative report by the Water Research Commission and the National Institute for Water Research, CSIR. WRC/CSIR, Pretoria. ISBN: 0798817364. [ Links ]
NOWLIN WH, EVARTS JL and VANNI MJ (2005) Release rates and potential fates of nitrogen and phosphorus from sediments in a eutrophic reservoir. Freshwater Biol. 50 301-322. [ Links ]
OECD (ORGANISATION FOR ECONOMIC CO-OPERATION AND DEVELOPMENT) (1982) Eutrophication of Waters. Monitoring, Assessment and Control. OECD, Paris. 154 pp. [ Links ]
PEDUSAAR T, SAMMALKORPI I, HAUTALA A, SALUJÕE J, JÄRVALT A and PIHLAK M (2010) Shifts in water quality in a drinking water reservoir during and after the removal of cyprinids. Hydrobiologia 649 95-106. [ Links ]
PETERS RH (1983) The Ecological Implications of Body Size. Cambridge University Press, Cambridge. 329 pp. [ Links ]
REYNOLDS CS (2003) The development of perceptions of aquatic eutrophication and its control. Ecohydrol. Hydrobiol. 3:149-163. [ Links ]
ROBERTSON AI, HEALEY MR and KING AJ (1997) Experimental manipulations of the biomass of introduced carp (Cyprinus carpio) in billabongs. II. Impacts on benthic properties and processes. Mar. Freshwater Res. 48 445-454. [ Links ]
SCHARF W (2007) Biomanipulation as a useful water quality management tool in deep stratifying reservoirs. Hydrobiologia 583 21-42. [ Links ]
SCHAUS MH and VANNI MJ (2000) Effects of gizzard shad on phyto- plankton and nutrient dynamics: Role of sediment feeding and fish size. Ecology 81 1701-1719. [ Links ]
SMITH VH and SCHINDLER DW (2009) Eutrophication science: where do we go from here? Trends Ecol. Evol. 24 201-207. [ Links ]
S0NDERGAARD M, LIBORIUSSEN L, PEDERSEN AR and JEPPESEN E (2008) Lake restoration by fish removal: short- and long-term effects in 36 Danish lakes. Ecosystems 11 1291-1305. [ Links ]
TORRES LE and VANNI MJ (2007) Stoichiometry of nutrient excretion by fish: interspecific variation in a hypereutrophic lake. Oikos 116 259-270. [ Links ]
VAN GINKEL CE (2011) Eutrophication: Present reality and future challenges for South Africa. Water SA 37 693-701. [ Links ]
VANNI MJ (2002) Nutrient cycling by animals in freshwater ecosystems. Ann. Rev. Ecol. Syst. 33 341-370. [ Links ]
VANNI MJ, BOROS G and McINTYRE PB (2013) When are fish sources vs. sinks of nutrients in lake ecosystems? Ecology 94 2195-2206. [ Links ]
VENTER P (2012a) Hartbeespoort Dam Remediation: Overview of the programme. Civ. Eng. 20 (7) 15-23. [ Links ]
VENTER P (2012b) Hartbeespoort Dam Remediation: Future challenges and prospects. Civ. Eng. 20 (7) 53-55. [ Links ]
VENTER P, KOEKEMOER J and STEYN JG (2012) Hartbeespoort Dam Remediation: Food web restructuring. Civ. Eng. 20 (7) 31-34. [ Links ]
WALMSLEY RD and BUTTY M (eds) (1980) The limnology of some selected South African impoundments. A collaborative report by the Water Research Commission and the National Institute for Water Research, CSIR. Water Research Commission, Pretoria. ISBN: 0798817364. [ Links ]
WETZEL RG (2001) Limnology: Lake and River Ecosystems (3rd edn). Academic Press, San Diego. 1006 pp. [ Links ]
WWF (WORLD WILDLIFE FUND) (2014) Living Planet Report 2014: Species and Spaces, People and Places. WWF, Gland, Switzerland. ISBN: 978-2-940443-87-1. [ Links ]
ZAMBRANO L, SCHEFFER M and MARTINEZ-RAMOS M (2001) Catastrophic response of lakes to benthivorous fish introduction. Oikos 94 344-350. [ Links ]
Received: 20 October 2014
Accepted in revised form 28 April 2015
* To whom all correspondence should be addressed. e-mail: robhart@telkomsa.net or hartr@ukzn.ac.za

