


Services on Demand
Article
 English (pdf)
 Article in xml format
 Article references
Indicators

Related links
-
 Cited by Google
 -
 Similars in Google
Share

 Permalink
Water SA
On-line version ISSN 1816-7950
Print version ISSN 0378-4738
Water SA vol.41 n.3 Pretoria Apr. 2015
http://dx.doi.org/10.4314/wsa.v41i3.06
Influence of selected biotopes on chironomid-based bioassessment of the Swartkops River, Eastern Cape, South Africa
ON OdumeI, *; CG PalmerI; FO ArimoroII; PK MensahI
IUnilever Centre for Environmental Water Quality, Institute for Water Research, Rhodes University, P.O Box 94, Grahamstown, South Africa
IIDepartment of Biological Sciences, Federal University of Technology, P.M.B 65, Minna, Nigeria
ABSTRACT
Impact of pollution on aquatic biota is usually assessed by comparing the assemblage at an impacted site with those at a control or reference site. In South Africa, except in rivers where not all biotopes are represented, the characterisation of a macroinvertebrate-based pollution effect is usually based on samples collected from three distinct biotopes, i.e., stones, vegetation and sediments. In this study, the influence of reducing the numbers of biotopes on chironomid-based bioassessment of pollution in the Swartkops River was investigated. This paper addresses the following questions: (i) can the chironomid species assemblage from any single distinct biotope analysed separately provide sufficiently accurate results similar to those of the composite-biotope group assemblage, and (ii) can chironomid community types be identified based on their biotope preferences? Chironomid larvae were sampled seasonally from three distinct biotopes: stones (stone-in-and-out-of-current), vegetation (marginal and aquatic), and sediment (gravel, sand and mud, GSM) at one upstream control site, i.e., Site 1, and three downstream sites, i.e., Sites 2, 3 and 4. Site 2 in Uitenhage was impacted by diffuse pollution sources including runoff from road networks. Site 3, also in Uitenhage, was impacted by wastewater effluent discharges as well as diffuse pollution sources, while Site 4 in Despatch was about 2.5 km downstream of Site 3. The multivariate analysis of similarity (ANOSIM) indicated that the chironomid species assemblages based on the composite biotopes were significantly different between all site pairs in terms of species composition and abundance. However, when the assemblages were analysed separately for each of the three distinct biotopes, only the stone-based assemblage indicated significant differences between all of the site pairs similarly to those of the composite biotopes. Thus, the results suggest that, when resources are limited, sampling only the stony benthos could still provide bioassessment results similar to benthos from all three biotopes combined.
Keywords: bioindicators, biotopes, chironomid, pollution, Swartkops River, South Africa.
INTRODUCTION
The biophysical habitat structures such as available biotopes are among the important factors that could potentially influence bioassessment of aquatic pollution (Dallas, 2007). Aquatic ecosystems with diverse and complex habitat structures are likely to support more biodiversity than systems with less habitat complexity and diversity (Lencioni and Rossaro, 2005; Epele et al., 2012). Consequently, bioassessment protocols usually include biophysical habitat assessment to aid the interpretation of results (e.g. Barbour et al., 1999; Dickens and Graham, 2002).
Chironomids have potential for bioassessment of stream pollution because of their high species diversity and wide tolerance to different types and levels of pollutants (Armitage et al., 1995; Cranston, 1996; Ferrington, 2008; Odume and Muller, 2011). A review of chironomid global diversity revealed that 4 147 species in 339 genera are unambiguously aquatic in their immature stages (Ferrington 2008). Chironomid larvae occur in most aquatic habitats, inhabit all available biotopes, and dominate the abundance and species richness of macroinvertebrate samples taken from most freshwater ecosystems (Harrison, 2003, Ferrington, 2008). At the reach scale in freshwater ecosystems, available biotopes, i.e. microhabitats, can influence chironomid distribution and species diversity (Syrovátka et al., 2009; Epele et al., 2012). Consequently, studies elsewhere have investigated the role of biotopes in determining the structure and distribution of chironomid assemblages (Príncipe et al., 2008; Rosa et al., 2011).
In South Africa, Dallas (2007) characterised the relationship between biotopes and macroinvertebrates in selected rivers and found that differences exist between macroinvertebrate assemblages collected from different biotopes within the same river. However, the Dallas (2007) study was based on family-level taxonomic resolution and all species within the family Chironomidae were lumped together as one taxon, thereby obscuring the potential influence of biotopes on chironomid species-based bioassessment. Thus, the extent to which biotope availability could influence chironomid species-based bioassessment of stream pollution is yet to be characterised in any South African stream or river.
With the exception of rivers and streams where not all three distinct biotopes, i.e. stones, vegetation and sediments, are represented, macroinvertebrate-based bioassessment of South African lotic ecosystems is often undertaken by sampling all three distinct biotopes, and the overall health of the river calculated based on the collected assemblages (Dickens and Graham, 2002; Odume and Muller, 2011). Since impact of perturbation on aquatic biota is usually assessed by comparing the assemblage structure of an impacted site with a reference or control site (Karr and Chu 2000, Bonada et al. 2006, Odume et al. 2012), it is important to investigate whether assemblage based on any single biotope can provide similar discrimination between the reference and impacted sites as assemblages based on the combination of all three distinct biotopes. If the assemblage based on any of the biotopes can provide similar results as those of all biotopes combined, then, in the face of limited resources, sampling can be restricted to such a biotope.
Thus, this paper addresses the following questions:
- Can the chironomid species assemblage from any single distinct biotope analysed separately provide a sufficiently accurate result, similar to those of the composite-group species assemblage? (That is, what is the effect of reducing biotope number on the utility of Swartkops River chironomid species assemblage to demonstrate biotic impairment?) 'Composite-group' refers to combined data from all three biotopes.
- Can chironomid community types be identified based on their biotope preferences in the Swartkops River?
Therefore, in this study we investigate whether biotope availability influences chironomid species-based bioassessment of pollution in the Swartkops River, Eastern Cape, South Africa. Although different biotopes have been subjectively defined with reference to hydraulic conditions (Demars et al., 2012), those selected in this study were based on the South African Scoring System version 5 (SASS5) protocol, and included stones (stones-in-and-out-of-current), vegetation (marginal and aquatic) and sediment (gravel, sand and mud: GSM).
MATERIALS AND METHODS
Study area and sampling sites
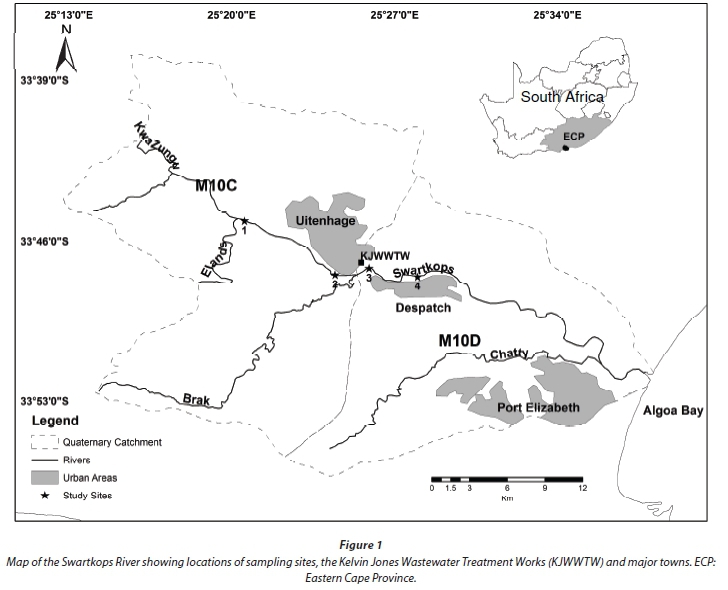
The study was undertaken in the Swartkops River in the Eastern Cape of South Africa. The river has its origin in the foothills of the Groot Winterhoek Mountains, and has a catchment size of about 1 555 km2. It flows through gravel and stone floodplains of poorly consolidated rocks of the Uitenhage Group (Heydorn and Grindley, 1986), and then discharges into the Indian Ocean at Algoa Bay near Port Elizabeth (Fig. 1). Geologically, the upper catchment of the river consists of the quartzite of the Table Mountain Groups and the lower catchment below the confluence of the Elands and Kwazunga is of weakly consolidated cretaceous shale of marine origin (Fromme, 1988). The river is an important ecological asset because it supports an estuary that ranked 11th-most important in terms of biodiversity of South Africa's estuaries (Enviro-Fish Africa, 2009; 2011). However, because of numerous effects of urban and industrial activities on its catchment, the water quality as well as biotic integrity are being impacted by several sources of pollution including wastewater effluent discharge, and runoff from surrounding road and rail networks and informal settlements (Odume and Muller, 2011; Odume et al., 2012).
Four sites (Fig. 1) were selected on the basis of the greatest number of available biotopes. Site 1 (33o 45' 08.4" S, 25o 20' 32.6" E), situated in the upstream section of the river, was selected as the control site because it represented the best available conditions in terms of water quality and biotic condition. Site 2 (33o 47' 29.0" S, 25o 24' 26.4" E) and Site 3 (33o 47' 11.8'' S, 25o 25' 53.97" E) were both situated in the industrial town of Uitenhage, while Site 4 (33o 47' 34.0" S, 25o 27' 58.7" E) was in the residential town of Despatch. Site 2 was mainly impacted by runoff from informal settlements and surrounding road networks and it was situated upstream of the discharge point of the Kelvin Jones Wastewater Treatment Works (WWTW) in Uitenhage. Site 3, situated few metres downstream of the location where effluent from the Kelvin Jones WWTW enters the river, was influenced by wastewater effluent discharges as well as by runoff from the surrounding road and rail networks (Odume and Muller, 2011; Odume et al., 2012). Site 4 was about 2.5 km downstream of Site 3 with the impact of the effluent still indicated by water quality and the benthic community structure (Odume and Muller, 2011; Odume et al., 2012). All four sampling sites have a similar range of biotopes.
Chironomid sampling and water chemistry analysis
Chironomid larvae were sampled over a period of 3 years between August 2009 and September 2012. Sampling was done in late August (spring) and late November (summer) 2009, March (autumn) and July (winter) 2010, September (spring) and December (summer) 2011, April (autumn) and September (spring) 2012. On each sampling occasion, chironomid larvae were collected from 3 distinct biotopes: stones (stones-in-and-out-of-current), vegetation (marginal and aquatic vegetation), and sediment (gravel, sand and mud, GSM). In each sampling event, 3 replicate samples were collected per biotope per site, making up 9 samples per site per sampling season, so that in the entire study period 24 samples were collected per biotope per site. Collected chironomid larvae were preserved in 70% ethanol, and transported to the laboratory for sorting, mounting, and species identification. Larvae were mounted according to Odume and Muller (2011), and identified using the keys described by Wiederholm (1983), Cranston (1996) and Harrison (2003).
Concurrent with chironomid sampling, sub-surface mid-channel dissolved oxygen (DO), electrical conductivity (EC), turbidity, temperature and pH were measured using Cyberscan DO 300, Cyberscan Con 300, Orbeco-Hellige 966, mercury-in-glass thermometer and Cyberscan pH 300, respectively. Sub-surface mid-channel water samples were collected in acid-washed 250-mℓ plastic bottles, transported in ice-filled cooler boxes to the laboratory and analysed for orthophosphate-phosphorus (PO4-P) and total inorganic nitrogen (TIN). Nitrate-nitrogen (NO3-N) and nitrite-nitrogen (NO2-N) were analysed according to Ondrus (1996) and APHA et al. (1971) method number 354.1, respectively. Orthophosphate-phosphorus (PO4-P) and ammonium-nitrogen (NH4-N) were analysed using Spectroquant® phosphate and ammonium concentration test kits according to the manufacturer's instructions. Total inorganic nitrogen (TIN) concentration was calculated by summing the individual concentrations of NO3-N, NO2-N and NH4-N (Palmer et al., 2005).
Data analyses
Ascertaining differences between the sampling sites based on composite and individual biotope-based chironomid species composition and abundance
Analysis of similarity (ANOSIM), which is a non-parametric multivariate statistical technique, was used to determine the influence of reducing the number of biotopes on the chironomid species-based bioassessment of the Swartkops River, by comparing the species composition between the four sites. A two-step approach was followed in comparing the four sites' species compositions during the study period. Since three replicate chironomid species samples were collected per biotope per site during each sampling event, in the first step, for each site per sampling event, a combination of one replicate sample from the stone, vegetation and GSM biotopes was analysed as composite sample so that each site had three composite samples per sampling event. Thus, throughout the study period, each site had 24 composite samples, which were compared based on their chironomid species compositions and abundances between the four sites using ANOSIM and SIMPER analyses. The composite sample comparison between the sites was undertaken to ascertain differences between the chironomid species compositions at the four sampling sites when all three distinct biotopes were sampled. In the second step of the analysis, instead of analysing the species compositions based on the composite data, species compositions based on the individual biotopes were analysed separately and compared between the four sites, thereby artificially reducing the number of biotopes from which chironomids were collected.
Thus, in the second step of the analysis, 24 samples collected from each biotope at each site during the entire study period were compared based on chironomid species compositions and abundances using ANOSIM and SIMPER. The 24 replicate samples compared in both steps provided sufficient permutations for the global and pair-wise tests.
The taxa that enabled discrimination between the sites and their contributions to the dissimilarity matrices were indicated using the analysis of similarity percentage (SIMPER) (Clarke and Warwick, 1994). Chironomid species abundance data were log (x+1) transformed to down-weight the effects of highly abundant taxa (Zuur et al., 2007). Both ANOSIM and SIMPER analyses, which are strictly pair-wise comparison tests between 2 levels, were used instead of the comparable parametric MANOVA because they make no prior assumptions about the data and are more suited for community data with zeros compared to the corresponding MANOVA technique (Clarke and Warwick, 1994). An important advantage of the ANOSIM and SIMPER analyses is that they have no requirement for the variability of within-group replication needing to be similar for all groups, so that samples from the same site collected over different years can form groups instead of groups of sites (Clarke and Warwick, 1994). Hence, in the present study, samples from the same sites collected over different years formed the same groups. The spread of the global R-values was used to determine the statistical significance of the observed R-value at a significant level not above 5%. Both ANOSIM and SIMPER analyses were computed using Primer 5 version 5.2.9 (Clarke and Warwick, 1994).
The number of taxa, Shannon diversity and evenness indices were computed separately for the individual biotopes and for the composite data using Primer 5 version 5.2.9. The Kruskal-Wallis multiple comparison test was then used to compare the results of the indices between the four sites separately for the individual biotopes and composite biotopes (P < 0.05). Statistica software package version 9 was used to compute the Kruskal-Wallis test.
One-way ANOVA was used to test for differences (P < 0.05) in the means of the physico-chemical variables between the sampling sites. The Tukey's Honestly Significant Different (HSD) test was computed to indicate the exact sites that differed when ANOVA indicated global significant differences. The basic assumptions of normality and homogeneity of variance, which are required for ANOVA, were tested using the Shapiro-Wilk test and the Levene's test, respectively. When it appeared that these assumptions were not met, the data were logarithmically transformed. ANOVA was computed using the Statistica software package version 9.
Identifying chironomid community types based on biotope preferences
To identify chironomid community types based on their preferred biotopes, the Pearson's pointbiserial correlation coefficient (De Cáceres and Legendre, 2009) was computed to determine chironomid species-biotope association at Site 1. The species abundance was used as the response variable and the biotopes as the predictive variables. The Pearson's point-biserial coefficient was used in this study instead of similar statistical analyses, such as indicator species analysis and non-metric multidimensional scaling (NMDS), because it indicates the degree of species preference for a given biotope and can detect both negative (i.e. when a species tends to avoid a particular biotope) and positive (i.e. when a species tends to associate with a particular biotope) correlations (De Cáceres and Legendre, 2009). The usefulness of the point-biseral correlation analysis depends on the number of replicates; thus, the analysis was undertaken without pooling the replicate samples collected per biotope at Site 1 so that each biotope had 24 replicate samples (i.e. 3 samples per sampling occasion in 8 sampling events). The analysis was undertaken only for the chironomid species that occurred at Site 1 (i.e. the control site) to avoid the confounding effects of pollution on biotope-chironomid species association at Sites 2, 3 and 4. Because the analysis was restricted only to species at Site 1, biotope preferences of species not occurring at this site were not computed. Unlike the Pearson's point-biserial correlation analysis whose aim was to enable the detection of association between chironomid species and biotopes, the ANOSIM and SIMPER analyses were undertaken to ascertain differences between the sites; hence they were not only undertaken for species collected at Site 1. Species occurring in less than 5 of the 72 samples (24 samples per biotope x 3 biotopes) over the study period were eliminated from the analysis because they were considered rare. The statistical significance of the Pearson's point-biserial correlation was tested using a Monte Carlo permutation test with 999 permutations at P < 0.05. The Pearson's point-biserial correlation coefficient was computed using the Indicspecies package version 1.6.7 within the R statistical programme version 3.0.0 software environment (De Cáceres, 2013; R Core Team, 2013).
RESULTS
Physico-chemical variables
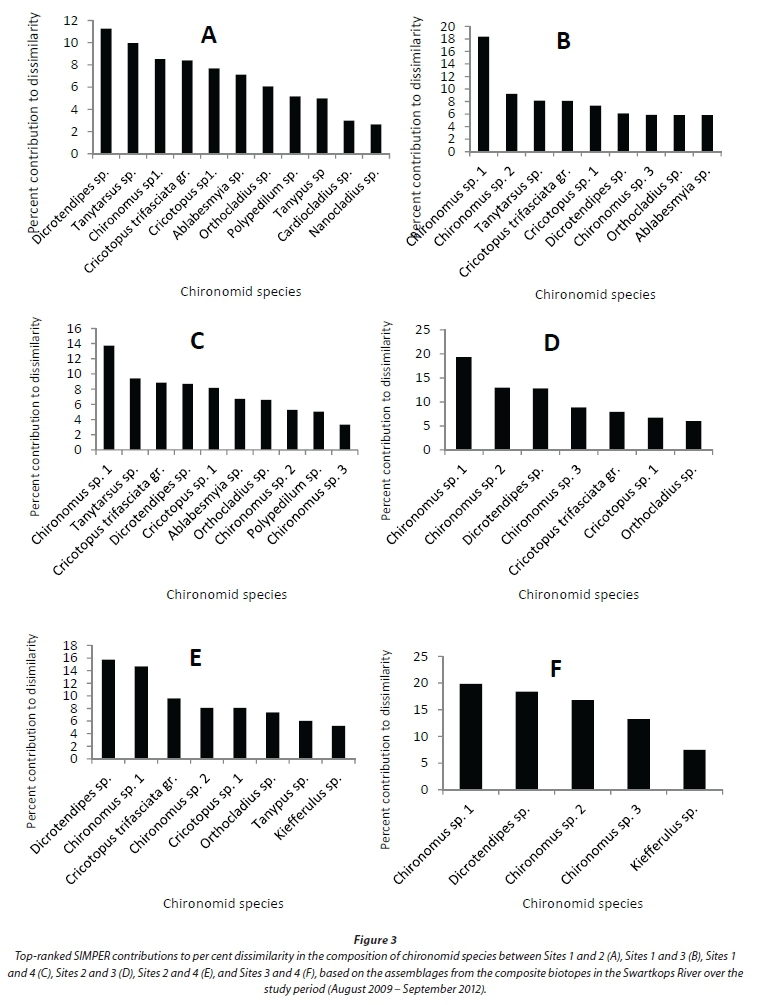
The nutrient concentrations, i.e., TIN and PO4-P at Sites 3 and 4, were significantly (P < 0.05) higher than concentrations recorded at Sites 1 and 2 (Table 1). There were marked increases in the values of electrical conductivity (EC) at Sites 2, 3 and 4 compared with the upstream control site. Dissolved oxygen (DO) showed significant depletion at Sites 3 and 4 compared with Sites 1 and 2. Only Site 3 had significantly higher values of turbidity. Temperature and pH were not significantly different between the four sampling sites (P > 0.05) (Table 1).
Assessing differences between sites based on composite and individual biotope chironomid assemblages
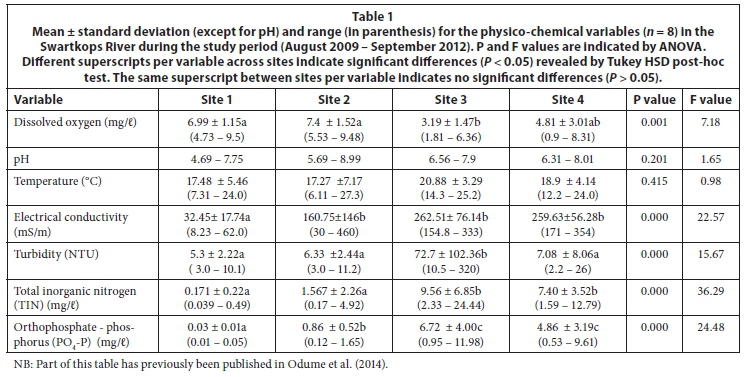
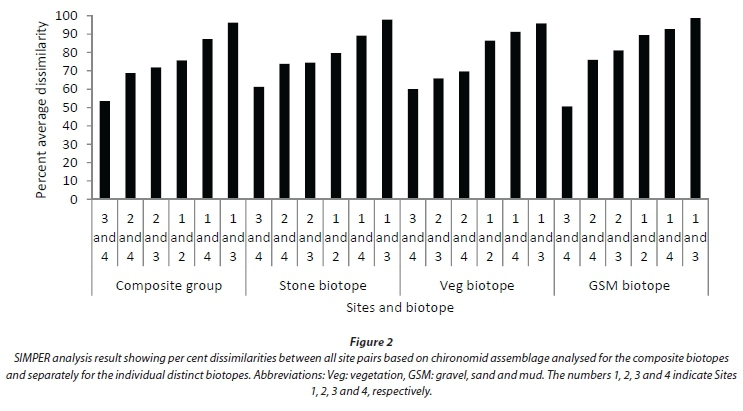
A total of 35 chironomid species in 3 sub-families, Orthocladiinae, Chironominae and Tanypodinae, were recorded during the study period (Appendix). ANOSIM revealed that the chironomid assemblage based on the composite biotopes differed significantly in terms of species composition between the four sampling sites (Global R = 0.563). Pair-wise comparison test showed that all site pairs were significantly different; the highest significant difference was between Sites 1 and 3, and the lowest between Sites 3 and 4 (Table 2). In terms of per cent dissimilarities in species composition and abundance between the four sites, the highest dissimilarity (96.19%) was recorded between Sites 1 and 3 and the lowest (53.59%) between Sites 3 and 4 (Fig. 2). Different numbers of species contributed 75% cumulative dissimilarities between the different site pairs: Sites 1 and 2 (11 species), Sites 1 and 3 (9 species), Sites 1 and 4 (10 species), Sites 2 and 3 (7 species), Sites 2 and 4 (8 species), and Sites 3 and 4 (5 species) (Fig. 3). Dicrotendipes sp., Tanytarsus sp., Chironomus sp.1, Chironomus sp.2, Cricotopus sp.1, and Cricotopus trifasciata gr were the top ranked species contributing to the dissimilarities between the sampling site pairs.
ANOSIM of the stone-based assemblage indicated significant differences between the sampling sites (Global R = 0.496). The pair-wise comparison test showed that all site pairs were significantly different; the highest significant difference was between Sites 1 and 3, and the lowest between Sites 2 and 4 (Table 2). SIMPER analysis indicated that the highest dissimilarity was between Sites 1 and 3 (97.86%), and the lowest between Sites 3 and 4 (61.24%) (Fig. 2). In terms of the top-ranked species that discriminated between the sites, different numbers of species contributed 75% cumulative dissimilarities between different site pairs: Sites 1 and 2 (11 species), Sites 1 and 3 (8 species), Sites 1 and 4 (9 species), Sites 2 and 3 (6 species), Sites 2 and 4 (7 species), and Sites 3 and 4 (5 species) (Fig. 4). The same species as the composite-based assemblage were the top-ranked species contributing to the dissimilarities between the sampling site pairs (Fig. 4).
Chironomid assemblage for the vegetation biotope also differed significantly between the sampling sites (Global R = 0.447). However, the pair-wise comparison test indicated no significant difference between Sites 2 and 4 (Table 2). Similarly to the composite- and stone-based assemblages the highest significant difference was between Sites 1 and 3. Fewer numbers of species, compared to the stone and composite biotopes, discriminated between the sites (Fig. 5). Chironomus sp.1, Chironomus sp.2, Dicrotendipes sp., Tanytarsus sp., Cricotopus trifasciata gr., and Kiefferulus sp. were the major contributors to the dissimilarities between the sampling sites (Fig. 5).
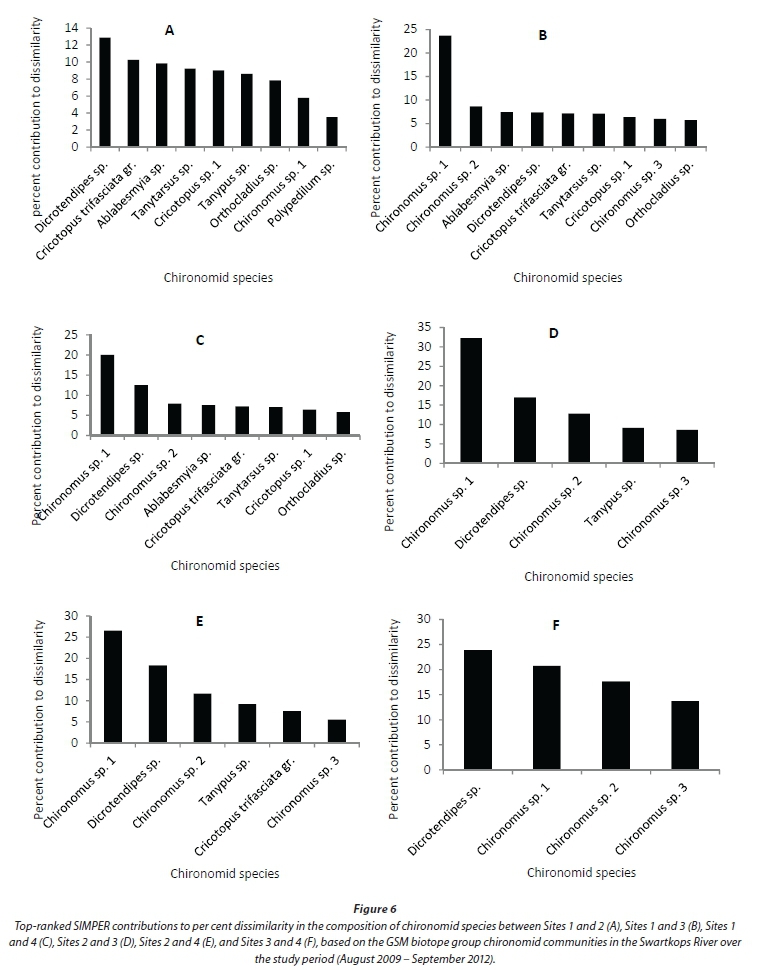
The GSM-based assemblage also differed significantly between the sampling sites (Global R = 0.474). However, Sites 3 and 4 were not significantly different in terms of species composition (Table 2). The highest significant difference was observed between Sites 1 and 3. The numbers of species that contributed 75% cumulative dissimilarities between the site pairs were: Sites 1 and 2 (9 species), Sites 1 and 3 (9 species), Sites 1 and 4 (8 species), Sites 2 and 3 (5 species), Sites 2 and 4 (6 species), and Sites 3 and 4 (4 species) (Fig. 6). Chironomus sp.1, Dicrotendipes sp., Ablabesmyia sp. and Cricotopus trifasciata gr. were the major contributors to the overall per cent dissimilarity between the site pairs (Fig. 6).
Comparing selected summary indices between the sampling sites
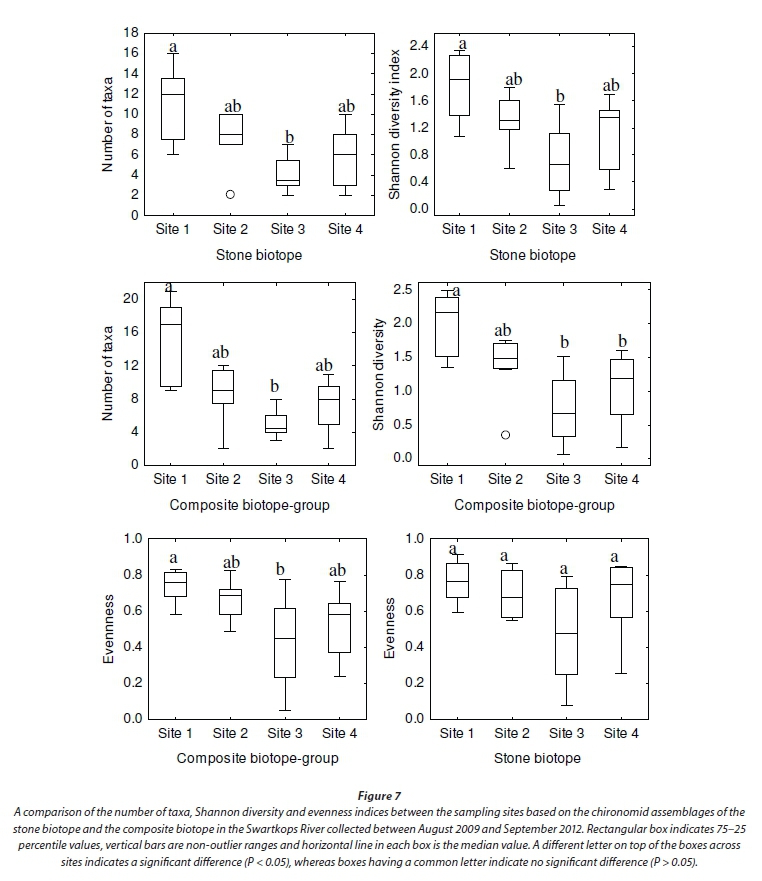
The number of taxa, Shannon diversity and evenness indices were compared between the sampling sites based on the assemblages from the composite biotope group and separately for the individual biotopes. The Kruskal-Wallis test revealed that the number of taxa based on the composite biotopes was significantly higher at Site 1 than Site 3 (P < 0.05). However, though more taxa were recorded at Site 1 than at Sites 2 and 4, these were not significantly different (P > 0.05) (Fig. 7). The Shannon diversity and evenness indices were significantly higher at Site 1 than at Sites 3 and 4 (P < 0.05).
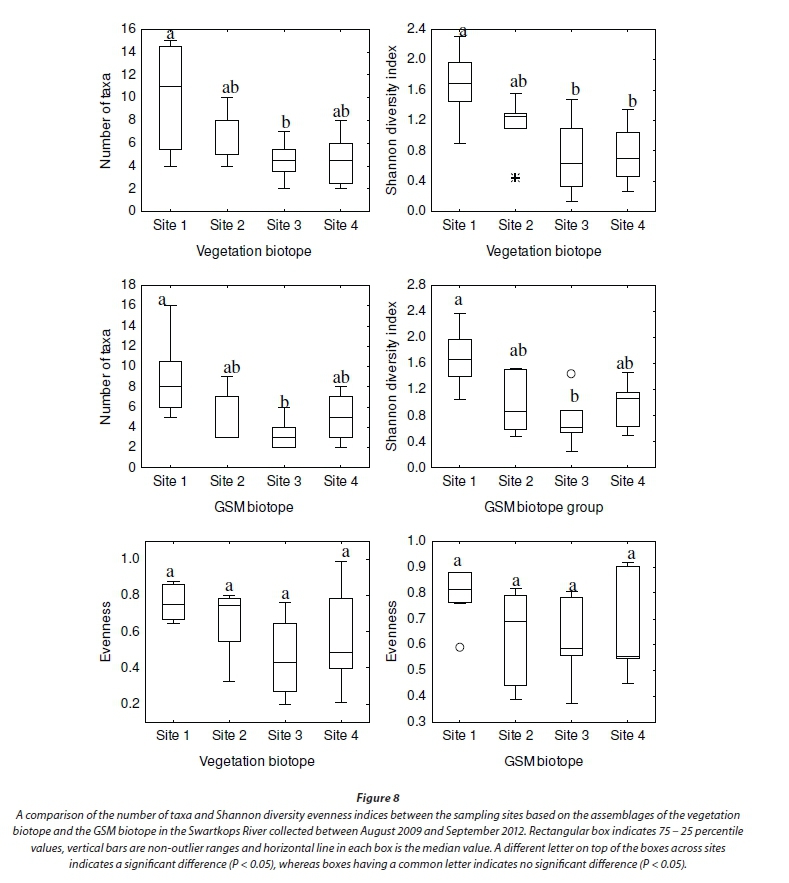
In terms of the individual biotopes, significant differences (P < 0.05) in the number of taxa and Shannon diversity index were observed only between Sites 1 and 3 for the stone-based assemblage. There were no significant differences between the other site pairs (Fig. 7). Evenness was not significantly different between all site pairs. The number of taxa and Shannon diversity index were significantly higher at Site 1 than at Sites 3 and 4 based on the vegetation assemblage (P < 0.05). No significant differences were observed between Sites 2, 3 and 4 (P > 0.05). Evenness was also not statistically different between the sites (Fig. 8). In terms of the GSM biotope-based assemblage, a comparison of the four sampling sites revealed that the number of taxa, and Shannon diversity index differed significantly only between Sites 1 and 3 (P < 0.05) (Fig. 8).
Chironomid community types based on their preferred biotopes
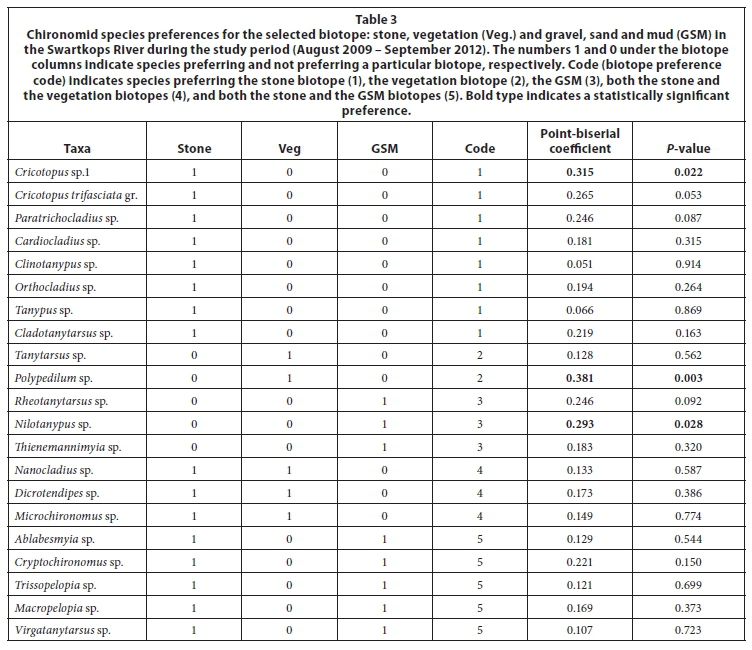
Five chironomid community types were identified based on their association with the selected biotopes (Table 3). The first community type was mainly associated with the stone biotope, and consisted of 8 species: Cricotopus sp.1, Cricotopus trifasciata gr. Paratrichocladius sp., Clinotanypus sp., Orthocladius sp., Tanypus sp. and Cladotanytarsus sp. Of these, only Cricotopus sp.1 showed a significant association with the stone biotope (P < 0.05). The abundance of the stony community was dominated by Cricotopus sp.1, Cricotopus trifasciata gr., Paratrichocladius sp., and Cladotanytarsus sp. The second community type preferred the vegetation biotope, and consisted of only 2 species, i.e., Tanytarsus sp. and Polypedilum sp., with the latter showing a significant preference for vegetation. The third community type was mainly associated with the GSM biotope, and consisted of only 3 species, i.e., Rheotanytarsus sp., Nilotanypus sp. and Thienemannimyia sp. Of these species, only Nilotanypus sp. was significantly associated with the GSM. The fourth community type consisted of 3 species, i.e., Dicrotendipes sp., Microchironomus sp. and Nanocladius sp., that were associated with both the stone and the vegetation biotopes. Dicrotendipes sp. and Microchironomus sp. belong to the subfamily Chironominae, tribe Chironomini, while Nanocladius sp. belongs to the Orthocladiinae subfamily. The last community type, which was mainly associated with both the stone and the GSM biotopes, had 5 species: Ablabesmyia sp., Cryptochironomus sp. Trissopelopia sp., Macropelopia sp. and Virgatanytarsus sp. Species of the predatory Tanypodinae, i.e. Ablabesmyia sp., Trissopelopia sp. and Macropelopia sp., dominated the composition of the fifth community type.
DISCUSSION
In this study, the potential influence of reducing the number of biotope used for chironomid-based bioassessment of aquatic pollution in the Swartkops River was investigated by analysing the chironomid community separately for each biotope and comparing the results with the composite assemblage. The compositing was important in order to examine effects of reducing the numbers of biotopes, by comparing the sites separately based on the assemblages of the individual biotope group (reduction in biotope numbers) and the composite biotopes (combined data from all three biotopes). Since river health monitoring in South Africa is often undertaken by sampling macroinvertebrates from all three distinct biotope groups and the overall health of the river calculated based on the assemblages collected from the three biotope groups, except in rivers where all biotope groups are not represented (Dickens and Graham, 2002; Odume and Muller, 2011), the analysis undertaken in this paper therefore addresses the question of whether assemblages based on any single biotope can give a sufficiently accurate discrimination between the sites, similar to those of all three biotopes combined.
The chironomid assemblages based on the composite biotopes and the stone biotope both indicated significant differences between all site pairs in terms of species abundance and compositions However, the vegetation-based assemblage did not indicated significant differences between Sites 2 and 4. The GSM-based assemblage also did not indicate significant differences between Sites 3 and 4. Thus, only the assemblage based on the stone biotope give a sufficiently accurate result, similar to those of the composite biotope-based assemblage. The vegetation and GSM-based assemblages did not give results similar to those of the composite biotope groups as they did not enable the discrimination of all site pairs of the three downstream sites.
Though the three downstream impacted sites, i.e. Sites 2, 3 and 4, were all within the residential and industrial part of the catchment, they have been found to be different in terms of both water chemistry and biotic deterioration (Odume and Muller, 2011; Odume et al. 2012). The differences in biotic deterioration between the three downstream sites have been attributed mainly to the effluent discharges from the Kelvin Jones WWTW in Uitenhage. The elevated concentrations of nutrients and electrical conductivity as well as depletion of dissolved oxygen recorded at Sites 3 and 4 could be attributed mainly to the effluent influence from the WWTW. Of the biotopes analysed in terms of chironomid assemblages in the present study, apart from the composite biotope-based assemblages, only the stone-based assemblages indicated significant differences between all pairs of the sampling sites, suggesting that when resources are limited the assemblages based on the stone biotope could still provide a sufficiently accurate bioassessment result. This is not surprising because the stone biotope supported more chironomid species than the vegetation and GSM biotopes (Table 3). Stones are morphologically and structurally complex and could support more zoobenthic communities than structurally simpler biotopes such as sand and mud (Wright et al., 1983; Príncipe et al., 2008). Structurally complex biotopes are more likely to support more food and space resources for diverse species (Rosa et al., 2011). Furthermore, structurally complex biotopes providing refugia for benthic fauna are also more likely to support more species than morphologically less-complex biotopes (Epele et al., 2012). This probably explained why more species were associated with the stone biotopes.
Most of the chironomid species recorded in this study were associated with specific biotopes (Table 3). Species traits and ecology could define chironomid preferences for specific biotopes (Armitage et al., 1995; Syrovátka et al., 2009). For example, in the present study, Cricotopus sp.1, Cricotopus trifasciata gr., Paratrichocladius sp., Cladotanytarsus sp., Orthocladius sp., Tanytarsus sp., Polypedilum sp., and Nanocladius sp. preferred either the stone biotope, or the vegetation biotope or both. These species are mostly collector-gatherers and scraper-grazers that feed on particulate organic matter deposited on stone surfaces in pools, or that graze on periphyton materials (Armitage, 1995). The food and feeding habits of these species could partly explain why they were associated with the stone and vegetation biotopes, where they are more likely to encounter their preferred food materials. The predatory Tanypodinae, including Nilotanypus sp. Thienemannimyia sp., Ablabesmyia sp., Trissopelopia sp., and Macropelopia sp. were mostly associated with either the GSM biotope, or the stone biotope, or both. Since the GSM and the stone-out-of-current biotopes occurred mostly in pools, the predatory Tanypodinae avoid the danger of being swept away by currents while searching for food. According to Wielderholm (1983) and Rosa et al. (2011), most species of the sub-family Tanypodinae are adapted to living in pools with large amount of soft sediment. Syrovátka et al. (2009) also found a large proportion of predatory chironomids in pools. Dicrotendipes sp., Cryptochironomus sp., and Virgatanytarsus sp., which were associated with more than one biotope in the present study, have flexible diets that could enable them to occupy several biotopes under different environmental conditions (Armitage et al., 1995).
An important limitation of the study was that the samples were collected at 4 sampling sites in a single river system. These sites were not located very far from each other and, because of system connectivity in lotic ecosystems; could be regarded as not being truly independent samples, but pseudo-replicates. However, the clear point-source impact, e.g. wastewater effluent discharges influencing the river health condition, served to distinguish between the sites. Furthermore, the extended period over which the data were collected, and the number of replicates collected per biotope per site during each sampling event enable robust statistical analysis of the data.
CONCLUSION
This study demonstrated the potential influence of reducing biotope numbers on chironomid species-based bioassessment of the studied river system. Apart from the composite biotope group, assemblage based on the stone biotope provided the best discrimination between the sampling sites. The implication is that, to reduce cost, time and effort, analysing assemblages based only on the stone biotope can provide sufficiently accurate results, similar to using an assemblage combined from all three distinct biotopes. Nevertheless, when stone biotopes are not available, then assemblages based on the composite of vegetation and GSM could be examined for differences between sites. Overall, the study contributes to the understanding of the influence of biotopes on chironomid species-based bioassessment in a region where such studies are scarce, and reinforces the bioindication potential of the chironomids.
ACKNOWLEDGEMENTS
The Carnegie Corporation of New York through the Regional Initiative in Science and Education (RISE) programme is acknowledged for providing a bursary to Dr ON Odume. The South African National Research Foundation (NRF) is also acknowledged for Post-doctoral grant (Grant No: 88517) to Dr ON Odume, which supported the production of this work. Ms Khaya Mgaba is acknowledged for assisting both in the field and laboratory. We thank Dr Ferdy de Moor and Dr Helen Barber-James, both of the Albany Museum, Grahamstown, for taxonomic assistance. The input of three anonymous reviewers greatly improved the quality of the manuscript.
REFERENCES
APHA, AWWA and WPCF (AMERICAN PUBLIC HEALTH ASSOCIATION, AMERICAN WATER WORKS ASSOCIATION AND WATER POLLUTION CONTROL FEDERATION) (1971) Standard Methods for the Examination of Water and Waste Water (13th edn). APHA, Washington D.C. [ Links ]
ARMITAGE PD, CRANSTON PS and PINDER LCV (1995) The Chironomidae - Biology and Ecology of Non-Biting Midges. Chapman and Hall, London. 527 pp. [ Links ]
BARBOUR MT, GERRITSEN J, SNYDER BD and STRIBLING JB (1999) Rapid Bioassessment Protocols for Use in Streams and Wadeable Rivers: Periphyton, Benthic Macroinvertebrates and Fish (2nd edn). EPA/ 841-B-99-002. United States Environmental Protection Agency, Washington DC. [ Links ]
CLARKE KR and WARWICK RM (1994) Change in Marine Communities, an Approach to Statistical Analysis and Interpretation. Plymouth Marine Laboratory, Plymouth UK. 144 pp. [ Links ]
CRANSTON P (1996) Identification guide to the Chironomidae of New South Wales. Australian Water Technologies (Pty) Ltd, West Ryde. 376 pp. [ Links ]
DALLAS HF (2007) The influence of biotope availability on macroinvertebrate assemblages in South African rivers: implications for aquatic bioassessment. Freshwater Biol. 52 370-380. [ Links ]
DE CÁCERES M and LEGENDRE P (2009). Associations between species and groups of sites: indices and statistical inference. Ecology 90 (12) 3566-3574. [ Links ]
DE CÁCERES M. (2013) How to use the indicspecies package (ver.1.6.7). URL: http://cran.r-project.org/web/packages/indicspecies/vignettes/indicspeciesTutorial.pdf (Accessed 24 April 2013). [ Links ]
DEMARS BOL, KEMP JL, FRIBERG N, USSEGLIO-POLATERA P and HARPER DM (2012) Linking biotopes to invertebrates in rivers: biological traits, taxonomic composition and diversity. Ecol. Indic. 23 301-311. [ Links ]
DICKENS CWS AND GRAHAM PM (2002) The South Africa Scoring System (SASS) version 5 rapid bioassessment method for Rivers. Afr. J. Aquat. Sci. 27 1-10. [ Links ]
ENVIRO-FISH AFRICA (2009) C.A.P.E. Estuary Management Programme; Swartkops Integrated Environmental Management Plan: Draft Situation Assessment. Volume 1: Report to the Nelson Mandela Bay Municipality. URL: http://www.google.co.za/url?sa=t&rct=j&q=&esrc=s&source=web&cd=1&ved=0CCYQFjAA&url=http%3A% 2F%2Fwww.nelsonmandelabay.gov.za%2FDocuments.aspx%3FobjID%3D85%26cmd%3Ddownload%26doc ID%3D672&ei=mQsjU46v MoaM0AGV2IHQDQ&usg=AFQjCNEOJoSi8VcaidvtJqzBVxiUvJi2lA&bvm=bv.62922401,d.dmQ (Accessed 20 December 2013). [ Links ]
ENVIRO-FISH AFRICA (2011) C.A.P.E. Estuary Management Programme; Integrated Management Plan: Swartkops Estuary and the Swartkops River Valley and Aloes Nature Reserves. Volume 2. Nelson Mandela Bay Municipality, Port Elizabeth. URL: http://www.google.co.za/url?sa=t&rct=j&q=&esrc=s&source=web&cd=2&ved=0CCwQFjAB&url=http%3A%2F %2Fwww.nelsonmandelabay.gov.za%2FDocuments.aspx%3FobjID%3D85%26cmd%3Ddownload%26doc ID%3D1062&ei=mQsjU46vMoaM0AGV2IHQDQ&usg=AFQjCNHiUDTLU8lQlwZUL--qoI8xGQZIJw (Accessed 20 December 2013). [ Links ]
EPELE LB, MISERENDINO ML and BRAND C (2012) Does nature and persistence of substrate at a mesohabitat scale matter for Chironomidae assemblages? A study of two perennial mountain streams in Patagonia, Argentina. J. Insect. Sci. 12 68. [ Links ]
FERRINGTON LC (2008) Global diversity of non-biting midges (Chironomidae; Insecta-Diptera) in freshwater. Hydrobiologia 595 447-455. [ Links ]
FROMME GAW (1988) Dynamics of the Swartkops Estuary. CSIR/EMA-T 8804. Council for Scientific and Industrial Research, Stellenbosch. [ Links ]
HARRISON AD (2003) Chironomidae. In: Day JA, Harrison AD and De Moor IJ (eds). Guides to the Freshwater Invertebrates of Southern Africa. Vol. 9: Diptera. WRC Report No. TT 201/02. Water Research Commission, Pretoria. [ Links ]
HEYDORN AEF and GRINDLEY JR (1986) Estuaries of the Cape - synopsis of available information on individual systems. Council for Scientific and Industrial Research, Stellenbosch. [ Links ]
KARR JR AND CHU EW (2000) Sustaining living rivers. Hydrobiologia 422/423 1-14. [ Links ]
LENCIONI V AND ROSSARO B (2005) Microdistribution of chironomids (Diptera: Chironomidae) in alpine streams: an autoecological perspective. Hydrobiologia 533 61-76. [ Links ]
ODUME ON and MULLER WJ (2011) Diversity and structure of Chironomidae communities in relation to water quality differences in the Swartkops River, South Africa. Phys. Chem. Earth. 36 929-938. [ Links ]
ODUME ON, PALMER CG, ARIMORO FO, and MENSAH PK (2014) Patterns of chironomid body-size distribution in an effluent-impacted river in the Eastern Cape, South Africa. Afr. J. Aquat. Sci. 39 (4) 377-386. [ Links ]
ODUME ON, MULLER WJ, ARIMORO FO and PALMER CG (2012) The impact of water quality deterioration on macroinvertebrate communities in the Swartkops River, South Africa: a multimetric approach. Afr. J. Aquat. Sci. 37 191-200. [ Links ]
ONDRUS MG (1996) Laboratory Experiments in Environmental Chemistry (2nd edn). Wuerz Publishing Ltd., Winnipeg. [ Links ]
PALMER CG, MULLER WJ and HUGHES DA (2005) Water quality in the ecological Reserve: methods for ecological Reserve assessment within a decision support system (DSS) In: Hughes DA (ed.) SPATSIM, an Integrating Framework for Ecological Reserve Determination and Implementation. WRC Report No. TT 245/04. Water Research Commission, Pretoria. [ Links ]
PORINCHU DF and MACDONALD GM (2003) The use and application of freshwater midges (Chironomidae, Insecta, Diptera) in geographical research. Prog. Phys. Geogr. 27 378-422. [ Links ]
PRÍNCIPE E, BOCCOLINI MF and CORIGLIANO MC (2008) Structure and spatial-temporal dynamics of Chironomidae fauna (Diptera) in upland and lowland fluvial habitats of the Chocancharava River Basin (Argentina). Int. Rev. Hydrobiol 93 342-357. [ Links ]
R CORE TEAM (2013) R: A language and environment for statistical computing. R Foundation for Statistical Computing, Vienna, Austria. URL: http://www.R-project.org/ (Accessed 24 April 2013). [ Links ]
ROSA BFJV, OLIVEIRA VC and ALVES RG (2011) Structure and spatial distribution of the Chironomidae community in mesohabitats in a first order stream at the Poço D'Anta Municipal Biological Reserve in Brazil. J. Insect. Sci 11 36. [ Links ]
SYROVÁTKA V, SCHENKOVÁ J and BRABEC K (2009) The distribution of Chironomid larvae and oligochaetes within a stony-bottom river stretch: the role of substrate and hydraulic characteristics. Fundam. Appl. Limnol. 174 (1) 43-62. [ Links ]
WIEDERHOLM T (1983) Chironomidae of the Holarctic Region. Keys and Diagnoses. Part 1. Larvae, Entomologica Scandinavica 19 (Suppl). 457 pp. [ Links ]
WRIGHT JF, HILEY PD, CAMERON AC, WIGHAM ME and BERRIE AD (1983) A quantitative study of the macroinvertebrate fauna of five biotopes in the River Lamboun, Berkshire, England. Arch. Hydrobiol.96 271-291. [ Links ]
ZUUR AF, IENO EN and SMITH GM (eds) (2007) Analysing Ecological Data. Springer Science + Business Media, New York. 672pp. [ Links ]
Received 4 April 2014
Accepted in revised form 5 March 2015
* To whom all correspondence should be addressed. ☎ +27 (73) 030-2687; e-mail: nelskaro@yahoo.com
APPENDIX


