


Serviços Personalizados
Artigo
 Inglês (pdf)
 Artigo em XML
 Referências do artigo
Indicadores

Links relacionados
-
 Citado por Google
 -
 Similares em Google
Compartilhar

 Permalink
Water SA
versão On-line ISSN 1816-7950
versão impressa ISSN 0378-4738
Water SA vol.41 no.3 Pretoria Abr. 2015
http://dx.doi.org/10.4314/wsa.v41i3.02
Water footprint assessment to inform water management and policy making in South Africa
M PahlowI, *; J SnowballII; G FraserII
ITwente Water Centre, Water Management Group, University of Twente, 7500 AE Enschede, The Netherlands
IIDepartment of Economics and Economic History, Rhodes University, Grahamstown, 6140, South Africa
ABSTRACT
One method to inform decisions with respect to sustainable, efficient and equitable water allocation and use is water footprint assessment (WFA). This paper presents a preliminary WFA of South Africa (SA) based on data for the period 1996-2005. Crop production was found to contribute about 75% of the total water footprint of national production. The total water footprint of crop production is mainly composed of five crops: maize, fodder crops, sugarcane, wheat and sunflower seed, which account for 83% of the crop water footprint. The average water footprint of a South African consumer is 1 255 m3/yr, below the world average of 1 385 m3/yr, and is dominated by the consumption of meat (32%) and cereals (29%). About one fifth of this water footprint of consumption is external to SA. While SA is a net virtual water importer, the virtual water trade analysis revealed that a large share of blue water consumption is related to export. Sustainability concerns are that the major river basins face severe blue-water scarcity for extended periods of the year, and that water pollution levels related to nitrogen and phosphorus were found to be unsustainable in all river basins in SA. Efficient allocation and use of water is investigated by means of comparing the consumptive water footprint to global benchmark values, as well as the economic green- and blue-water productivity and the economic land productivity of the crops cultivated in SA. Furthermore, crops with specific potential for biofuel production are assessed. Lastly, recommendations to address the identified issues are given.
Keywords: water footprint assessment; water management; water policy
INTRODUCTION
Under the Apartheid system, access to water was based largely on riparian rights, and thus linked to land ownership. Since Black South Africans could not own land, except in specially designated 'homeland' areas, this system favoured white commercial farmers, who had the right to use water to which they had access (Dollar et al., 2010; Kemerink et al., 2011). The National Water Act (NWA, No. 36 of 1998) (RSA, 1998) took a radically different approach. It recognised that water has the potential for being 'a powerful tool for restructuring society' (Dollar et al., 2010) and required that its allocation be used to help address the injustices of the past, and to combat rural poverty and underdevelopment (Molobela and Sinha, 2011). In this model, central government acts as a trustee, but most water allocation decisions are to be made at provincial and catchment levels, using a system of participatory, integrated water resource management. Equitable distribution, along with sustainability and efficiency, are the principles of the NWA. Although payment for ecosystem services is still a contentious issue in South Africa (SA), the NWA includes this important issue and is one of the few water acts that requires that an 'ecological Reserve' be set aside, i.e., the minimum flow level needed to ensure ecosystem health. Despite the good intentions of the NWA, the respective water allocation and management institutions need to be supported with information regarding optimum management strategies in order to put these plans successfully into practice.
Furthermore, on 15 January 2014, the Department of Energy released the long-awaited position paper on the South African Biofuels Regulatory Framework. It announced that, by 1 October 2015, it will be mandatory for 2% of all liquid fuels in SA to be supplied by biofuels, estimated to be 393 million ℓ/yr of bio-ethanol and 970 million ℓ/yr of biodiesel (SA Biofuels Regulatory Framework, 2014). While the Framework does take into account the implications of the policy for water use, trade-offs between the water use and yield per hectare of different feedstock crops are not explicitly considered. Hence there is an urgent need to provide such information in order to support decision makers.
A recent paper by Siebrits et al. (2014) identified priority water research areas in SA. Among the most important research questions that emerged from this work were 'allocative efficiency' and 'sustainable development'. In light of the issues regarding the implementation of the NWA and biofuel development in SA, plus the priority research areas identified by Siebrits et al., we present here a first water footprint assessment (WFA) for South Africa. This paper seeks to demonstrate how WFA can be used to support the addressing of environmental sustainability and economic efficiency concerns of water allocation and use in the South African context, thereby informing water management and policy making to identify appropriate strategies and to set sustainability targets.
METHOD
The analysis was carried out according to the methodology set out in the Water Footprint Assessment Manual (Hoekstra et al., 2011). The water footprint (WF) is a measure of a human's appropriation of freshwater resources, considering both direct and indirect water use (Hoekstra et al., 2011). It is a multidimensional indicator, showing water consumption volumes (evaporated or incorporated into a product) by source and polluted volumes by type of pollution, whereby all components of a total water footprint are specified geographically and temporally. The water footprint is generally expressed in terms of water volume per unit of time or water volume per unit of product. Depending on the goals and scope of the analysis it can also be expressed as volume per monetary unit, per number of jobs, or per nutritional value, among others.
The water footprint is composed of three colours: green, blue and grey (Hoekstra et al. 2011). The green process water footprint is the volume of green water (rainwater) consumed during the production process of a good. It is the total rainwater evapotranspiration plus the water incorporated in the product. The blue-water footprint refers to consumption of blue-water resources (surface- and groundwater). The blue-water footprint of a process is defined as the sum of blue-water evapotranspiration, blue water incorporated into a product and lost return flow (water not returning to the same catchment area or water that is not returned in the same time period). It should be noted that consumptive use of blue water is generally smaller than water withdrawal, because water withdrawals partly return to the catchment. The blue-water footprint is hence the 'net water withdrawal'. The grey-water footprint of a product, or production phase of a good, is an indicator of the degree of freshwater pollution that can be associated with production. It is the volume of freshwater that is required to assimilate the load of pollutants based on existing ambient water quality standards (Hoekstra et al., 2011). The grey-water footprint is determined by dividing the pollutant load by the difference between the maximum acceptable concentration for that pollutant and its natural concentration in the receiving water body.
Water footprint assessment (WFA) is a method to quantify water use, assess its sustainability and prioritise where to reduce a particular water footprint and at the same time make it more sustainable, efficient and equitable. The water footprint concept is rooted in the recognition that human impacts on freshwater systems can ultimately be linked to human consumption, and that water shortages and water pollution can be better understood and addressed by considering production and supply chains as a whole (Hoekstra et al., 2011). WFA comprises (i) setting goals and scope; (ii) quantification and location of the water footprint of a process, product, producer or consumer, or quantification in space and time of the water footprint in a specified geographic area; (iii) assessment of the environmental, social and economic sustainability of this water footprint; and (iv) formulation of a response strategy. As Hastings and Pegram (2012) and Vanham and Bidoglio (2013) point out, determining and assessing water footprints, in particular for river basins, is challenging in terms of data requirements, and the method still needs to be refined further, particularly with respect to grey-water footprint accounting (recent advances are shown by Franke et al. (2013)), and in terms of social and economic sustainability assessment.
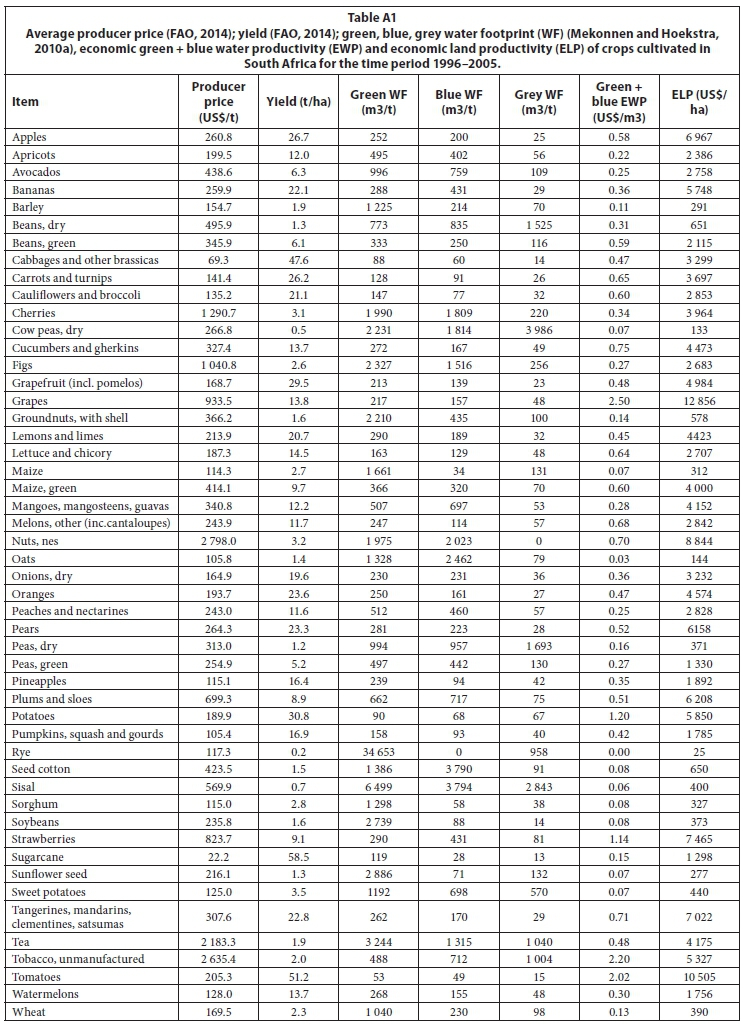
The goals and scope (Phase 1) of the water footprint assessment carried out here are a coarse resolution WFA for South Africa as a whole, to identify priority products, hotspot regions, and related sustainability issues, and to provide recommendations on options to improve the current situation. In Phase 2, the accounting phase, the water footprint of production, the virtual water trade, and the water footprint of consumption are determined. We strive to provide a rather comprehensive evaluation by including various environmental and economic aspects in the sustainability assessment (Phase 3) presented here. Two aspects of environmental sustainability are considered. We compared - per catchment - the blue-water footprint to blue-water availability, i.e., the blue-water scarcity (Hoekstra et al., 2012) and the nitrogen- and phosphorus-related grey-water footprints to available assimilation capacity, i.e., the water pollution level (Liu et al., 2012). Furthermore, we consider economic sustainability through assessment of water use efficiency in the region, which was analysed by means of economic green- and blue-water productivities of crops, calculated by dividing the producer price (US$/t) by the water footprint of the product (m3/t). The economic land productivity was determined as the product of yield (t/ha) and producer price (US$/t). A similar analysis is conducted for potential biofuel feedstocks. Lastly, the consumptive (green + blue) water footprints of crop production were compared to global benchmark values to identify the potential for water footprint reduction per crop. Based on the results obtained in Phases 2 and 3, in the response formulation phase (Phase 4) potential measures are discussed; however, detailed follow-up analyses with high-resolution data should be carried out to determine the most effective strategies for specific local situations. In addition the potential for incorporating results from such an assessment in policy decisions is discussed.
DATA
The underlying water footprint data for crop production in SA that were utilized in this study stem from Mekonnen and Hoekstra (2010a), who estimated the global water footprint of crop production for the time period 1996-2005 with a crop water-use model at a 5 by 5 arc minute spatial resolution. The water footprints of grazing and animal water supply were obtained from Mekonnen and Hoekstra (2010b). The virtual water import and export data related to trade of agricultural and industrial products are from Mekonnen and Hoekstra (2011). Data on blue-water scarcity were obtained from Hoekstra et al. (2012) and the water pollution level data stem from Liu et al. (2012). Data on yield and producer price per crop were obtained from FAOSTAT (FAO, 2014). Furthermore, the consumptive water footprint benchmarks for crop production of Mekonnen and Hoekstra (2013) were employed.
WATER FOOTPRINT ACCOUNTING FOR SOUTH AFRICA
To date there have been a limited number of detailed water footprint studies undertaken in SA. For example, SABMiller, together with WWF-UK, investigated the water footprints of crops for beer production, such as barley in the Northern Cape Province and maize in the North West Province (SABMiller and WWF-UK, 2009). Preliminary investigations have also been carried out by the Breede-Gouritz Catchment Management Agency (formerly Breede-Overberg Catchment Management Agency), and specifically for one catchment, the Breede-Overberg (BOCMA, 2011). This paper presents a first WFA of SA as a whole, based on data for the time period 1996-2005.
Water footprint of production
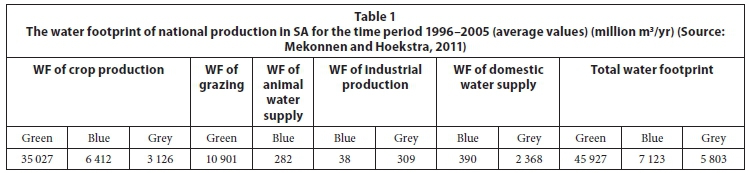
The total water footprint (green, blue and grey) of national production for the period 1996-2005 in SA was 58 853 million m3/yr (Mekonnen and Hoekstra, 2011), which is 0.6% of the total global water footprint of production. The green-water footprint has the largest share (78.0%), followed by blue (12.1%) and grey (9.9%). The total water footprint of national production consists of crop production (75.7%), grazing (18.5%), domestic water supply (4.7%), industrial activities (0.6%) and livestock production (drinking and service water) (0.5%) (see Table 1).
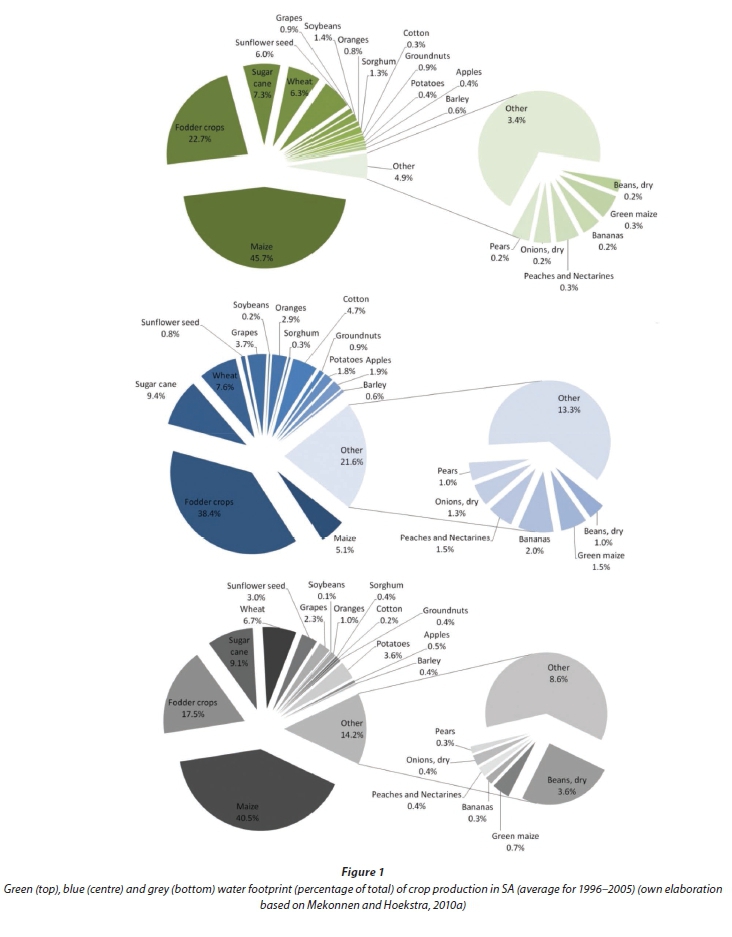
The green-water footprint of crop production is dominated by 5 crops. Maize contributes almost 46% to the total green-water footprint, followed by fodder crops with a share of some 23%, sugarcane with 7%, and wheat and sunflower seed, both contributing about 6%. In the case of the blue-water footprint 7 crops - fodder crops (38%), sugarcane (9%), wheat (8%), maize (5%), cotton (5%), grapes (4%) and oranges (3%) - have a share of 3% or more. The grey-water footprint in crop production is also largely due to 7 crops: maize (41%), fodder crops (18%), sugarcane (9%), wheat (7%), dry beans (4%), potatoes (4%) and sunflower seed (3%). The top 20 crops in terms of total water footprint of production shown in Fig. 1 account for 97% of the green-, 87% of the blue- and 91% of the grey-water footprint. The total (green, blue and grey) water footprint of crop production is dominated by maize, fodder crops, sugarcane, wheat and sunflower seeds, which together account for 83% of the water footprint.
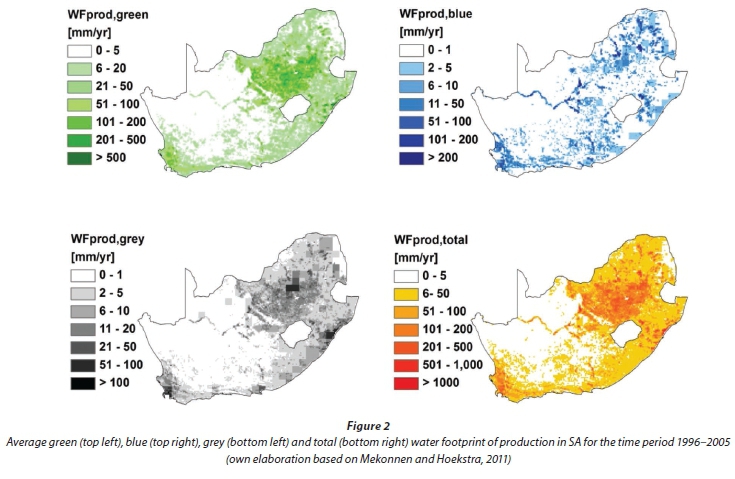
The spatial distributions of the green, blue, grey and total water footprints of national production in SA are shown in Fig. 2. The largest total-water footprints of production are located in regions of the Limpopo, North West, Mpumalanga, Gauteng and Free State Provinces, and in coastal regions of KwaZulu-Natal as well as in coastal regions of the Western Cape.
Virtual water trade
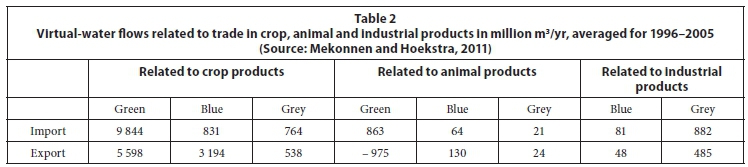
The total virtual water import to SA in the period 1996-2005 was 13 350 million m3/yr. About 86% of the virtual water imports relate to imported crops and crop products, 7% to imported industrial products and 7% to imported animal products (Table 2). The total virtual water export from SA in the period 1996-2005 was 11 991 million m3/yr. Since virtual water imports were larger than virtual water exports, SA is a net virtual water importer. The virtual water export is dominated by export of crop products (78%), followed by animal products (18%) and industrial products (4%).
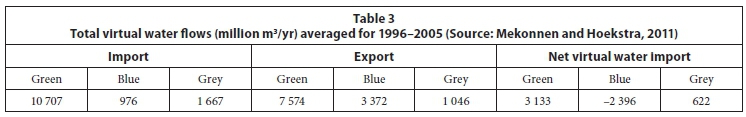
Table 3 provides a summary of the total virtual water flows of SA. For both import and export, the green component of the water footprint has the largest share, whereas the imported grey-water footprint component is larger than the grey-water footprint for export. A relatively large volume of blue water, 3 372 million m3, is related to export, while 976 million m3 are imported.
Water footprint of consumption
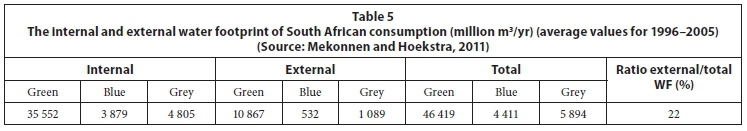
The water footprint of a consumer in SA in the period 1996-2005 (average total population 1996-2005: 45 184 000) was, on average, 1 255 m3/yr (Table 5). This is below the world average, which is 1 385 m3/yr (Hoekstra and Mekonnen, 2012).
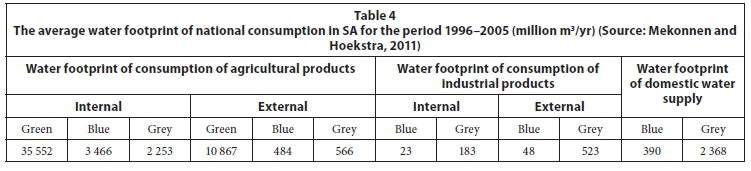
The total water footprint of consumption in SA is 56.7 billion m3/yr over the period 1996-2005. The largest water footprint component is the green water, with 82% of the total water footprint of consumption. The blue- and grey-water footprints of national consumption are 8% and 10% of the total. The largest fraction (93.8%) of the total water footprint of South African consumers relates to the consumption of agricultural products. The consumption of industrial products and domestic water supply contribute 1.4% and 4.8% to the total water footprint of consumption, respectively (Table 4).
The internal water footprint of South African consumption is mainly due to the consumption of agricultural products, followed by domestic water supply and industrial products. The external water footprint is largely due to the import of agricultural products for domestic consumption and, to a smaller extent, due to the import of industrial products. It is interesting to note that the ratio of external to total water footprint of consumption is higher for industrial products (74%) than for agricultural products (22%). However, this not surprising, as SA imports the majority of its capital equipment and this practice has been growing at a faster rate than commodity imports (Edwards and Lawrence, 2006). For the agricultural sector, the ratio of the external to the total water footprint is significantly higher for the green-water footprint (20%) than for the blue (1%) or the grey-water footprint (1%). For the industrial sector, the external blue-water footprint to total industrial water footprint ratio is 6%, whereas this figure for the grey component is 67%.
About 78% of the water footprint of South African national consumption is internal and 22% is external (Table 5). Hence about one fifth of the water resources consumed or polluted to make all products consumed by South African citizens are located outside of the country (see Figs 3 and 4).
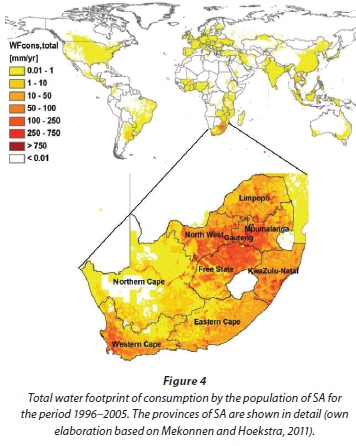
Figure 3 shows the geographic distribution of the green-, blue- and grey-water footprint of consumption by South African citizens. Please note that values less than 0.01 mm/yr have been excluded in order to provide a clearer picture of the most important regions regarding the water footprint of consumption.
Figure 4 shows the geographic distribution of the total water footprint (combined green, blue and grey) of consumption by the population of SA and provides an enlarged view of the provinces of SA.
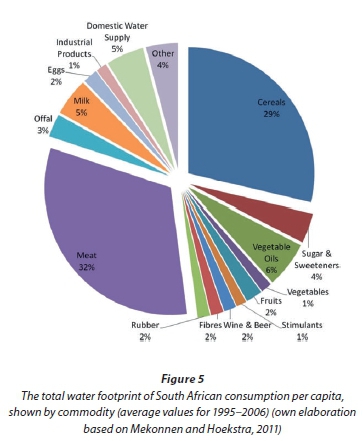
The two largest shares of the total water footprint of South African consumption are meat with 32%, followed by cereals with 29% (Fig. 5). Vegetable oils (6%), milk and domestic water supply (each 5%) are other large contributors. Sugar and sweeteners, and offal, contribute 4% and 3%, respectively. Eggs, fruits, wine and beer, fibres and rubber each have a 2% share in the total water footprint of consumption.
WATER FOOTPRINT SUSTAINABILITY ASSESSMENT
Environmental sustainability
Blue-water scarcity
Blue-water scarcity in a river basin in a certain period is defined here according to Hoekstra et al. (2011) as the ratio of the total blue-water footprint in the river basin to the blue-water availability in the basin, thereby accounting for environmental flow requirements (EFR). The presumptive EFR standard used here suggests that 80% of the natural runoff is allocated as an environmental flow requirement. The remaining 20% can be considered as blue water available for human use without affecting the integrity of the water-dependent ecosystems (Richter et al., 2012). If the environmental flow requirement (or ecological Reserve, as titled in the NWA) is known from local studies for a certain river basin - e.g., as part of the catchment management strategy - then those data should replace the precautionary approach used here. It must also be mentioned that the Government may choose to allow more than 20% of natural runoff to be appropriated for other purposes, thereby accepting potential adverse ecological consequences.
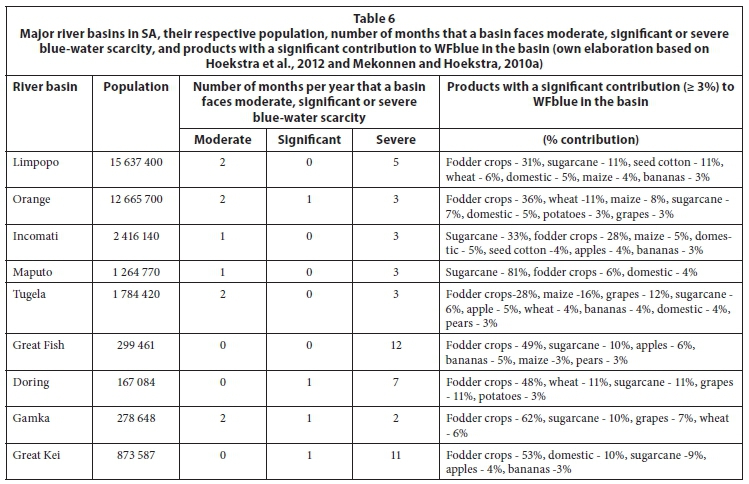
Blue-water scarcity values have been classified, according to Hoekstra et al. (2012), into 4 levels of water scarcity: low (< 1, i.e. the blue-water footprint divided by the blue-water availability is less than 1; blue-water footprint is less than 20% of natural runoff; EFR not violated), moderate (1-1.5; blue-water footprint is between 20% and 30% of natural runoff; EFR violated), significant (1.5-2; blue-water footprint is between 30% and 40% of natural runoff; EFR violated) and severe (> 2; blue-water footprint is larger than 40% of natural runoff; EFR violated). Table 6 summarizes the results of the analysis of the water-scarcity indicator and the related products with a significant contribution to the blue-water footprint in the respective basin.
All river basins are facing severe blue-water scarcity for at least 2 months (Gamka), and for up to 12 months (Great Fish), a year; i.e., at this time the water footprint is two or more times the blue-water availability. Furthermore, several basins experience moderate and significant blue-water scarcity in additional months of the year. While there are differences with respect to the most significant crops in the individual river basins, it can be seen that, overall, a few crops play the most significant role, in addition to domestic water consumption.
It must be noted that the blue-water scarcity indicator used here does not account for inter-basin transfer schemes. Hence, the blue-water scarcity in the Great Fish River basin does not take into consideration the Orange River Project, which transfers water from the Orange River to the Great Fish River through a series of tunnels and canals. The scheme has a maximum transfer rate of 54 m3/s. The water is also transferred from the Great Fish River to the Sundays River. One of the main aims of the Orange River Project was to vitalise the fertile but water-scarce Great Fish River and Sundays River valleys. The area of land scheduled to be brought under irrigation in the project was 76 000 ha. The actual area under irrigation is about 55 000 ha, which is a substantial increase from the original 13 000 ha. Yet it should also be mentioned that the enlarged irrigation area has increased the level of leaching of fertilizers into the Fish River.
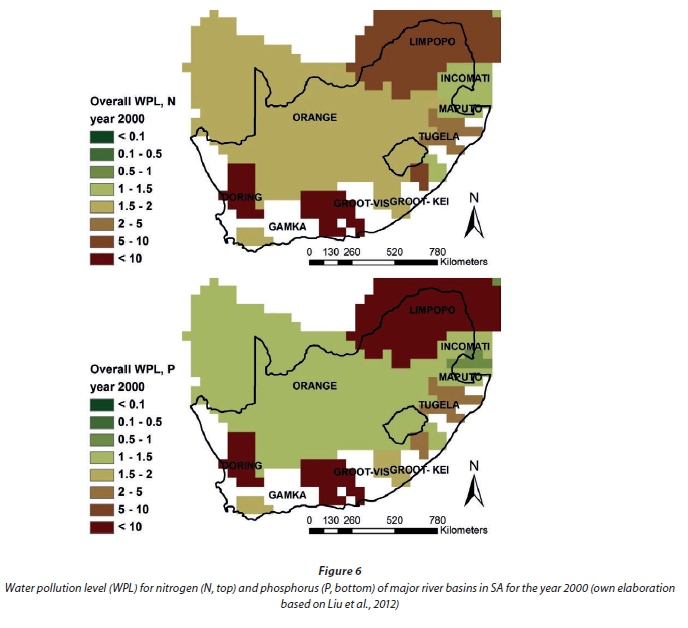
Water pollution
Anthropogenic pollution due to nitrogen (N) and phosphorus (P) in SA has been investigated using the 'water pollution level' (WPL) as defined by Hoekstra et al. (2011). WPL is the ratio of the total grey-water footprint in an area (typically a watershed, or a catchment or a river basin) to the actual run-off of the watershed under study. For WPL values exceeding 1.0, ambient water quality standards are violated. From Fig. 6, it can be seen that in all river basins considered the WPL for N is higher than 1.0 (for the study year 2000). Particularly high N-related WPL levels are found in the Limpopo basin and in basins along the coast. The situation has been found to be similar for pollution due to phosphorus (Fig. 6).
Water pollution may aggravate water scarcity, since the polluted water may pose a health risk, reduce water productivity in crop production, and become unsuitable for other purposes. Hence, the WPL indicator provides additional information to determine the sustainability of freshwater use and allocation.
Water use efficiency
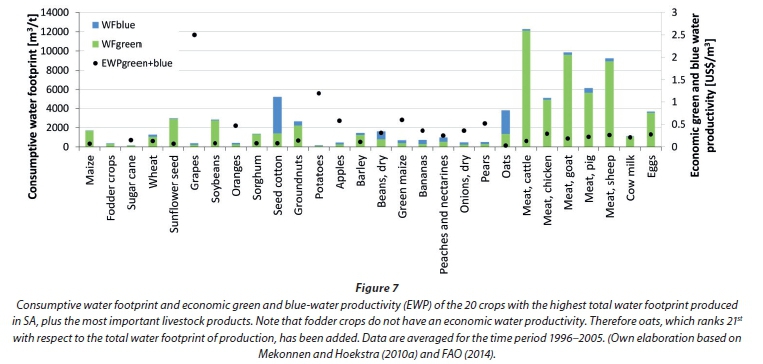
To evaluate the efficiency of allocation and use of water resources we investigated those 20 crops (out of 51 - see Appendix) that have the largest average total water footprint of production for the time period 1996-2005 in SA (see also Fig. 1). These 20 crops account for 97% of the total green-, 87% of the total blue- and 91% of the total grey-water footprint of production, and overall for 95% of the average total water footprint of production for the time period 1996-2005. In addition we consider the most important livestock products.
Figure 7 shows the total consumptive (green- and blue-) water footprints and the economic green- and blue-water productivity of the major crop and livestock products in SA. Grapes, potatoes, green maize, apples, pears, and oranges have a relatively high economic green and blue-water productivity, while at the same time their consumptive water footprint is relatively low compared to other crops that are considered here. In particular seed cotton and oats have a large share of the blue-water footprint of production to total consumptive water footprint, with less economic water productivity than most other crops. Meat products do have a large consumptive water footprint overall, for which the main portion is green water. Their economic water productivities do not rank particularly high.
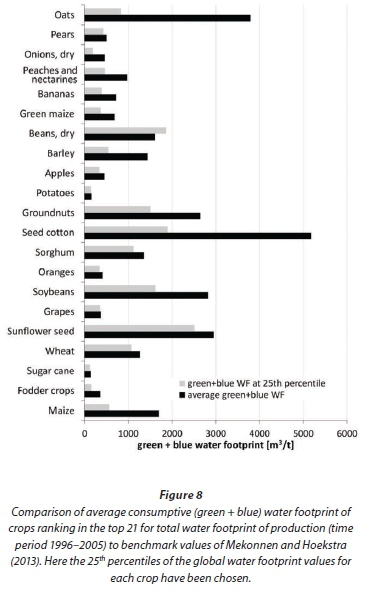
We compare the average combined green- and blue-water footprint values of the most important crops produced in SA with global benchmark values at the best 25th percentile of production of Mekonnen and Hoekstra (2013) to identify the potential for increasing water productivities per crop. It can be seen from Fig. 8 that most of the average consumptive crop water footprints in SA are larger than the global benchmark values.
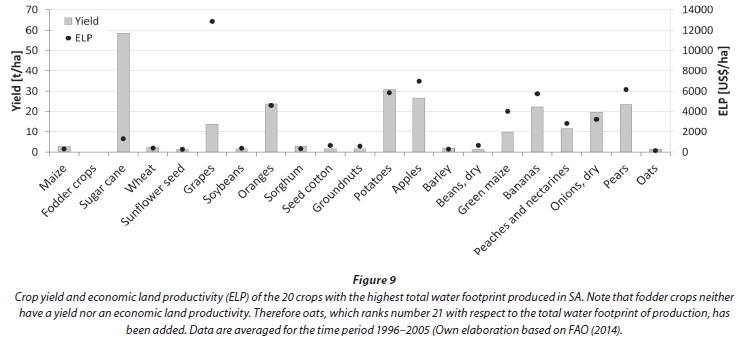
The average yield for the crops considered and the related economic land productivity are shown in Fig. 9. Grapes, apples, pears, potatoes, bananas, oranges and green maize stand out regarding the economic land productivity. Yield is a determining factor and is one of the key aspects for decision making, e.g., in the debate regarding biofuel production in SA. However, several aspects must be considered to arrive at sustainable solutions.
In order to address concerns about food security, the Biofuels Regulatory Framework (SA Department of Energy, 2014) currently excludes maize (a staple food in SA) and sugarcane (because of irrigation requirements) from biofuel crops, despite arguments from industry that these crops are most productive for biofuels and currently produced in SA (Business Day, 2014; Letete and Von Blottnitz, 2012; SA Civil Society Information Service 2012); see also Fig. 9. Instead, the first phase will consider only grain sorghum (for bio-ethanol) and soybeans (for bio-diesel). Licensed producers will also have to conform to other requirements in order to be granted the subsidy, such as 25% ownership by Black South Africans, a minimum of 10% of feedstocks being sourced from Black smallholder farmers, and, if irrigation is required, a detailed motivation for how this will be done 'without negatively impacting the country's constrained water resources'. A Water Research Commission (WRC) scoping study on water use of biofuel crops in SA found that soybean production (mainly in the eastern part of the country) would, for the most part, not use more water (i.e. reduce runoff) than the dominant indigenous vegetation ('veld type') (Jewitt et al., 2009).
In Table 7 crops cultivated in SA with potential for ethanol and biodiesel production are compared regarding their efficiency in terms of water consumed or polluted per GJ of ethanol/biodiesel produced and litres of water consumed or polluted per litre of ethanol/biodiesel produced.
Notable is that rainfed rye has a comparatively high green-water footprint. This is due to the extremely low rye yield in SA (average for 1996 to 2005: 211 kg/ha). SA even had the lowest yield (in terms of kg/ha) of all rye-producing countries worldwide (FAO, 2014). Rye also has the highest nitrogen-related grey-water footprint of the ethanol-producing crops studied. Paddy rice stands out with the highest blue-water footprint, while having a zero grey-water footprint. Wheat, barley, maize, sorghum, potato and sugarcane must, depending on the goal with respect to sustainable production, be assessed separately. Goals could be, e.g., overall reduction of the water footprint, reduction of the blue-water consumption and/or reduction of pollution. As can be seen from Table 7, depending on the goal the selection will be different among these six crops. For example, for sorghum the total water footprint is 137 m3/GJ ethanol, which is similar to the total water footprint of wheat (135 m3/GJ ethanol), less than that of maize (182 m3/GJ ethanol) and barley (148 m3/GJ ethanol), but higher than that of potatoes (73 m3/GJ ethanol) and sugarcane (69 m3/GJ ethanol). Sorghum has a lower blue-water footprint than sugarcane, barley, potatoes and wheat. Of those six crops, only the blue-water footprint of maize is lower than that of sorghum. Sorghum has the lowest grey-water footprint (except for rice). Yet while the green-water footprint of sorghum is lower than that of maize (166 m3/GJ ethanol), it is higher than that of barley (120 m3/GJ ethanol), wheat (102 m3/GJ ethanol), sugarcane (51 m3/GJ ethanol) and potatoes (29 m3/GJ ethanol). When turning to crop options for biodiesel production seed cotton has both the highest overall water footprint and the highest blue-water footprint. The other crop options investigated here will again be ranked differently depending on the goal that is pursued, i.e., overall water footprint reduction, reduction of the green-, blue- or grey-water footprint. Further criteria will, needless to say, also play a role when making a decision regarding crop choice.
RESPONSE FORMULATION AND DISCUSSION
Based on the results of the water footprint accounting and the water footprint sustainability assessment, several recommendations to address the issues identified can be provided. The focus lies on blue-water scarcity, water pollution and water use efficiency. Some measures will result in improvements in one, two or all three of these issues.
Agronomic measures
The blue-water footprint exceeded blue-water availability in several basins for several months of the year. There is a large potential to reduce the consumptive water footprint of crop cultivation in SA. By applying individual best management practices to, e.g., reach the benchmark values of the level of the best 25th percentile of global production, substantial water savings are feasible for most of the crops considered here in detail (see Fig. 8). Rockström et al. (2007) point out that, while climatic factors play an important role for yields and evapotranspiration, the consumptive water use of a crop is largely determined by agricultural management. Blue-water footprint reduction can in general be achieved by increasing yield and/or reducing non-beneficial evapotranspiration. While improvements solely in irrigated agriculture will have merit, the largest potential for reduction lies in rainfed agriculture and supplemental irrigation (see Fig. 7 and Appendix). Devising strategies to improve green-water productivity may lead to lower blue-water requirements and can support efforts to reduce the blue-water footprint, thereby helping to alleviate blue-water scarcity in hotspot regions. Optimum agronomic management strategies to reduce the pressure on freshwater resources in SA will combine crop management (improving crop water and nutrient uptake), water management (improving water availability), soil management (improving infiltration and soil water-holding capacity) and nutrient management (improving nutrient availability). These strategies need to be deduced for a given system and cannot be provided based on this country-wide assessment.
Water pollution should be reduced or avoided altogether in all sectors. From Fig. 6 it can be seen that pollution levels with respect to nitrogen and phosphorus are unsustainable in a great many river basins. We leave the determination of specific measures for future research.
Trade
The cultivation and successive trade of crops with relatively high economic return and comparably small negative impact on freshwater resources can become part of wise water governance. The analysis showed that grapes, potatoes, green maize, apples, pears and oranges have a relatively high economic green- and blue-water productivity, while at the same time their consumptive water footprint is relatively low compared to other crops that are considered here. It should be noted that in earlier work for the Breede-Overberg river basin the economic blue-water productivity of grapes was found to be particularly high (BOCMA, 2011). Furthermore, investment in import of water-demanding crop varieties can help to alleviate water scarcity. An example in SA is the case of rice. Policy may include incentives to use the resources on higher value crops and in a more efficient way. To put adequate strategies into practice, functional and efficient water allocation and management institutions are required. Yet, despite the 15 years that have elapsed since the enactment of the NWA, by March 2012, only 2 (out of the original 19 envisaged) catchment management agencies were operational, with another 6 being gazetted and awaiting approval (PMG, 2012). There has since been a reorganisation of the original 19 designated water management areas into 9 larger ones in an attempt to overcome the capacity constraints in some areas.
Choice of cultivars
Another option to find the optimum of environmental sustainability and economic efficiency is that various cultivars could be evaluated regarding their suitability for more intensive cultivation, thereby potentially (partially) replacing less optimal crops. Examples of crops with comparably high economic water productivity that receive less consideration at present are tobacco, tomatoes, strawberries, cucumbers and tangerines. Except for tobacco, these crops exhibit a comparably low consumptive water footprint (see Appendix). For a certain region an alternative crop variety may pose an opportunity to raise both sustainability and efficiency.
Consumption patterns
The analysis showed that the water footprint of a consumer in SA is, on average, to a large extent determined by consumption of livestock and cereal products. A change in the consumption pattern, thereby reducing meat consumption, can reduce the water footprint of consumption significantly. This has been shown by Vanham et al. (2013) in detail for European diets. This will certainly be a challenge, as per capita incomes are rising and the demand for meat is increasing. Awareness of consumers must be raised regarding this issue.
Decisions on biofuel production to include information on water consumption and pollution
Issues of sustainability and the use of limited resources, such as water, are raised throughout the Biofuels Regulatory Framework (SA Department of Energy, 2014), but tempered by statements such as: 'However, a cautionary approach ought to be adopted when introducing sustainability criteria for liquid biofuels as compliance thereto normally comes at a premium for investors' (p. 7). This is expected, since environmental impacts and sustainability have generally had a low priority in the biofuels industry in African countries, with success being measured primarily through economic profits and job creation (Amigun et al., 2011). The focus is still very much on first-generation biofuel feedstock crops, such as sorghum, maize, soybeans and sugarcane, and is likely to remain so in SA for some time. We provided an evaluation of the water footprint of crops currently cultivated in SA that are suitable for biofuel production, in order to support decision making. More developed industries are now moving to second-generation non-food feedstocks, biomass and bio-waste. Third-generation biofuels from algae are still in the experimental stages (Biofuels UK, 2014), but promising results have been reported (Gerbens-Leenes et al., 2014). Both of these have the potential to decrease the water footprint of biofuels significantly in the future.
One potential crop for first generation ethanol production not included here is sugar beet, as it is at present not being produced on a large scale in SA. However, Nasterlack et al. (2014) report on a proposed bioethanol project in the Cradock area, located in the Great Fish River Valley of the Eastern Cape in SA. Agricultural sugar beet production trials have been conducted in the Great Fish River Valley for more than a decade, with promising yield results. Agricultural activity would take place on existing farmland, or on biomes classified as 'least concern'. However, due to the regional climate, crops are grown exclusively under irrigation in this region. Therefore a detailed assessment of the crop water consumption and pollution is required to assess the suitability and sustainability of sugar beet production for ethanol. In this context it must be noted that in a global assessment by Gerbens-Leenes et al. (2009) of the water footprint of crops that contribute most to global agricultural production, it was found for ethanol production that sugar beet, and potato (60 and 100 m3/GJ) had the lowest combined green- and blue-water footprint, followed by sugarcane (110 m3/GJ). In that global assessment sorghum had the highest water footprint (400 m3/GJ). For biodiesel, soybean and rapeseed had the lowest combined green- and blue-water footprint values (around 400 m3/GJ).
CONCLUSIONS
Water resource management is one of the pillars of agriculture and hence food security, of energy and hence energy security, of industry and industrial production and of domestic water supply. The same holds for its importance for trade and development planning, and it is therefore advisable to link water policy with other policies, such as environmental, agricultural, industrial, economic, energy, trade and foreign policies as well as with international cooperation. By means of this first national water footprint assessment of SA, a comprehensive picture of water consumption and pollution, related issues and potential solutions are provided. Efforts by catchment management agencies should be undertaken to carry out assessments at higher spatial resolution using current local data, to evaluate trends and to include social aspects, in particular, equity of water allocation, in addition to environmental and economic aspects in the sustainability assessment. While data requirements of such assessments will pose a challenge, the information obtained and the strategies derived therefrom can be instrumental, so that the water resources of SA are used, controlled, managed, conserved, developed and protected for the benefit of all. Such assessments can also provide supplementary information to the South African Water Resource Classification System.
ACKNOWLEDGEMENTS
We would like to thank Mesfin M Mekonnen of University of Twente for providing various datasets for this study. We also thank Alan Collins of University of Portsmouth for providing comments on an early version of the manuscript. We very much appreciate the excellent comments of two anonymous reviewers, which helped to improve the manuscript substantially.
REFERENCES
AMIGUN B, MUSANGO JK and STAFFORD W (2011) Biofuels and sustainability in Africa. Renewable Sustainable Energy Rev. 15 1360-1372. [ Links ]
BIOFUELS UK (2014) Third generation biofuels. URL: http://biofuel.org.uk/third-generation-biofuels.html (Accessed 18 November 2014). [ Links ]
BOCMA (2011) Breede-Overberg Catchment Management Strategy, Breede-Overberg Catchment Management Agency, South Africa. URL: http://www.bocma.co.za (Accessed 8 February 2013). [ Links ]
BUSINESS DAY (2014) Biofuel rules needed soon for production. Business Day 6 February 2014. URL: www.bdlive.co.za (Accessed 24 February 2014). [ Links ]
DOLLAR E, NICOLSON C, BROWN C, TURPIE J, JOUNERT A, TUTON A, GROBLER D, PINAAR H, EWART-SMITH J and MANGYAKA S (2010) Development of the South African Water Resource Classification System (WRCS): A tool towards the sustainable, equitable and efficient use of water resources in a developing country. Water Polic. 12 279-499. [ Links ]
EDWARDS L and LAWRENCE R (2006) South African trade policy matters: Trade performance & Trade policy. Centre for International Development, Working Paper No. 135. Harvard University, New Haven, USA. [ Links ]
FAO (2014) FAOSTAT database. Food and Agriculture Organization, Rome, Italy. URL: http://biofuel.org.uk/third-generation-biofuels.html (Accessed 11 November 2014). [ Links ]
FRANKE NA, BOYACIOGLU H and HOEKSTRA AY (2013) Grey Water Footprint Accounting: Tier 1 Supporting Guidelines. Value of Water Research Report Series No. 65. UNESCO-IHE, Delft. [ Links ]
GERBENS-LEENES W, HOEKSTRA AY and VAN DER MEER TH (2009) The water footprint of bioenergy. Proc. Natl. Acad. Sci. 106 (25) 10219-10223. [ Links ]
GERBENS-LEENES PW, XU L, DE VRIES GJ and HOEKSTRA AY (2014) The blue water footprint and land use of biofuels from algae. Water Resour. Res. 50 DOI:10.1002/2014WR015710. [ Links ]
HASTINGS E and PEGRAM G (2012) Literature review for the applicability of water footprints in South Africa. WRC Report No. 2099/P/11. Water Research Commission, Pretoria. [ Links ]
HOEKSTRA AY, CHAPAGAIN AK, ALDAYA MM and MEKONNEN MM (2011) The Water Footprint Assessment Manual: Setting the Global Standard. Earthscan, London. [ Links ]
HOEKSTRA AY, MEKONNEN MM, CHAPAGAIN AK, MATHEWS RE and RICHTER BD (2012) Global monthly water scarcity: Blue water footprints versus blue water availability. PLoS ONE 7 (2) e32688. DOI:10.1371/journal.pone.0032688. [ Links ]
HOEKSTRA AY and MEKONNEN MM (2012) The water footprint of humanity. Proc.Natl. Acad. Sci. 109 (9) 3232−3237. [ Links ]
JEWITT G, WEN H, KUNZ R and VAN ROOYEN A (2009) Scoping study on water use of crops/trees for biofuels in South Africa. WRC Report No. 17721/1/09. Water Research Commission, Pretoria. [ Links ]
KEMERINK J, AHLERS R and VAN DER ZAAG P (2011) Contested water rights in post-apartheid South Africa: The struggle for water at catchment level. Water SA 37 (4) 585-594. [ Links ]
LETETE T and VON BLOTTNITZ H (2012) Biofuel policies in South Africa: A critical analysis. In: Janssen R. and Rutz D (eds) Bioenergy for Sustainable Development in Africa. Springer, Dordrecht. [ Links ]
LIU C, KROEZE C, HOEKSTRA AY and GERBENS-LEENES W (2012) Past and future trends in grey water footprints of anthropogenic nitrogen and phosphorus inputs to major world rivers. Ecol. Indic. 18 42-49. [ Links ]
MEKONNEN MM and HOEKSTRA AY (2010a) The Green, Blue and Grey Water Footprint of Crops and Derived Crop Products. Value of Water Research Report Series No. 47. UNESCO-IHE, Delft. [ Links ]
MEKONNEN MM and HOEKSTRA AY (2010b) The Green, Blue and Grey Water Footprint of Farm Animals and Animal Products. Value of Water Research Report Series No. 48. UNESCO-IHE, Delft. [ Links ]
MEKONNEN MM and HOEKSTRA AY (2011) National Water Footprint Accounts: The Green, Blue and Grey Water Footprint of Production and Consumption. Value of Water Research Report Series No. 50. UNESCO-IHE, Delft. [ Links ]
MEKONNEN MM and HOEKSTRA AY (2013) Water Footprint Benchmarks for Crop Production. Value of Water Research Report Series No. 64. UNESCO-IHE, Delft. [ Links ]
MOLOBELA I and SINHA P (2011) Management of water resources in South Africa: A review. Afr. J. Environ. Sci. Technol. 5 (12) 993-1002. [ Links ]
NASTERLACK T, VON BLOTTNITZ H and WYNBERG T (2014) Are biofuel concerns globally relevant? Prospects for a proposed pioneer bioethanol project in South Africa. Energy Sustainable Dev. 23 1-14. [ Links ]
PMG (PARLIAMENTARY MONITORING GROUP) (2012) National Water Resource Strategy 2012: Department of Water Affairs Briefing. Parliamentary Monitoring Group, South Africa. URL: http://www.pmg.org.za/report/20120919-department-water-affairs-national-water-resources-strategy-2012 (Accessed 10 February 2014). [ Links ]
RICHTER BD, DAVIS MM, APSE C and KONRAD C (2012) A presumptive standard for environmental flow protection. River Res. Appl. 28 1312-1321. [ Links ]
ROCKSTRÖM J, LANNERSTAD M and FALKENMARK M (2007) Assessing the water challenge of a new green revolution in developing countries. Proc. Natl. Acad. Sci. 104 6253-6260. [ Links ]
RSA (1998) National Water Act. Act No. 36 of 1998. Government Gazette 19182. Government Printer, Cape Town. [ Links ]
SA DEPARTMENT OF ENERGY (2014) Draft position paper on the South African Biofuels Regulatory Framework, Department of Energy Republic of South Africa. Government Gazette 15 January 2014 583 (37232). [ Links ]
SA CIVIL SOCIETY INFORMATION SERVICE (2012) South Africa's biofuel policies: On a road to nowhere. URL: http://sacsis.org.za/site/article/1219 (Accessed 27 March 2014). [ Links ]
SABMILLER and WWF-UK (2009) Water footprinting: Identifying & addressing water risks in the value chain. SABMiller, Woking, UK / WWF-UK, Goldalming, UK. [ Links ]
SIEBRITS RM, WINTER K, BARNES J, DENT MC, EKAMA G, GINSTER M, HARRISON J, JACKSON B, JACOBS I, JORDAAN A, KASAN HC, KLOPPERS W, LE ROUX R, MAREE J, MOMBA MNB, MUNNIK AV, O'KEEFFEE J, SCHULZE R, SILBERBAUER M, STILL D and VAN ZYL JE (2014) Priority water research questions for South Africa developed through participatory processes. Water SA 40 (2) 199-209. [ Links ]
VANHAM D and BIDOGLIO G (2013) A review on the indicator water footprint for the EU28. Ecol. Indic. 26 61-75. [ Links ]
VANHAM D, HOEKSTRA AY and BIDOGLIO G (2013) Potential water saving through changes in European diets. Environ. Int. 61 45-56. [ Links ]
Received 28 March 2014
Accepted in revised from 3 March 2015
* To whom all correspondence should be addressed. ☎ +31 53 489 4705; e-mail: m.pahlow@utwente.nl
APPENDIX

