


Services on Demand
Article
 English (pdf)
 Article in xml format
 Article references
Indicators

Related links
-
 Cited by Google
 -
 Similars in Google
Share

 Permalink
Water SA
On-line version ISSN 1816-7950
Print version ISSN 0378-4738
Water SA vol.41 n.2 Pretoria 2015
http://dx.doi.org/10.4314/wsa.v41i2.15
Assessing the blue-water footprint of an opencast platinum mine in South Africa
Nikita RanchodI; Craig M. SheridanI; Neville PintII; Kerry SlatterII; Kevin G. HardingI, *
IIndustrial and Mine Water Research Unit (IMWaRU), School of Chemical and Metallurgical Engineering, University of the Witwatersrand, Johannesburg, South Africa
IIAnglo American, Johannesburg, South Africa
ABSTRACT
South Africa's extensive mineral resources have resulted in mining activities dispersed across the country, playing a critical role in its socio-economic development. In contrast to this abundance of mineral wealth, water resources are generally limited, and vulnerable to environmental impacts from the mining industry. These circumstances make tailored management of water resources in the mining sector essential. To achieve this, detailed information on water use throughout a mine operation as well as an accurate water balance account is required. Blue-water footprints have the potential to contribute to this task as they allow for quantification of direct and indirect water use across the supply chain of a process, while incorporating both spatial extension and temporal duration. As defined by the Water Footprint Network's (WFN) globally acknowledged water footprint assessment methodology, a blue-water footprint is determined by calculating the net consumptive use of water by an operation. According to the WFN, this includes water which is evaporated, incorporated into a product, or lost to outflows which do not return to the same catchment area in the same period.The applicability of this tool in the mining sector has not been fully explored. Therefore, it was decided to investigate the blue-water footprint of a South African platinum mining operation. The results showed that the largest consumption of water in the production of platinum was due to evaporation from the mineral processing plants (36.8%) and the tailings storage facilities (19.4%). To improve its water-use efficiency, measures should be taken by the operation to mitigate evaporative losses. Floating covers can assist in this effort as they reflect a proportion of the incoming solar radiation and act as a physical barrier to the passage of water vapour, both vertically and horizontally.
Keywords: Footprinting, platinum group metals, cleaner production
INTRODUCTION
Water resource management is one of the greatest global challenges of the 21st century (Boccaletti et al., 2010). Accessible water is vital for both the agricultural and energy sectors, making it indispensable for human sustenance and economic growth across the world.
In a review of South Africa's water sector, Zhuwakinyu (2012) reported that increased levels of urbanisation, a lack of investment in water resource infrastructure and effects of climate change have all contributed to intensifying water shortages. The country also falls within a semi-arid, water-stressed region and is characterised by a low average rainfall of about 500 mm, which is well below the world average of 860 mm per year. Based on these findings and current usage trends, it has been predicted that water demand in South Africa will exceed availability of fresh water resources by 2025 (DWAF, 2011).
A sector level analysis of water demand by Boccaletti et al. (2010) shows that water expenditure in South Africa is dominated by 4 key sectors, namely, agriculture (62%), domestic and urban use (27%), mining, bulk industry and power generation (8%) and afforestation (3%). Mandatory water requirements from industries such as mining and power generation have become an increasingly significant factor and have resulted in challenges involving trade-offs between competing demands.
South Africa is estimated to be the world's fifth-largest mineral producer and the mineral sector is valued by Citibank to be worth US$2.5 trillion. The country's mining sector makes up approximately 18% of gross domestic product (GCIS, 2011). In contrast to the abundance of mineral wealth in South Africa, water resources are limited and vulnerable to environmental impacts from the mining industry. Unless appropriate corrective action is taken, this sector is expected to place further pressure on the country's scarce water resources.
Water footprinting can add value in creating inter-disciplinary water management strategies to reduce water consumption. Peña and Huijbregts (2013), Osman et al. (2013) as well as Haggard et al. (2013, 2015) have started exploring the applicability of this tool in the mining sector. However, its value, especially for platinum production, is yet to be fully determined. Since research in this field is limited, opportunities existed for a comprehensive water footprint to be carried out for a platinum mining operation.
In a report entitled 'Platinum group metals in South Africa', Diliza (2008) states that the Bushveld Igneous Complex (BIC) in South Africa contains more than 80% of the world's platinum reserves and is concentrated in narrow but extensive strata known as the Merensky Reef, the Platreef and the UG2 chro-mitite layer. As a result, South Africa is the largest producer of platinum group metals (PGM).
Value drivers
Water is integral to mining operations, particularly for mineral processing and refining (Mey, Günther and Van Niekerk, 2006).
Luba et al. (2006) have outlined 4 factors which make water the fluid of choice for mineral processing:
- Provides an efficient medium for mixing particles due to its relatively low cost and energy requirements Useful in transporting particles within and between processes
- Suitable for the selective action of a distributed force field during separation processes by either gravitational or centrifugal forces
- Essential chemical ingredient in many processes - for instance, hydrometallurgical processes, such as leaching and electro winning, use aqueous solutions of reagents to dissolve and re-precipitate minerals and metals
Historical references to the use of water for mining purposes show that it has been perceived to be of low value (Rowe, 2012). According to Luba et al. (2006) this has resulted in significant mine-site issues relating to management of water volumes, control of water quality, maintenance of water systems and the meeting of site licence requirements. In South Africa, some of the key drivers that have started raising the profile of water in the mining industry include:
Geographic location
Concerns with regards to water resources vary with climatic, hydrologic and hydrogeological factors (Rowe, 2012). This means that the mining industry impacts water resources differently in different locations throughout the country. Current mining operations are situated in the most arid regions of South Africa (UNEP, 2012). In addition, mines are increasingly being developed in remote locations where little or no water infrastructure exists (Rowe, 2012). Therefore, it follows that the value of water to a particular mine operation will be dependent on the location and geological setting (Salmon, 2006). Due to these circumstances, forward planning is essential to make arrangements for the transfer of water and the development of new sources in order to ensure a thriving mining sector.
Operational methods
Different mining methods and mineral processing techniques have unique water requirements. Therefore, the amount and quality of water used will depend on the commodity being mined. This factor will also affect an operation's ability or inability to use water efficiently and change the valuation accordingly (Salmon, 2006). The following examples clearly demonstrate this point:
- Water management practices for open pit mine constructions are different than those of underground mining operations; each will require specific water management principles, performance measures, water quality monitoring and adaptive water management strategies and protocols (Luba et al., 2006).
- Mines which exploit lower grade resources need more water per tonne of finished product, in general. In addition, some mines tend to be relatively short lived, thus they may need large quantities of water over a limited period of time (Rowe, 2012).
- Some mines must manage significant precipitation and stormwater runoff while others must deal with large groundwater flows which can alter the local flow regime (Salmon, 2006).
Scarcity
Climate change will primarily reduce the available water supply and increase evaporation (Zhuwakinyu, 2012). Growing populations and economic development will also result in water scarcity. This will give rise to an increase in the value and cost of water thus heightening competition for this resource (Salmon, 2006). Salmon (2006) further adds that the mining sector will have to demonstrate ongoing improvements in water management to be able to compete for water allocations.
Economic drivers
The driver with potentially the greatest impact on mining business is economic value. Price provides a quantified figure for the economic value of water. With respect to mining operations, unfortunately, the price of water is not the only charge levied by suppliers. The sector must also account for transporting, treating, distributing and disposing of the resource (Salmon, 2006). These continually increasing costs have contributed to an improved value profile of water in the mining industry.
Acid mine drainage
A report by the United Nations Environment Programme (UNEP) (2012) states that South Africa has nearly 6 000 abandoned mines, many of which contribute to uncontrolled acid mine drainage (AMD). When mining activities cease and dewatering no longer occurs, a hydrological recovery process begins whereby water in the underground mine comes into contact with sulphide minerals, making the water highly acidic. This highly polluted, acidic groundwater rises to the surface and decants into springs and rivers which are utilised by both urban residents as well as the agricultural sector. AMD is responsible for costly environmental and socio-economic impacts, resulting in water as a resource moving up the value chain.
Legislation
Changes in South African legislation, resulting from the introduction of integrated water resource management (IWRM) principles, have necessitated new approaches to water management by mining houses (Salmon, 2006). IWRM impacts water pricing, provides for water pollution charges, prioritises water users, has specific mining and water-related components and requires water licensing as part of the licence to mine. These legislative principles have changed perceptions of the value of water in the mining industrythrough increasing awareness that water resources and their management are essential for economic productivity and growth.
The water footprint
Tailored management of water resources is required to reduce water consumption and further develop the mining industry's perception of the value of water, as discussed above (Salmon, 2006). There are several options or interventions that may be used, either independently or in combination, to obtain a balance between water requirements and availability which is essential to aid in improving the value of water.
An overview and comparison of 3 methods - life cycle assessment (LCA), the World Business Council for Sustainable Development's Global Water Tool (GWT) and the water footprint method - has been compiled by Morrison, Schenck, and Schulte (2010). An evaluation of the scope, strengths and limitations of each tool reveals that water footprinting, in particular, has the potential to provide valuable insights for the mining sector, as it allows for the quantification of water use within a process, for a specified geographic area at a given time. The water footprint method also leads to assessment of environmental, social and economic sustainability. This permits integrated catchment management and ensures mine operators consider the needs of other water users in the catchments in which they operate (Salmon, 2006). Finally, it supports the formulation of a response strategy which makes disclosure and reporting simple and easy to comprehend, thus offering the mining sector a means to address on-site water management proactively, through its planning and decision-making capabilities (Hastings and Pegram, 2012).
The Water Footprint Network (WFN) was founded in 2008 by the University of Twente in collaboration with WWF (World Wildlife Fund) and UNESCO (United Nations Educational, Scientific and Cultural Organisation) (Hoekstra et al., 2011). The water footprint is an indicator of freshwater use that takes into account both direct and indirect consumption. A full water footprint includes the sum of the blue, green and grey water footprint as defined by Hoekstra et al. (2011).
The blue-water footprint is the volume of ground or surface water that is consumed through evaporation, through integration into a product and through water losses which occur when the resource is not returned to the same catchment or is only returned during a different time period. The green water footprint is pertinent when accounting for rain water expenditure with regards to agricultural and forestry products. The grey water footprint is quantified as the volume of water required to dilute pollutants in order to ensure that the water remains above ambient quality standards. Hoekstra's method of conducting a water footprint assessment makes use of 4 phases namely: (i) setting of the goals and scope; (ii) water footprint accounting; (iii) water footprint sustainability assessment and (iv) the water footprint response formulation.
The platinum recovery process
The platinum recovery process case can be grouped into 6 stages: concentration, smelting, converting, magnetic separation, base metals removal, and precious metals refining. Diliza (2008) described the steps involved as summarised in Fig. 1.
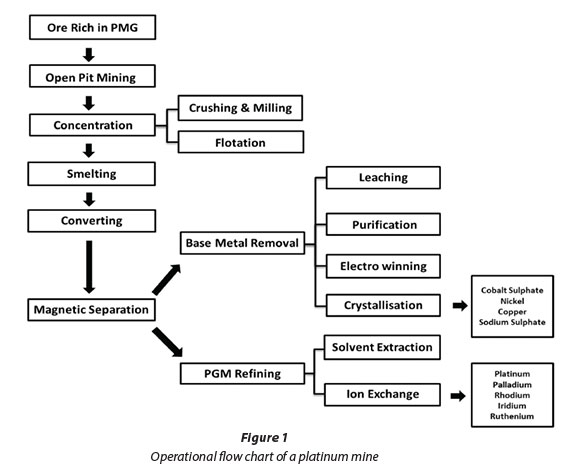
In the concentration stage, ore is crushed and milled to liberate mineral particles which are then recovered using flotation cells. Fine particles which are difficult to recover require multiple milling and flotation stages. The next stage involves smelting in which the concentrate is melted in an electric furnace. On melting, the concentrate separates into 2 layers. The upper layer is a silicate/oxide slag which is tapped off and then either discarded or returned to the concentration stage. The lower layer is a matte (mixture of a metal with its sulphides) which is sent for converting.
The process of converting ensures that excess sulphur and iron are oxidised in a refractory lined vessel. Fluxing agents are added to form an iron-rich slag that is removed and returned to the furnaces. The resulting converter matte is slow cooled to concentrate the PGM into a metallic fraction. The PGM fraction is then separated magnetically from the converter matte. The resultant concentrate is delivered to the PGM refinery for further processing. Refining processes for precious metals have developed considerably in recent years. They commonly involve operations such as solvent extraction or ion exchange. Finally, the non-magnetic solids, which are rich in base metals, are transferred to the base metal refinery for further processing via leaching, purification, electro-winning and crystallisation.
METHODOLOGY
Goals and scope
One of the major strengths of a water footprint is its wide range of application. The tool has been used to assess a variety of entities, including process steps, products, catchment areas, consumers and businesses. Thus, depending on the purpose, water footprint studies can be applied in different contexts.
The focus of this study is an assessment of the blue-water footprint of a South African platinum mine which is located in the northern region of the country. Green and grey water will not be addressed for the purposes of this research as blue-water resources are generally scarcer and have higher opportunity costs (Hoekstra et al., 2011).
Mineral extraction at this site occurs by conventional open cast methods and accounted for the highest production rate of refined platinum by the consortium in 2011 (8.87 tons/year). In addition, the South African Weather Service (2013) recorded the area as having the country's highest average annual temperature of 35.0°C.
The functional unit selected for this water footprint is the volume of water (m3) which is consumed to produce 1 tonne of refined platinum (m3/t). A 12-month period, from January to December 2011, was selected for a representative case study of platinum production. The scope of the investigation included direct and indirect consumptive water use. Direct consumption included all processes from mineral extraction to the final stage of refining. Water expended on electricity generation and production of chemical additions required for the beneficiation and metallurgical stages were accounted for as upstream, or indirect, blue consumptive water use.
Blue-water footprint accounting
Hoekstra et al. (2011) stated that the term 'consumptive water use', which is often used when referring to blue-water footprints, consists of one of the following cases:
- Evaporated water
- Water which is incorporated into a product
- Water that does not return to the same catchment area, in the same period
Evaporation is generally the greatest contributor to the blue-water footprint. All production- related evaporation, which occurs during water storage, transport, processing as well as collection and
disposal, must be included. These values can be inferred from the difference between abstraction and final disposal volumes.
Blue water also takes account of water which is incorporated into the product. This is also known as virtual water content or embedded water. The last component refers to the part of the return flow that is not available for reuse within the same catchment within the same period of withdrawal, either because it is returned to another catchment or because it is returned at a different period of time. Each component of the blue process water footprint can be measured directly and indirectly.
Therefore, the blue-water footprint for the mining operation was calculated as:

The units in this case are volume per mass of product produced. Water consumption data was derived from flow sheets and information provided by the site. The Ecoinvent life cycle inventory database was used due to the lack of on-site data relating to the mining, concentration, smelting, converting, base metals removal and precious metals refining unit processes.
Approach
The difference between water inflows and outflows across the operation should equal the measured change of water storage over the reporting period (Sustainable Mining Institute, 2012). Comparing site inputs, outputs and change of storage enables an assessment of any error in the water balance. Therefore, the first step was to reconcile water inflows and outflows against storage data.
Inflows
The mining site in question does not make use of surface and external water sources for mineral extraction or processing. Therefore, the main water inflows include groundwater from 3 wellfields and several boreholes, waste/second-class water from treated sewage effluent disposed of by surrounding areas, and harvested rainwater. This data was obtained from flow meter readings on-site.
According to the Sustainable Mining Institute (2012), entrained water (VEnt) in the ore is also considered an input. Therefore, it was calculated using the mass of processed ore (msolids) in the reporting period, the moisture (w) and the density of water (pwater) as shown in Eq. (2). The moisture content is specific to the ore body and should be known by the site. However in the absence of such information, as was the case, the authors recommend using a reasonable estimate of between 0.02 and 0.03 (Sustainable Mining Institute, 2012).

Outflows
A considerable percentage of the outflows from this mine come from discharges to ground water. Once again flow meter readings were used to gauge this volume.
Another important outflow which needed to be accounted for was evaporative losses from the stores (Vevap). The site under review has a total of 10 dams, split between reservoirs, pollution control, return water and tailings storage facilities. The evaporative losses from each store were calculated using Eq. (3) (Wels and Robertson, n.d.); which required the pan evaporation (PE) and the surface area of the storage facilities(SAstorage). Evaporation rates were taken from a study by Freysen et al. (2010) who measured the rates from a dam located 18 km north-west of the proposed mine. A pan coefficient (ƒpan) of 0.8 was used.

Task losses also contribute to the outflows from the mining operation. Tasks are operational activities that use water. Typical tasks for this site are:
- Dust suppression - estimated using flow meter data and water balances over the return water dams which supply the water for this task.
- Extraction and recovery processes - this includes water used for mining, concentration, smelting, converting, base metals removal, and precious metals refining. Water required for these tasks was estimated using a method implemented by Peña and Huijbregts (2013) in which data reported by Hochfeld (1997) for a platinum mining operation in the South African Bushveld Igneous Complex was used and then normalised to the total water consumption of the mining site under investigation.
- Human consumption - includes water used in the mine, offices and contractors' camp. This data was also obtained from flow meter readings on site.
Marginal water outflows also occur from potable water provided by the mine to a neighbouring community, as well as entrained water in waste material such as the tailings. The volume of entrainment was calculated using Eq. (2). The moisture content was obtained using an experimental relation established by MacRobert (2012) between the available dry density and the moisture content of the tailings. The location of MacRobert's case study was in common with this investigation; therefore the use of the author's results is acceptable.
Diversions
The next step required the identification of diversions, which is defined by the Sustainable Minerals Institute (2012) as water flows from the site input to the site output which do not come into contact with a task, a treatment plant or a store. Excess rainfall within the period of reporting resulted in surface water discharges which, in this case, fall within the diversions category.
Indirect water use
Indirect water use from processes that provide inputs, such as electricity and chemical additions to the platinum refinery plants, was derived from the Ecoinvent (2009) database.
Eskom is responsible for generating, transmitting and distributing approximately 95% of the electricity used in South Africa. Power is predominantly generated by coal-fired power plants that use surface and groundwater. According to Eskom (2011), 1.35 ℓof water was required to produce 1 kWh of electricity in 2011. The medium voltage electricity mix for South Africa required to extract, concentrate, smelt, separate and refine 1 kg of PGM at a South African platinum mine was obtained from Ecoinvent (2009). These values were needed to demine the embodied water consumption associated with the production of electricity for the various mining operations. In order to covert the mean values to units of kilowatt hour per kilogram of platinum, mineralogy literature from Ecoinvent (2009), which indicates that platinum makes up 68% of the PGM ore, was used.
Once the water inflows, outflows, diversions and indirect water uses were quantified in terms of volume, an analysis was conducted to determine which of the flows would constitute consumptive use according to the definition given by Hoekstra et al. (2011). The volume of consumptive use was determined from the difference between abstraction and final disposal volumes. The blue-water footprint was finally calculated using Eq. (1).
RESULTS AND DISCUSSION
The total blue-water footprint, including direct and indirect consumption, was calculated to be 2 229 x 103 m3/ton of refined platinum.
All inflows, including harvested rainwater, were included as blue water. There is often debate as to whether rain-harvested water is green or blue water. According to Hoekstra et al. (2011), rainwater harvesting refers to the collection of rain that otherwise would become run-off. Since consumptive use of harvested rainwater will subtract from runoff, it is recommended such water use be considered as a blue-water footprint.
Figure 2 shows the percentage of blue water sourced from waste or second-class water, from groundwater and from harvested rainwater. The operation's effort to conserve water is clearly evident from the use of water sourced from sewage works which makes up 35% of the water consumed.
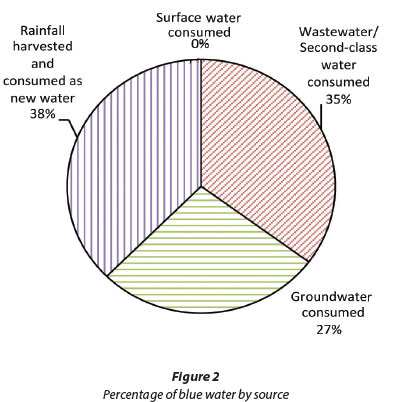
Fig. 3 provides an account of the blue water consumed for various mining-related activities. The mineral processing plants consume the highest percentage of blue water which totals 47.3%. This consumptive value is driven by task losses from the comminution, flotation, smelting, converting, base metal removal and refining stages of platinum recovery. The conversion stage is the main contributor (12.8%) in this category due to extensive water evaporation which occurs when the converter matte is slow cooled.
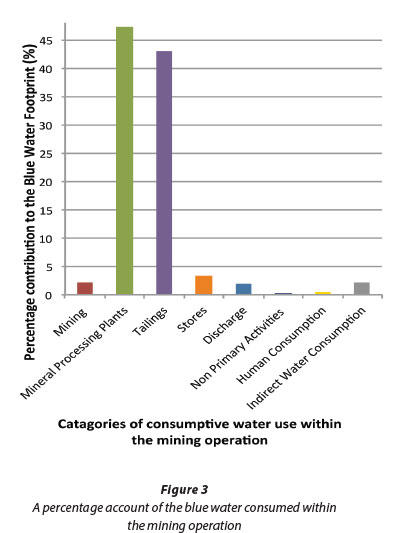
Evaporative consumption from the tailings storage facilities on site, as well as entrainment losses during tailings discharge, are dominant contributors to the blue-water footprint and accounts for 19.4% and 23.7% respectively. Evaporative losses also occur via the reservoir, return water and pollution control dams; these open water bodies (stores) totalled 3.30% of the blue-water footprint.
The discharge category, as indicated in Fig. 1, was a rainfall decant to a surface water source. This loss contributed 1.86% to the footprint and is significant when considering that the total upstream water use from electricity requirements and chemical additions made up 2% of the blue water. The indirect footprint is useful in assessing the sustainability of the operation over the entire value chain.
The non-primary activity comprised water that is given to a community external to the mining site. Since the operation has no control over how the third party will use the water, it will be assumed that it must be counted in the blue-water footprint. However, the contribution is minimal and is the lowest addition, which only makes up 0.02% of the blue water consumed.
Fig. 4 relays the percentage share of blue water (excluding indirect uses) evaporated, lost and incorporated into the product through the course of platinum recovery. As expected, the largest contribution to the water footprint is evaporative abstractions (67%) which is a result of task losses from the mineral processing plants, the tailings storage facility and the stores.
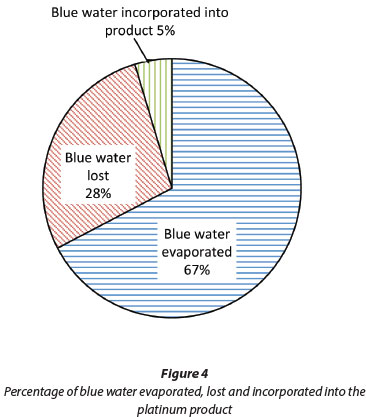
Blue-water losses, which make up 28% of the footprint, comprise ore and tailings entrainment losses, surface water discharges, non-primary activities as well as consumption by humans in the mine, offices and contractors' camp. The only form of product-incorporated blue water (5%) occurs during the comminution stage through integration of water into the PGM mineral.
As noted also by Peña and Huijbregts (2013), the uncertainties of this water footprint are related to the operation's poor controls on the amount of water evaporated or lost. In addition, information detailing water flows within the mineral processing plant was limited. Therefore, water flows for the recovery stages are based on data reported by Hochfeld (1997) normalised to the total water consumption of the mining site under investigation.
RECOMMENDATIONS
This study focused on quantifying the blue-water footprint. The next step would be to conduct a water footprint sustainability assessment where the results are weighted according to the volume of water the region can sustainably support.
It is also recommended that a follow-up study investigates the grey water footprint in order to account for the volume of water required to dilute pollutants, while ensuring it remains above ambient quality standards.
The results show that the majority of water is consumed due to evaporative losses from the tailings storage facility. To improve its water-use efficiency, measures should be taken by the operation to mitigate the evaporative effects of both sun and wind. A thorough evaluation of evaporative loss reduction technologies has been detailed by Howard and Schmidt (2008). Floating covers were found to provide the greatest reduction in evaporative losses. According to Yao et al. (2010) these covers reflect a proportion of the incoming solar radiation and act as a physical barrier to the passage of water vapour both vertically and horizontally.
CONCLUSIONS
On-site mining activities as well as upstream processes which make use of blue water, as defined by Hoekstra et al. (2011), were quantified for a platinum mining operation in South Africa. The contribution made by ground, waste/second class and harvested rainwater to the overall blue footprint was also determined. Finally the percentage of water consumed by evaporation (67%), the percentage lost to outflows which do not return to the same catchment area (28%) in the same period, as well as the percentage water incorporated into the product (5%) was presented.
The largest consumption of water in the production of platinum was due to evaporation from the mineral processing plants and the tailings storage facilities. Entrainment losses incurred during tailings discharge also made a significant contribution to the blue-water footprint.
The results from this study are expected to facilitate discussions on the management and sustainable use of water on site. Furthermore, the water footprint will allow the platinum mining operation to join a global process of disclosure and integrate an understanding of water into planning decisions.
REFERENCES
BOCCALETTI G, STUCHTEY M and VAN OLST M (2010) Confronting South Africa's water challenge. URL: http://www.foresightfordevelopment.org/sobipro/55/213-confronting-south-africas-water-challenge (Accessed 9 September 2014). [ Links ]
DILIZA MG (2008) Platinum group metals in South Africa. Chamber of Mines of South Africa. URL: http://chamberofmines.co.za/content/?pid=86andpagename=Platinum (Accessed 22 January 2014). [ Links ]
DWAF (DEPARTMENT OF WATER AFFAIRS AND FORESTRY, SOUTH AFRICA) (2011) Governing Board induction manual - Chapter One: Overview of the South African water sector. Pretoria, South Africa. URL: http://www.dwaf.gov.za/IO/Docs/CMA/CMAGBTrainingManuals/gbtrainingmanualchapter1.pdf (Accessed 9 September 2014). [ Links ]
ECOINVENT (2009) Ecoinvent database v2.1. Dubendorf, Switzerland: Ecoinvent Center. [ Links ]
ESKOM (2011) Eskom factor report. URL: http://www.eskomfactor.co.za/eskom-factor-environmental.php (Accessed 19 January 2014). [ Links ]
FREYSEN A, VERMAAK KH, BREDENKAMP BJ and DU TOIT GJ (2010) Hydrogeological report for the proposed Volspruit Mine (North Pit) near Mokopane. EScience Associates (Pty) Ltd , Mokopane [ Links ]
GCIS (GOVERNMENT COMMUNICATION AND INFORMATION SYSTEM, SOUTH AFRICA) (2011) South Africa Yearbook 2011/12 - Mineral Resources. URL: http://www.gcis.gov.za/sites/www.gcis.gov.za/files/docs/resourcecentre/yearbook/2011/21_Mineralresources.pdf (Accessed 9 September 2014). [ Links ]
HAGGARD E, SHERIDAN CM and HARDING KG (2013) Water footprint for a South African platinum mine. Proc. Water in Mining, 26-28 November 2013, Brisbane, Australia. [ Links ]
HAGGARD E, SHERIDAN CM and HARDING KG (2015) Quantification of water usage at a South African platinum processing plant. Water SA 41 (2) 279-286. [ Links ]
HASTINGS E and PEGRAM G (2012) Literature review for the applicability of water footprints in South Africa. WRC Report No. 2099/P/11. Water Research Commissin, Pretoria. [ Links ]
HOCHFELD C (1997) Bilanzierung der Umweltauswirkungen bei der Gewinnung von Platingruppen-Metallen für PKW-Abgaskatalysatoren [Balance of the environmental impacts from the extraction of platinum group metals]. [ Links ] Oko-Institut, Freiburg, Germany.
HOEKSTRA AY, CHAPAGAIN AK, ALDAYA MM and MEKONNEN MM (2011) The Water Footprint Assessment Manual. Earthscan, London. [ Links ]
HOWARD E and SCHMIDT TE (2008) The effectiveness of Nylex AquaCap floating module technology at the Rio Tinto Northparkes Mine. The National Centre for Engineering in Agriculture, University of Southern Queensland, Toowoomba, Australia. [ Links ]
LUBA L, JAKEMAN M, LEFEBVRE N and ASEERVATHAM R (2006) Mining for water - partnering for sustainable water use in semi-arid regions. Proc. Water in Mining, 26-28 November 2013, Brisbane, Australia. [ Links ]
MACROBERT CJ (2012) A field study of beaching behavior and the in-situ moisture regime of tailings during active deposition. University of the Witwatersrand, Johannesburg, South Africa. [ Links ]
MEY W, GÜNTHER P and VAN NIEKERK AM (2006) Collective mine water reclamation and reuse - Upper Olifants River catchment. Proc. Water in Mining, 26-28 November 2013, Brisbane, Australia. [ Links ]
MORRISON J, SCHENCK R and SCHULTE P (2010) Corporate water accounting. California: UN Global Compact Office. URL: http://ceowatermandate.org/files/corporate_water_accounting_analysis.pdf (Accessed 9 September 2014). [ Links ]
OSMAN A, CRUNDWELL FK, HARDING KG, SHERIDAN C, HINES K and DU TOIT A (2013) Water accountability and efficiency at a base metals refinery. Proc. Water in Mining, 26-28 November 2013, Brisbane, Australia. [ Links ]
PEÑA CA and HUIJBREGTS MAJ (2013) The blue water footprint of primary copper production in northern Chile. J. Ind. Ecol. DOI:10.1111/jiec.12036. [ Links ]
ROWE J (2012) The future of water in the mining industry. In: International Mine Water Association Symposium, 30 September - 4 October 2012, Bunbury, Australia. [ Links ]
SALMON DA (2006) Valuing mine water - A South African perspective. Proc. Water in Mining, 26-28 November 2013, Brisbane, Australia. [ Links ]
SOUTH AFRICAN WEATHER SERVICE (2013) What are the temperature, rainfall and wind extremes in SA? URL: http://www.weathersa.co.za/web/index.php/corporate?id=167 (Accessed 19 February 2014). [ Links ]
SUSTAINABLE MINING INSTITUTE (2012) Water accounting framework for the minerals industry. Australian Water Accounting Standards. URL: http://www.minerals.org.au/file_upload/files/resources/water_accounting/WAF_UserGuide_v1.2.pdf (Accessed 19 February 2014). [ Links ]
UNEP (UNITED NATIONS ENVIRONMENT PROGRAMME) (2012) Chief Liquidity Series - Water Related Materiality Briefings for Financial Institutions. UNEP, Geneva. [ Links ]
WELS C and ROBERTSON AM (n.d.). Conceptual model for estimating water recovery in tailings impoundments. Robertson GeoConsultants, Inc., Vancouver, Canada. URL: https://www.rgc.ca/files/publications/welcmf.pdf. [ Links ]
YAO X, ZHANG H, LEMCKERT C, BROOK A and SCHOUTEN P (2010) Evaporation reduction by suspended and floating covers: overview, modelling and efficiency. Queensland, Australia. URL: http://www.urbanwateralliance.org.au/publications/UWSRA-tr28.pdf (Accessed 19 February 2014). [ Links ]
ZHUWAKINYU M (2012) Water 2012: - a review of South Africa's water sector. Johannesburg, South Africa. URL: http://d2zmx6m-lqh7g3a.cloudfront.net/cdn/farfuture/u7Ace00rC7murhY2XqAXi-JlJhfb3PsR41ss8BBaxKt0/mtime:1366016685/files/120904review.pdf (Accessed 19 February 2014). [ Links ]
* To whom all correspondence should be addressed. +27 717 7576; e-mail: kevin.harding@wits.ac.za

