


Serviços Personalizados
Artigo
 Inglês (pdf)
 Artigo em XML
 Referências do artigo
Indicadores

Links relacionados
-
 Citado por Google
 -
 Similares em Google
Compartilhar

 Permalink
Water SA
versão On-line ISSN 1816-7950
versão impressa ISSN 0378-4738
Water SA vol.41 no.1 Pretoria Jan. 2015
http://dx.doi.org/10.4314/wsa.v4lil.2
Using soil-specific partition coefficients to improve accuracy of the new South African guideline for contaminated land
M PapenfusI, *; EH TesfamariamI; PC de JagerI; CS SteynII; JE HerselmanII
IDepartment of Plant Production and Soil Science, University of Pretoria, PO Box X20, Hatfield 0028, South Africa
IIGolder Associates (Pty) Ltd, PO Box 6001, Halfway House, 1685, South Africa
ABSTRACT
Contaminated land in South Africa is regulated through the National Environmental Management Waste Act (Act 59 of 2008) (NEMWA) and the National Norms and Standards for the Remediation of Contaminated Land and Soil Quality (NSCLA) (GN R.331 of 2014). These standards were obtained from the Framework for the Management of Contaminated Land. A soil screening value (SSV1) for the protection of groundwater resources is proposed which is based on a 2-phase (stage) equilibrium partitioning and dilution model which includes a dilution factor and partitioning coefficient (Kd), converting the water quality guideline to a total soil screening value. The appropriateness of the screening values has been questioned because of the uncertainties surrounding the Kd values used by the Framework. This paper investigates the Kd values of Cu, Pb, and V for selected South African diagnostic soil horizons to evaluate the reliability of the current Kd values used by the Framework during Phase 1 screening. The Kdvalues of Cu for the 10 horizons ranged between 13 and 19 044 ℓ-kg-1, all exceeding the value of 10 ℓ-kg-1 provided by the Framework. For Pb the values ranged from 25 to >252 294 ℓ-kg-1 as compared to the Framework's 100 ℓ-kg-1. Similarly, the Kd value of 200 ℓ-kg4 for V recommended by the Framework is higher than the measured Kd value of 15 to 173 ℓ-kg4 for all 10 diagnostic horizons. This study demonstrated that the observed wide Kd value ranges for each element were related to the variation in basic soil properties such as soil pH, organic carbon, clay, Fe, and Al content. Therefore, the Kd values for Cu, Pb, and V currently used by the Framework are not representative of typical South African diagnostic soil horizons. Linear regression models were developed for the prediction of Cu, Pb, and V Kd values from measured soil properties, which could be used to generate soil-specific Kd values.
Keywords: Kd value, contaminated land, NEMWA, screening value, risk, soil
INTRODUCTION
Contaminated land in South Africa is regulated through the National Environmental Management Waste Act, 2008 (Act 59 of 2008) (NEMWA) which was implemented on 1 July 2009. Part 8 (Sections 35 to 41) of NEMWA, regarding Contaminated Land, was implemented on 2 May 2014 through the National Norms and Standards for the Remediation of Contaminated Land and Soil Quality (NSCLA) (GN R.331 of 2014). These standards were obtained from the Framework for the Management of Contaminated Land (hereafter simply called the Framework). The GN R.331 provides norms and standards for screening, identification, and registration of contaminated sites.
The NSCLA is based on a risk-based approach and allows for the consideration of background soil concentrations when assessing screening levels. In a Phase 1 assessment, soil screening values (SSVs) are used to assess whether constituents present in the soils are at concentrations high enough to pose a potential risk to the receiving environment, and require further, Phase 2, assessment. The norms and standards are set for screening values on the basis of land use and potential impact to water resources.
An SSV1 was established for the protection of human health and water resources. The SSV1 for the protection of water resources is based on a 2-phase equilibrium partitioning and dilution model and is calculated using Eq. (1):
Y = Cw x Kd x DAF (1)
where:
Y = total contaminant concentration (mg.kg-1) in soil at equilibrium with pore water at a defined water quality standard
Cw= water quality standard (aquatic ecosystem/domestic drinking water use guideline) (mg-ℓ-1)
Kd= partition coefficient (ℓ-kg-1)
DAF = dilution attenuation factor
The DAF, often referred as the dilution factor (DF), accounts for the effects of groundwater recharge on dilution and mixing. An estimated DF of 20 is assumed in the guidance provided for the protection of a theoretical drinking-water borehole based on a transport pathway of 50 m from a theoretical contaminant source. The DF for the protection of aquatic ecosystems is 2 000 when using the aquatic ecosystem water quality standard.
The other important factor in the transformation of soluble to total concentrations is the partitioning coefficient. The tendency of a contaminant to leach to the groundwater is determined by its solubility and by the ratio between the concentration of the contaminant sorbed by the soil and the concentration remaining in solution. This ratio is commonly known as the soil partitioning or distribution coefficient (Kd). A higher Kd value indicates stronger attraction to the soil solids and lower susceptibility to leaching (Ashworth & Shaw, 2005). The Kd is calculated by Eq. (2) and reported as ℓ-kg-1 or mℓ-g-1.

The Kd value for a given constituent may vary widely depending on the properties of the soil (pH, clay content, organic matter content and mineralogy) in which the constituent occurs. Considering such variables (soil properties) is of importance if an appropriate Kd value is to be derived (Ashworth and Shaw, 2005). This is because the Kd value represents the net effect of several soil sorption processes acting upon a constituent (e.g. ion exchange, complexation, precipitation).
In the setting of the SSV1 values the Framework uses a single Kd value for each element regardless of the soil type, with an assumed soil pH of 7 (Covelo et al., 2007). The Kd values used by the Framework were obtained from studies conducted in other countries, due to the absence of local studies. The appropriateness of the screening values has been questioned because of the uncertainties surrounding the Kd values used by the Framework. Appropriate screening of contaminated land is imperative to the registration of contaminated land and has significant implications for industry, government and the environment. Inappropriate screening during initial investigations will result in some constituents and sites being screened for further detailed assessment and registered as contaminated land when in actual fact this could simply be the result of naturally-occurring soil concentrations. On the other hand, some constituents and sites that pose a potential risk may appear uncontaminated while further investigation is actually warranted.
This study investigated the Kd values of Cu, Pb, and V for selected South African diagnostic soil horizons to evaluate the reliability of the current Kd values used by the Framework during Phase 1 screening. These metals were selected based on reactivity and environmental abundance. Lead and Cu are B-type metals which complex readily with organic material and are generally more environmentally toxic. Vanadate is an A-type metal and is redox sensitive. Its association with the Bushveld complex was the reason for its inclusion in this study.
METHODOLOGY
The data for this paper was collected as part of a Water Research Commission project that evaluated Kd values for a selection of typically South African diagnostic soil horizons (Herselman et al., 2012).
Soil selection and characterisation
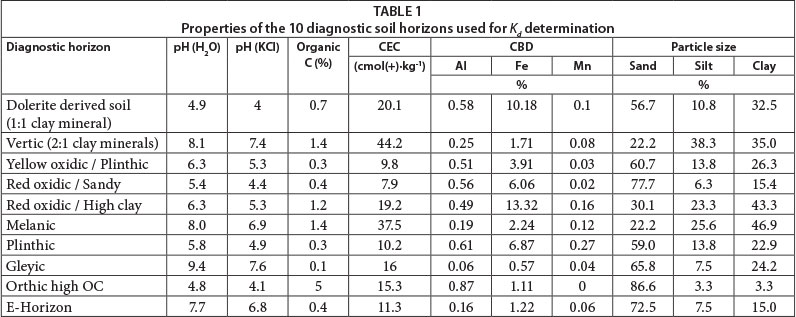
The soil samples were collected using a hand auger. The samples were air-dried and sieved through a 2 mm sieve before treatment applications. This study considered a selection of 10 diagnostic soil horizons. These soil horizons were selected to include widespread soil horizons developed as a result of predominant South African soil-forming factors. Selected chemical and physical characteristics of the selected diagnostic horizons are presented in Table 1.
Soil analyses were conducted at the Soil Science Laboratory of the Department of Plant Production and Soil Science, University of Pretoria. The soil pH in water and 1 mol-ℓ-1 KCl was determined using a 1:2.5 soil:solution ratio. The organic carbon content was determined using the Walkley Black method and particle size analysis with the hydrometer technique. The cation exchange capacity (CEC) was determined using a 1 mol-ℓ-1 ammonium acetate solution buffered at pH 7. These analytical methods are described in the Handbook of Standard Soil Testing Methods for Analytical Purposes (Nonaffiliated Soil Analysis Work Committee, 1990). Dithionite-citrate-bicarbonate soluble Fe, Mn and Al were extracted using the method as described by Mehra and Jackson (1960).
Partition coefficient determination
The most commonly used procedure for routine Kd value measurements is the batch equilibration method (USEPA, 1999). This study investigated the Kd value of 3 metals: Cu, Pb, and V. These metals were chosen because of the range of proposed Kd values presented in the Framework (10 ℓ-kg-1 for Cu, 100 ℓ-kg-1 for Pb, and 1 000 ℓ-kg-1 for V). In addition, V was considered because it occurs as an oxyanion, vanadate, and is expected to behave differently in the soil than the two cations.
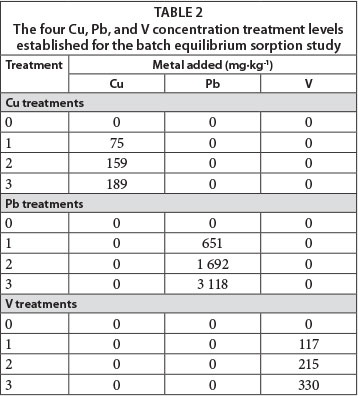
The study consisted of 10 diagnostic soil horizons treated with 3 metals at 4 concentration levels which were replicated 3 times (Table 2). All chemicals used were analytical grade and purchased from Merck. Each treatment was prepared as follows: A 4-g soil sample (sieved and homogenised) from each diagnostic horizon was weighed into a 50 mℓ centrifuge tube. Solutions (16 mℓ) with 4 concentration levels of Cu (mixture of equimolar amounts of CuSO4, Cu(NO3)2 and CuCl2), Pb (Pb(NO3)2), and V (NH4VO3) were added to the soil samples in order to obtain a sorption isotherm. The soils were exposed to only one element at a time; competitive sorption between the various elements was not considered. A 0.01 mol-ℓ Mg(NO3)2 solution was used as background electrolyte. The tubes were shaken for 24 h on a reciprocal shaker. Thereafter, the solid and liquid phases were separated by centrifuging at 4 000 r-min-1 for 30 min. The supernatant was then filtered through a 0.2 μm membrane filter. An axially viewed Spectro Genesis inductively coupled plasma optical emission spectrometer (Spectro Analytical Instruments GmbH & Co. KG) was used to determine the concentrations of metals extracted. The amount of metal sorbed was calculated using Eq. (3) as proposed by Essington (2004):

where:
Cin = initial concentration (mg-ℓ1)
Ceq = equilibrium/ final concentration (mg-ℓ1)
V = volume used (ℓ)
m = mass of soil (kg)
The Kd values of Cu, Pb, and V, for each diagnostic soil horizon, were determined from a graph of the sorbed metal concentration (q in Eq. (3)), plotted as a function of the equilibrium solution concentration of the metals (Ceq in Eq. (3)). The Kd value, by definition, is obtained from the slope of a linear regression of the sorption isotherm (Essington, 2004). The tacit assumption (and weakness) of the simple Kd approach is that the affinity of the sorbate (soil) for the metal is unaffected by the metal concentration and therefore increases linearly with increasing metal concentration.
For each metal a stepwise forward regression was performed on the predictors: pH(H2O), the square root of organic carbon (OC), the natural logarithm of Fe, and the Kd value, to generate a linear regression model which can provide a reliable soil-specific Kd value of contaminants. Some of the data used in the study were transformed before multiple regression analysis was conducted in order to meet the assumption of normality and homogenous variances required by the regression method. The goodness of fit of the model was evaluated by the adjusted R2 value and the standard error of the regression was used to provide the dispersion of the observed values around the regression line (Carlon et al., 2004). Significance was determined at the 5% level.
RESULTS AND DISCUSSION
Attenuation coefficient (Kd) value determination
Copper
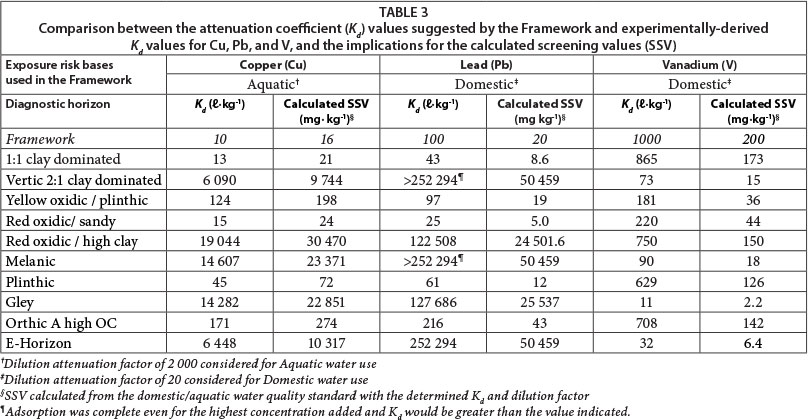
The estimated Kd values of Cu ranged between 13 (1:1 clay) and 19 044 ℓ-kg-1 (red oxidic/high clay) compared to the 10 ℓ-kg-1 suggested by the Framework (Table 3).
The implications are that using the Kd values suggested by the Framework will in general result in the overestimation of Cu solubility (or less sorption by the soil) and the underestimation of the screening value. The Kd data for Cu for the investigated horizons could be categorised into 2 groups. The first group is characterised by low Kd values (13 and 171 ℓ-kg1) and the corresponding diagnostic horizons have low CEC, low pH, low clay content and are dominated by 1:1 clay mineralogy; the second group has high Kd values, between 6 090 and 19 044 ℓ-kg-1, and the corresponding horizons are mostly characterised by high CEC, high pH, high clay content and are dominated by 2:1 clay mineralogy. The E-horizon is included in the high-Kd soils group, probably due to its pH being above 7 and the relatively high CEC.
Lead
The Kd values for Pb ranged from 25 (red oxidic/sandy) to >252 294 l-kg-1 (vertic 2:1 clay dominated and melanic) (Table 3). The Kd value suggested for Pb by the Framework was lower for 6 of the 10 horizons investigated.In some of the cases, the suggested Kd value was orders of magnitude lower than the measured values. The red oxidic/sandy clay soil had the lowest CEC (7.9 cmolc-kg-1) and second lowest organic carbon content (0.4%) and pH(pH water = 5.4 and pH KCl = 4.4)). Based on these soil parameters it was expected to show lower affinity for cations than most of the soils. The vertic and melanic soils, on the other hand, had the highest CEC (44.2 and 37.5 cmolc-kg-1) and organic carbon content (1.4%). The pH of these soils also indicates the potential presence of calcium carbonate (pH = 8.1 for the vertic and 8.0 for the melanic in water). The high Kd values were therefore not unexpected for the vertic and melanic soils, based on the pH and mentioned soil properties. In this study, Pb sorption could have been the result of various mechanisms in vertic and melanic soils, such as adsorption by 2:1 clay minerals and organic material, as well as sorption by or precipitation with carbonates to form PbCO3 (cerussite) or (Pb3CO3)2(OH)2 (hydrocerussite). Similar to Cu, the investigated diagnostic horizons could be categorised into 2 groups based on their Kd values. The first group of diagnostic horizons have low Kd value ranges (25-216 ℓ-kg-1), are characterised by low pH, low clay, and low CEC, and are dominated by 1:1 clay mineralogy. The second group have high Kd value ranges (122 598-252 294 ℓ-kg-1).
Vanadium
The Kd value of V varied between 11 (gley horizon) and 869 ℓ-kg-1 (1:1 clay dominated). All of the soils considered had lower Kd values than that of the Framework (1 000 ℓ-kg-1), which suggested a weaker partitioning to the solid phase than predicted. Consequently, screening values as presented in the Framework are higher than would be predicted by soil-specific Kd values. Unlike the other cationic metals (Cu and Pb), V most often occurs as the oxyanion vanadate in oxic soil environments. Orthovanadate (H2VO42- and HVO42-) exhibits a structural analogy to other oxyanions of the same valency, for example phosphate (Wehrli and Stumm, 1989; Wanty Goldhaber, 1992). It is possible that vanadate with time will transform to less soluble forms, similar to phosphate, which will not be captured in less than 24 h of equilibration. Longer equilibration times during the sorption experiments could have resulted in large Kd values, closer to that suggested by the Framework. Unlike the cations Cu and Pb, the Kd range for V was narrow.
Nevertheless, the Kd values of V for the diagnostic horizons investigated can be categorised into 2 groups. The first group of diagnostic horizons is characterised by relatively lower Kd value ranges (11 to 90 ℓ-kg-1) and is domminated by 2:1 clay mineralogy. The second group has relatively higher Kd values (181 and 865 ℓ-kg-1) and is dominated by 1:1 clay mineralogy and oxide minerals.
Soil properties affecting Kd values
Copper
The soil properties which were responsible for approximately 97.9 % of the variation observed in the Kd value of Cu were soil pH, OC, Fe and CEC. The range of data, adjusted R2, standard error of the regression and model probability are presented in Table 4. The linear regression model suggested by forward regression for Kd value determination is presented in Eq. (4).

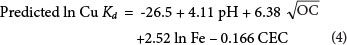
As shown in Eq. (4) and reported by Kabata-Pendias (2007), soil pH is a master variable determining many chemical reactions. Organic carbon is generally considered an important regulator of the mobility and bioavailability of Cu in soils (Flemming and Trevors, 1989). It is also well documented that Cu sorption onto Fe oxides and hydrous Mn oxides in soils is a common phenomenon (Thornton, 1979).
Lead
According to the multivariate linear regression analyses, approximately 67.4 % of the variation observed in the Kd value of Pb can be explained by the soil pH and CEC (Table 4). The resulting linear equation generated using the forward stepwise regression to predict the Kd value of Pb from measured soil properties (pH and CEC) is presented in Eq. (5).
Predicted ln Pb Kd = -10.6 + 1.88 pH + 0.437 CEC (5)
Previous studies conducted by Zimdahl and Skogerboe (1977) on the effect of soil properties on the mobility of Pb in soils under water-saturated conditions, using multivariate regression equations, highlighted the role of pH and CEC as the dominant soil properties influencing the mobility of Pb. Zimdahl and Skogerboe (1977) also reported clay content, and organic matter, as well as Fe and Mn oxides, to be of secondary importance. Considering clay mineralogy as one of the soil properties used for the prediction of Pb Kd value could shed more light on the current knowledge.
Vanadium
Approximately 90.4 % of the variation in the Kd values for V was explained by the soil pH, clay content and Al (Table 4). The resulting stepwise forward regression generated Eq. (6) for predicting the Kd value of V.

Anion adsorption capacity (AEC) was not determined in this study and the closest parameter associated with anion retention is expected to be Fe content, the reason being that Fe resides in ferric oxide forms, which are important surfaces for anion retention. Aluminium is a component of both 2:1 clay minerals (with a high affinity for cations) and 1:1 clay minerals with low CEC, and is expected to be a weak predictor for vanadium. However, the stepwise forward regression showed Al as an important factor along with clay content.
It is apparent that soil properties such as pH, OC, CEC, Fe, Al, Mn, and clay content play a critical role in the Kd values of Cu, Pb and V. The practical implications of using the current fixed single average Kd values to set screening values for Cu and Pb can potentially lead to the classification of many uncontaminated South African soils as contaminated. On the other hand, many V-contaminated soils will be categorised as uncontaminated, although further investigation of these soils is warranted. Furthermore, soils often have horizons with varying properties making screening using a single Kd value even more unreliable.
Attenuation coefficient (Kd) values generated from this study can be used to improve Phase 1 soil screening (SSV1). This study has brought forward two options from which more reliable Kd values can be estimated: (i) in the presence of more detailed measured soil properties, regression equations (Eqs (3) to (5)) can be used to estimate a more representative Kd value; (ii) in the absence of detailed measured soil properties, Kd can be selected from a list of diagnostic horizons presented in Table 3.
The study considered only a selection of South African diagnostic soil horizons with a single example for each horizon. Therefore, further refinement is needed by including more constituents, constituent concentrations, and diagnostic horizons, to obtain more representative Kd values.
CONCLUSION
Appropriate Phase 1 screening assessments are important due to the potential consequences they hold under NEMWA. Some uncertainty exists in the Phase 1 screening due to variability in Kd values for different soils. This study showed that the use of a single Kd value, as suggested in the Framework, could lead to incorrect Phase 1 screening which will have environmental and economic implications. The forward regression and accompanying discussion highlighted that the calculation of soil screening values should take into account soil properties such as pH, organic carbon, clay content, CEC, Fe, Al, and Mn contents. It was also apparent that more reliable Kd values can be estimated using regression analyses (Eqs (3) - (5)) that take into consideration the various mentioned soil properties. In the absence of detailed measured soil properties, preliminary Kd values generated from this study for a list of diagnostic horizons (Table 3) could be used.
An alternative approach would be to determine the water-soluble fraction of samples in addition to the total analysis required by the NSCLA. This would increase the certainty with which screening is conducted and could prevent significant inappropriate screening. Cost could be justified through the potential cost savings as a result of preventing unnecessary Phase 2 assessments or the reduction of undetected risks that could impact the environment.
ACKNOWLEDGEMENTS
We would like to express our gratitude to the WRC for funding and to Dave Turner from the ARC-ISCW for providing samples from their archives.
REFERENCES
ASHWORTH DJ and SHAW G (2005) Soil migration and plant uptake of technetium from a fluctuating water table. J. Environ. Radioact. 81 (2-3) 155-171. [ Links ]
ASHWORTH DJ, MOORE J and SHAW G (2008) Effects of soil type, moisture content, redox potential and methyl bromide fumigation on Kdvalues of radio-selenium in soil. J. Environ. Radioact. 99 (7) 11136-1142. [ Links ]
COVELO EF, VEGA FA and ANDRADE ML (2007) Simultaneous sorption and desorption of Cd, Cr, Cu, Ni, Pb, and Zn in acid soils II. Soil ranking and influence of soil characteristics. J. Hazardous Mater. 147 (3) 862-870. [ Links ]
ESSINGTON ME (2004) Soil and Water Chemistry: An Integrated Approach. CRC Press LLC, Florida. [ Links ]
FEY M (2010) Soils of South Africa. Cambridge University Press, Cape Town. [ Links ]
FLEMMING CA and TREVORS JT (1989) Copper toxicity and chemistry in the environment: A review. Water Air Soil Pollut. 44 (1-2) 143-159. [ Links ]
HERSELMAN HE, PAPENFUS M, STEYN CS, DE JAGER PC and TESFAMARIAM EH (2012) Evaluation of partitioning coefficients for South African soils to inform the National Framework for the Management of Contaminated Land with emphasis on the protection of water resources. WRC Report No. 576/1/98. Water Research Commission, Pretoria. [ Links ]
KABATA-PENDIAS B and MUKHERJEE AB (2007) Trace Elements from Soil to Human. Springer, Berlin. [ Links ]
MEHRA OP and JACKSON ML (1960) Fe oxide removal from soils and clays by a dithionite-citrate system buffered with sodium bicarbonate. In: Swineford A (ed.) Proc. 7th Natl. Conf. on Clays and Clay Minerals. Pergamon Press, Washington DC. [ Links ]
NON-AFFILIATED SOIL ANALYSIS WORK COMMITTEE (1990) Handbook of Standard Soil Testing Methods for Advisory Purposes. Soil Science Society of South Africa, Pretoria. [ Links ]
PAPIERNIK SK, YATES SR and GAN Y (2002) Processes governing transport of organic solutes. In: Dane JH and Topp GC (eds) Methods of Soil Analysis, Part 4: Physical Methods. SSSA Book Series no. 5. Soil Science Society of America, Madison, USA. [ Links ]
PAYNE RW, MURRAY DA, HARDING SA, BAIRD DB and SOUTAR DM (2012) GenStaf for Windows™ (15th edn) Introduction. VSN International, Hemel Hempstead, UK. [ Links ]
SOIL CLASSIFICATION WORKING GROUP (SCWG) (1991) Soil Classification: A Taxonomic System for South Africa. The Department of Agricultural Development, Pretoria. [ Links ]
SOIL SCIENCE SOCIETY OF AMERICA (SSSA) (1996) Methods of Soil Analysis, Part 3: Chemical Methods. Soil Science Society of America, Madison, USA. [ Links ]
THORNTON L (1979) Copper in the environment. In: Nariagu JO (ed.) Part I: Ecological Cycling. John Wiley and Sons, Toronto. [ Links ]
USEPA (1999) Understanding variation in partition coefficient, Kd, values. Volume 1: The Kd Model, methods of measurement, and application of chemical reaction codes. EPA 402-R-99-004A. United States Environmental Protection Agency, Washington DC. [ Links ]
WANTY RB and GOLDHABER HB (1992) Thermodynamics and kinetics of reactions involving vanadium in natural systems: Accumulation of vanadium in sedimentary rocks. Geochim. Cosmochim. Acta 56 (4) 1471-1483. [ Links ]
WEHRLI B and STUMM W (1989) Vanadyl in natural waters: Adsorption and hydrolysis promote oxygenation. Geochim. Cosmochim. Acta 53 (1) 69-77. [ Links ]
ZIMDAHL RL and SKOGERBOE RK (1977) Behaviour of lead in soil. Environ. Sci. Technol. 11 (13) 1202-1207. [ Links ]
Received 21 January 2014
Accepted in revised form 17 November 2014
* To whom all correspondence should be addressed. Present address: Golder Associates (Pty) Ltd PO Box 6001, Halfway House, 1685, South Africa +27 11 254-4802; fax: +27 11 315-0317; e-mail: mipapenfus@golder.co.za

