


Services on Demand
Article
 English (pdf)
 Article in xml format
 Article references
Indicators

Related links
-
 Cited by Google
 -
 Similars in Google
Share

 Permalink
Water SA
On-line version ISSN 1816-7950
Print version ISSN 0378-4738
Water SA vol.41 n.1 Pretoria Jan. 2015
http://dx.doi.org/10.4314/wsa.v41i1.18
Optimum reliable operation of water distribution networks by minimising energy cost and chlorine dosage
Nadia Babaei*; Massoud Tabesh; Sara Nazif
School of Civil Engineering, College of Engineering, University of Tehran, PO Box 11155-4563, Tehran, Iran
ABSTRACT
In recent decades much attention has been paid to optimal operation of water distribution networks (WDNs). In this regard, the system operation costs, including energy and disinfection chemicals, as well as system reliability should be simultaneously considered in system performance optimisation, to provide the minimum required level of performance in failure condition and to manage economic limitations. In this study, multi-objective optimisation of water distribution network performance in 3 different scenarios was considered. In these scenarios the effects of time-dependent chlorine injection and pump speed, as well as different combinations of objective functions for minimising energy and disinfection costs and for maximising hydraulic reliability and quality-based reliability are incorporated. As the optimisation method, a multi-objective ant colony optimisation (ACO) algorithm was used because of its high efficiency. For better managing the hydraulic behaviour and water quality in the WDN, considering temporal variations of demand, it is suggested to use variable speed pumps (VSP) as well as to inject chlorine at a variable rate. Application of VSP and time-dependent chlorine injection results in improvements such as reduction in energy and disinfection costs, and decrease in disinfection costs in application of HDSM (head-driven simulation method). In HDSM simulation of WDN, a decrease in hydraulic reliability because of shortages in water supply can be mitigated through extra chlorine injection and increase in quality-based reliability. To deal with this challenge, it is recommended to satisfy the hydraulic reliability first and then to evaluate the quality reliability. Furthermore it is necessary to modify the hydraulic reliability relationship to incorporate different components of the WDN other than pumps. This will provide more reliable results for evaluation of the system performance.
Keywords: multi-objective optimisation, aco algorithm, energy cost, disinfection costs, hydraulic reliability, quality reliability
INTRODUCTION
Optimising the operation of water distribution systems (WDSs) depends on issues such as optimising pumping efficiency and water quality, and multiple objectives are thus pursued. These objectives include reduction in energy costs, increase in pumping station reliability so as to optimise pump operation and to reduce chlorination cost, and improving quality-based reliability as to optimise water quality according to residual chlorine. Additionally, one can examine the effect of various techniques, such as using variable speed pumps and different chlorine injection methods, on meeting the objectives of the optimisation.
As the pumping station is one of the most costly components of WDSs and since it has a major role in delivering the required quantity of water with adequate pressure to the final consumers, it is essential to evaluate its reliability to achieve better network performance and to cut costs associated with the pumping station. Further, in many WDSs chlorine is injected at only one point before water entrance to the network. This leads to a high concentration of residual chlorine at nodes closer to injection sources and insufficient values at nodes further from these points. Therefore, there is a great call for more quality sources. However, with an increase in the number of quality management points in the network, chlorine injection then needs to be optimised to reduce the cost of chlorine consumed in the network and to keep the nodal residual chlorine within the standard range at every point in the WDS. According to IRI/VPSPS (2013) the minimum and maximum standard values of residual chlorine in drinking water are recommended to be 0.2 to 0.4 mg/ℓ and 0.8 to 1.2 mg/ℓ, respectively, based on water pH.
Broadly, water distribution system reliability analysis is classified into mechanical-, hydraulic- and quality-reliability analysis. Mechanical reliability in WDSs is defined as the probability that a system component provides continuing operation over a given period of time. According to Tabesh et al. (1998), hydraulic reliability is affected by mechanical reliability or excess of demand. It characterises the probability that the system nodes receive sufficient supply with suitable pressure head. Quality reliability refers to the probability that the provision of required flow is of satisfactory quality within the standard range.
Wagner et al. (1988) and Bao and Mays (1990) examined mechanical reliability and hydraulic reliability, respectively. Gupta and Bhave (1994) studied both mechanical and hydraulic reliability simultaneously. Zhao et al. (2010) analysed the water quality and hydraulic reliability of WDSs. Investigating hydraulic reliability, Mehzad (2011) characterised pumping station reliability as the ability of pumps to supply enough water to consumption nodes with allowable pressure. She proposed a set of fuzzy relationships to investigate the reliability of pumping stations. Also determining the best time for pumping operation during a 24-h period, Vieira et al. (2007) targeted minimising energy costs. Hashemi (2010) and Hashemi et al. (2013) studied single-objective optimisation of energy cost. Using variable-speed pumps, Wu et al. (2012) investigated optimisation of energy cost. Moreover, a few researchers, including Ostfeld and Salomons (2006), have examined scheduling of pumping and booster chlorine injections. Gibbs et al. (2010) considered the booster disinfection dosing problem, including daily pump scheduling, for a real system (Woronora) in Sydney, Australia. Integrating the hydraulic model EPANET and the nonlinear optimisation model Genetic Algorithm (GA), Tabesh et al. (2011) identified optimum dosage of chlorination and located the best places for chlorine injection in the water network. Boccelli et al. (1998) developed a linear optimisation model for the scheduling of disinfectant injections into water distribution systems to minimise the total disinfectant dose required to satisfy residual constraints. Broad et al. (2005) studied the development and design of a water distribution system in New York. In this study, it was assumed that quality injection was performed only in the network entry point and that optimisation was implemented on the value of this injection.
Gupta et al. (2009) studied both the quality and quantity of water to assess the reliability of a WDN using a 'water quality reliability factor' and node flow analysis (HDSM method). Tabesh and Zabihi (2009), using demand-driven simulation (DDSM) and head-driven simulation (HDSM) methods for hydraulic analysis, investigated optimal design of WDS with quality-based constraints. Their results showed that quality constraints are a challenge with pressure constraints, and also showed that the DDSM method needs a shorter time in comparison with the HDSM method, but that in failure conditions, the HDSM method is recommended. Tabesh et al. (2011) developed an optimisation procedure for studying DDSM and HDSM methods, using GA. Kurek and Ostfeld (2014) applied GA to optimise the cost of the energy consumed for pumping while keeping water quality within the standard range.
In comparison with the previous studies, the present study incorporates particular novel features. Previous researches have not dealt with optimum reliable operation of WDS by minimising energy cost and chlorine dosage and maximising hydraulic and quality reliability, by taking into account the effects of time-dependent chlorine injection and pump speed. To overcome the limitations of previous research this study employs an ant colony optimisation algorithm written in C++, and EPANET simulation software, with the models integrated in such a way that not only do they combine the objective functions of pump station cost and chlorination cost but also enhance hydraulic reliability (pumping station) using failure scenarios of pumps. This integration also improves water quality-based reliability under different conditions by examining the potential effect of pumping speed and chlorine injection on pareto curves of pump operation and water quality. This combination of objective functions and decision variables can be used for improving the performance of existing WDSs.
METHODOLOGY
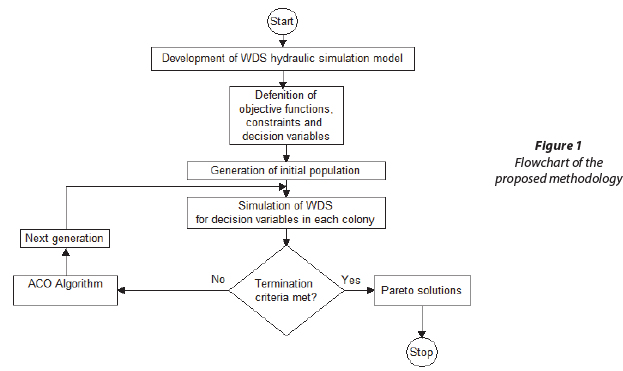
Using an ant colony optimisation algorithm and EPANET simulation software, this study followed a procedure to optimise costs and ensure reliability in water distribution networks. The flowchart of the proposed methodology is shown in Fig. 1.
Optimisation model
This section introduces the proposed equations and describes how the optimisation procedure is implemented. For each optimisation problem, the objective functions, decision-making variables and proposed constraints and parameters should be identified.
Eq. (1) provides the objective function of the present study for optimisation of pump operation with the purpose of minimising the cost of energy consumed by the pumping station.
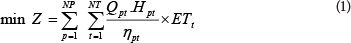
where:
NP is the number of pumps
NT is the number of time periods
Hpt is the head provided by pump pat time t (meters of H2O)
ηpt is the efficiency of pump p at time t
ETt is the electricity tariff at time t (cost per kWh)
Qpt is external discharge from pump p at time t (m3/s)
Because Qpt is the demand value which should be fully supplied, it remained fixed in this study. The above equation is achieved by multiplication of the pump power and the electricity tariff. But because some parameters e. g. γW (special weight of water (kN/m3)) and Δt (in hours) are constant, they can be removed and Eq. (1) is then achieved. Based on this objective function, when the minimum nodal pressure head is provided, the heads provided by pumps will be reduced as much as possible. This is the ultimate purpose of pressure management, leakage management and also water-loss reduction in the network. For optimising amount of chlorination consumption, the 2nd objective function is defined as follows:

where:
M is the number of tanks and chlorine injection reservoirs
T is the number of hydraulic analysis time periods
Qjk is the outflow of tank or injection reservoir j at time k (ℓ/s)
Cjk is chlorine injection dosage in tank or injection reservoir j at time k (mg/ℓ)
The chlorination cost was determined as lUSD/kg per day, according to the Iran Industrial Commercial website (Iran's Industrial-Commercial Comprehensive System, 2012). Therefore Eq. (2) provides the chlorination cost as well. Eq. (3) presents the 3rd objective function to calculate hydraulic reliability.
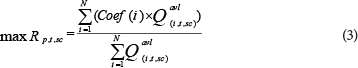
where:
N is the number of nodes
Qavl(i, t, sc) is the outflow at node i at time t in the scth scenario
Scenarios are defined in terms of failure probability of pumps. Coef(i)is the value of the membership degree of the penalty curve at node i which can be calculated from Eq. (4) developed based on Wagner et al. (1988), Mehzad (2011) and Tabesh and Zia (2003):
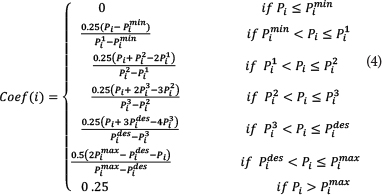
where:
Pi is the pressure head at node
pimin is the minimum absolute pressure
pimax is the maximum absolute pressure at node
Pides is the minimum allowable standard pressure at node
As shown in Fig. 2, by using Eq. (4), value of Coef(i)for the reliability index at each node can be obtained. In effect, the considered reliability index is a function of meeting the desirable hydraulic conditions of the water distribution network.
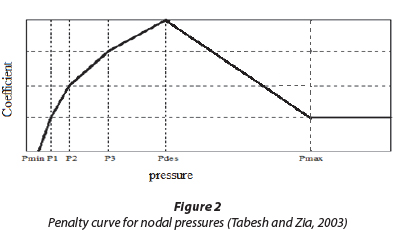
In common methods for evaluation of hydraulic reliability used in many previous studies, the ratio of available flow to required flow has been used. Actually in these studies the reliability index is not sensitive to pressure values higher than Pdes. This kind of index considers reliability of 1 for P > Pdes; however it is obvious that extra pressure is harmful. Therefore a real reliability index should compensate the system in this situation. Tabesh and Zia (2003) combined the concept of HDSM and performance index (PI), which has resulted in Fig. 2. So, by their method, the limiting condition that P > Pdes has been mitigated. Further P1, P2, P3 are optional values for drawing the curve between Pminand Pdesand this part of the curve is drawn using the relationship described by Wagner et al. (1988). To include the issue of pump failure into the objective function (in the case that the pumping station has some pumps that fail in different scenarios), the index of pumping station reliability is calculated as the weighted average of different failure scenarios. If at time t the occurrence of scth scenario is named r
where:
Npu is the number of pumps in the pumping station
Rp,t is the reliability of the pumping station at time t for all possible scenarios
Also, rsc should be determined through pump failure analysis
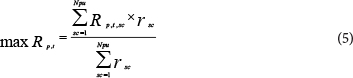
With some changes in the equation used by Gupta et al. (2009), the objective function of quality reliability index is formulated in Eq. (6) as follows:

where:
N is number of demand nodes
S is the number of problem solving steps
Qavlik is the available flow rate at step k
Qreqik is the required flow rate at step k
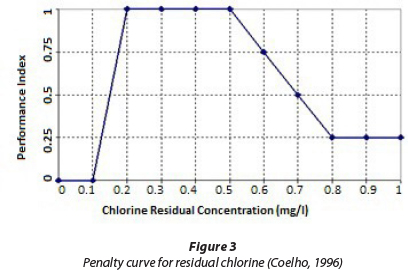
bik is obtained from Fig. 3 upon the water quality criteria at the demand node i and step k
In the conditions with no pressure deficit, the demand and available outflows are equal.
In the present study, the objective functions described earlier are discussed in the form of 3 different scenarios whose descriptions are provided below. To come up with the best multi-objective optimisation solution of the Pareto curve one of the solutions in each scenario is selected through the use of the bargaining technique formulated by Young (1993).
The decision variable is the chlorine injection dosage in all network reservoirs and tanks and also the pump speed in a 24-h time period. Given the huge search scope, the alternative reservoir method (Hashemi, 2010; Hashemi et al., 2012) is used with application of VSP. As such, the hydraulic decision variable in these conditions is the water surface level in the alternative reservoir rather than the variable-speed pump and the quality decision variable is the amount of chlorine injected with variable rate in the reservoirs and tanks.
Pressure constraint in this study is considered as Eq. (7):

where:
Pjk is the pressure at node j at time k (in meters)
Pmin is the minimum allowable pressure (30 m in this study) is Pmax the maximum allowable pressure (50 m in this study) for every node in the network
Also, pumping schedules that cause the water surface level in tanks to be lower than the initial level are eliminated from the analysis. The constraint of surface level drop of tanks in the network is shown in Eq. (8):
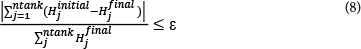
where:
Hjinitial and Hjfinal are the initial and final water level of tank j (in meters), respectively
ε is the allowable error which, based on Hashemi (2010) and Mehzad (2011), has been assigned a value close to 0 (i.e. 0.05).
Quality constraint is also considered in Eq. (6).
Simulation model
Simulation of hydraulic and water quality behaviour in this study is performed using EPANET (USEPA, 2012) software. The software adopts the Gradient Method for hydraulic analysis and Time Driven Method (TDM) for quality analysis. In this study, extended period hydraulic analysis of the network for a period of 24 h is performed. Injection dosage in chlorine sources is considered with variable rate. Variable-speed pumps are also considered. For injection with variable rate, every 24 h is divided into 1-h time steps. For injection dosage within the range of 0 to 0.5 mg/ℓ;, 0.01 mg/ℓ; changes are considered. Injection above the 0.5 mg/ℓ; range leads to an increase in chlorine residual, beyond the standard range, at nodes close to the injection points; therefore it is not considered in this study. In any case, choosing a chlorine injection dose entails the issue that the amount of residual chlorine at some nodes may fall outside the standard range, thereby affecting the quality reliability index. Also, 0.01 steps in injection are selected for the sake of precision. Note that a minimum of 72 h should be considered for quality simulation to eliminate the immediate effects of chlorination on the results,after which time the state of the disinfectant remains stable. To achieve even more reliable results, 144 h of quality simulation is considered in this study. The results of Day 6 (from Hour 120 h to Hour 144) are used in the analysis.
In the HDSM model where the actual performance of the network is simulated, the relationship between pressure and nodal outflow should be taken into account. In this paper, the following relationship (Wagner et al., 1988) identifies the outflow-pressure dependency:
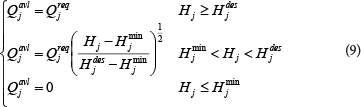
where:
Qjreq is the required flow at node j,
Qjavl is the available flow at node j
Hj is the available head at node j
Hjmin is the absolute minimum head at node j, below which the outflow at the node will be equal to 0
Hjdes is the desired head, above which the outflow at the node will be equal to the required flow.
However, given that the EPANET software considers fixed demands, an independent program written in C++ is used in this study to evaluate head driven simulation.
Solving the optimisation problem
Two objective ant colony optimisation algorithms written in C++ were used in the present study as the optimisation technique. Initially introduced by Colorni et al. (1991), the algorithm is based on the social behaviour of ants seeking a path between their colony and a source of food. The algorithm offers considerable advantages, including simplicity, speed, cost efficiency, and performance. Further, research investigating multiple-objective optimisation of WDSs using the algorithm is sparse. Accordingly, the issue merits further investigation. The bi-divisible ant algorithm developed in this study draws on the procedure proposed by Afshar et al. (2009). Establishing a connection between the optimisation model and hydraulic-quality model in order to reach the optimal solution is an integral part of solving the optimisation problem. To this end, if required, the optimisation problem written in C++ calls the hydraulic and quality simulation model. This is achieved through a Direct Link Laboratory (DLL) file in EPANET's hydraulic-quality model without any programming effort.
Case study
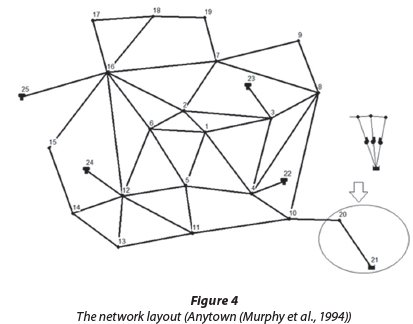
Given the unavailability of required hydraulic and quality data for an actual WDS, the well-known 'Anytown' network is used to evaluate the proposed technique in this study. This network has been employed in a number of studies (e.g. Kurek and Ostfeld, 2014; Walski et al. 1987; Murphy et al., 1994). Another reason for selecting this network is the fact that it possesses the components required for modelling in the present study. Figure 4 offers a schematic representation of the network, in which the pumping station (well and 3 pumps) has been replaced by a surrogate reservoir (21). The information concerning entry and the characteristics of the network's components such as nodes, pipes, tanks, pumps and consumption pattern have been extensively provided by Hashemi (2010), and, for the sake of brevity, are not listed here. Energy tariff values put forward by Ostfeld and Tubaltzev (2008) were used to estimate the cost of the consumed energy.
Regarding calculation of pumping station reliability, broader research is required to determine the failure probability of each of the tanks. Due to lack of access to sufficient information in this regard, values are considered hypothetically and in accordance with Mehzad (2011). As stated in the definition of pumping station reliability through pumps' failure scenarios, failure probability of 1 pump in this system is taken to equal 0.1 and 0.01 for 2 pumps (0.1x0.1=0.01). Additionally, given that failure probability of all 3 pumps in this system is very low and negligible (0.1x0.1x0.1=0.001), the probability that no pump fails is equal to 0.89.
The values of p1, p2 and p3which were referred to in Fig. 2 are 5, 12 and 20 m, respectively, based on the studies carried out by Tabesh and Zia (2003) and Mehzad (2011). Further, the values of pmax, pdes, pminare equal to 100, 30 and 0 m, respectively. Although the pmaxvalue is typically limited to almost 50 m and taking such values as 100 m for pmaaxis unjustified, in order to compare the results with those of previous research in which pmaxvalue was considered equal to 100 m, the same value is also assumed in the present study.
Chlorine is injected into reservoirs and tanks at 5 sites. According to Kurek and Ostfeld (2012), first-order volumetric reaction coefficient was considered equal to -1 ℓ/day and first-order wall reaction coefficient was considered equal to -0.2 m/day.
Based on Hashemi (2010), the value of Χ, which is the factor of pheromone value, equals the cost of the time during which all the pumps are on during the day and is considered 154 086 240 m4/s. In his study, Hashemi (2010) used Χ to determine the penalty function. Further, as shown in Eq. (10), in some conditions a value equal to PEN (a semi-deterministic parameter in m4/s per m), is added to the objective function. This value is applied when pressure at the critical node decreases from 30 m or tank level decreases from its initial value at the end of the day.

where:
PEN is the value of the penalty function
d is the minimum water level in tank at the end of the day, which, according to Zecchin et al. (2005), is considered equal to 1 cm
C (Smax) is the daily cost when all pumps are on
C (Smin) is the daily cost when all pumps are off
Additionally, considering the sensitivity of multi-objective ant colony algorithm, to determine the non-deterministic parameters of the algorithm, it is necessary to carry out a sensitivity analysis of these parameters to come up with the most suitable values of the parameters. Based on Hashemi (2010), Mehzad (2011) and Zeccchin et al. (2005) and also sensitivity analysis procedures conducted in this study, the following parameters and their corresponding values were used for calculations: number of iterations: 500, number of cycles: 20, external archive: 100, weight coefficient α: 1.0, weight coefficient β: 0.0 and pheromone evaporation rate ρ: 0.98
Considering the definitions offered for different scenarios in this study and the need for performing sensitivity analyses for each scenario independently, so as to reach the optimal solution targeted for each scenario, the initial pheromone rate on the routes and the number of ants in each colony has been provided separately for each scenario.
RESULTS AND DISCUSSION
This section describes the results of investigations undertaken for the Anytown network (Murphy et al., 1994) for each scenario. With regard to the Pareto optimal solution curve of scenarios, the best fit to the data points of each curve was adopted. The scenarios were run in a core i5 computer with 4 GB RAM.
Scenario 1: Minimising energy and chlorine cost and maximising quality reliability
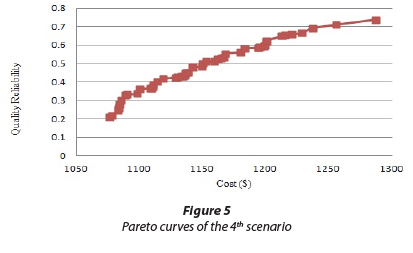
The objective functions associated with the costs have been taken into account as the sum of the objective functions of Eqs (1) and (2) in terms of US dollars (USD) and the objective function of quality reliability has been shown in Eq. (1). Also, constraints of the problem in this scenario, i.e. pressure and surface level drop in the network, are provided in Eqs (7) and (8); in addition, as introduced in Eq. (6), quality constraint has been imposed on the problem as the quality reliability constraint. The outcome of this optimisation model has been illustrated in Fig. 5.
As the objective function of chlorine cost is the amount of the injected chlorine multiplied by the flow, with a decrease in chlorine consumption rate the cost in the HDSM will be lower than that in the DDSM. Also, by using the HDSM, any demand failure can be included in estimating quality reliability. Since in this method the purpose is only to inject chlorine into the network, the program increases the rate of chlorine injected into the reservoirs and tanks, to compensate for the failure to satisfy the required demand which is considered in quality reliability. Accordingly, quality reliability is estimated to be higher in the HDSM than in the DDSM. To fix this problem, quality reliability in the HDSM should be calculated irrespective of the flow required by the network and the network should become hydraulically reliable prior to quality reliability analysis.
Given that designing pumping stations in water networks is based on the required head and flow at the peak demand hours, in off-peak hours the selected pump will apply more excess pressure to the network and will also consume more energy than required. Therefore, to reduce energy costs, leakage, and wasted water as well as excess pressure, a variable-speed pump which rotates at a lower speed at off-peak hours is recommended as an appropriate tool in the network. It can also be argued that when both chlorine injection rate and pump speed are variable a better compliance with the hydraulic and quality conditions will be achieved. So in this study, in all scenarios, a variable injection rate and pump speed have been considered.
Investigating and analysing the conducted sensitivity in this scenario, the initial pheromone rate of the routes has been considered as 250 and the number of ants in each colony has been taken equal to 20. Drawing on Young's (1993) bargaining technique, the selected solution is as follows: cost = 1200.93 USD and reliability = 0.6221. According to Fig. 5, allocating more money, about 200 USD, has resulted in a 60% growth in quality reliability. Therefore, it can be suggested that spending more money on chlorination will play a greater role in enhancing quality reliability.
Scenario 2: Minimising energy and chlorine cost and maximising hydraulic reliability
The objective functions associated with the cost are taken into consideration as the sum of the objective functions in Eqs (1) and (2) in terms of USD, and the hydraulic reliability is considered in Eq. (5). Also, constraints of the problem, namely, pressure and surface level drop in the network, are provided in Eqs (7) and (8); in addition a quality-reliability constraint has been imposed based on Eq. (6). The outcome of this optimisation has been presented in Fig. 6.
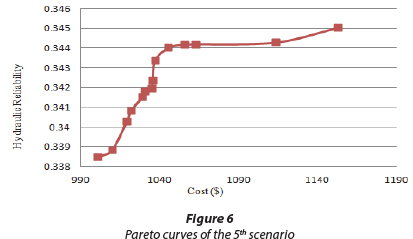
Investigating and analysing the conducted sensitivity in this scenario, the initial pheromone amount in the routes has been taken equal to 200 while the number of ants in each colony has been considered at 25; Drawing on Young's (1993) bargaining technique, he selected solution is as follows: cost = 1062.56 USD and reliability = 0.344. As indicated in Fig. 6, in return for spending more, about 150 USD, hydraulic reliability has increased by merely 0.007 and has not exceeded 30%. Likewise, to assist decision makers there is a need to enhance hydraulic reliability in order to achieve a more tangible solution and to establish better interaction in the Pareto curve.
Scenario 3: Minimising energy and chlorine cost and maximising quality and hydraulic reliability (integrated reliability)
The objective function associated with cost has been considered as the sum of the objective functions of Eqs (1) and (2) in terms of USD and the objective function of the integrated reliability has been considered as Eq. (5) multiplied by Eq. (6). Also, constraints of the problem in this scenario, i.e. pressure and surface level drop in the network, are provided in Eqs (7) and (8); in addition, the quality constraint has been imposed on the problem as the quality-reliability constraint based on Eq. (6). The outcome of this optimisation is presented in Fig. 7.
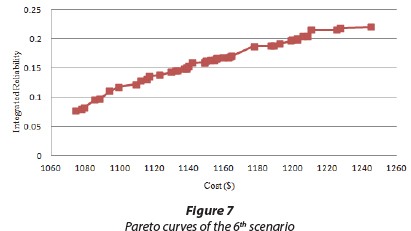
For sensitivity analysis in this scenario, the initial pheromone value of the routes has been considered as 300 and the number of ants in each colony has been taken equal to 25. Drawing on Young's (1993) bargaining technique, the selected solution is as follows: cost = 1210.38 USD and reliability = 0.2155. As shown in Fig. 7, by allocating more money, about 200 USD, integrated reliability growth is confined to 0.15 and integrated reliability index has not exceeded 23%. Consequently, it can be concluded that since integrated reliability has been considered as the quality reliability multiplied by the hydraulic reliability and also as no tangible changes were observed in the previous section in hydraulic reliability values, the drop in integrated reliability has been due to problems of hydraulic reliability; hence, once more, improving the hydraulic reliability equation is stressed.
In order to draw a better comparison, the results obtained from the 1st, 2nd and 3rd scenarios are presented in a single diagram in Fig. 8 and the created concentration is a result of integrating the 3 diagrams (it is worth noting that the vertical axis in Fig. 8 is associated with each of these scenarios which include quality reliability in the 1st scenario, hydraulic reliability in the 2nd scenario and consolidation reliability in the 3rd scenario).
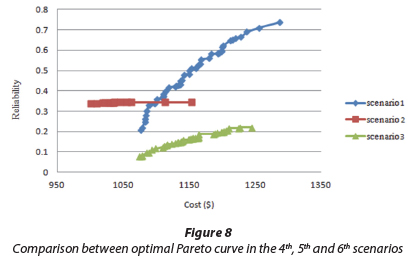
Given the comparison made between optimal Pareto curve in the 1st, 2nd and 3rd scenarios, in return for an almost equal range of cost allocated to energy and chlorination for all 3 scenarios, it can be concluded that: integrated reliability < hydraulic reliability < quality reliability
This conclusion, which is indicative of the lower amount of hydraulic and integrated reliability compared to quality reliability, is justifiable according to the explanations offered in the 3rd scenario, since integrated reliability is taken into account as the multiplication of quality and hydraulic reliability and also according to the explanations offered in the 2nd scenario, where the importance of improving hydraulic reliability was highlighted. Further, the results obtained from comparing the 1st, 2nd and 3rd scenarios emphasize considering a better equation for computing hydraulic reliability where, in addition to the pumps, the conditions of different components of the network are also taken into account. As indicated, by improving the hydraulic reliability equation, this index as well as the integrated reliability will increase in the water distribution network which will subsequently enhance the network reliability.
CONCLUSIONS
In the present paper, in order to optimise the operation of water distribution networks, the objective functions of reducing energy cost of the pumping station, reducing chlorination cost, and increasing hydraulic as well as quality reliability were integrated. The results were produced in the form of tradeoff curves. In the following, the results of each scenario are discussed.
In all scenarios, the sum of the consumed energy and chlorination cost were minimised by employing a variable-speed pump along with variable chlorination rate. Quality reliability in the 1st scenario was at an acceptable level. In the 2nd scenario a need was felt to improve the proposed hydraulic reliability equation by taking into account the other network components besides the pump, to make the task of decision making more tangible for managers. In the 3rd scenario, the need to improve the hydraulic reliability equation which will further result in integrated reliability was highlighted. Therefore, given the explanations offered in each scenario as well as the priority of the objective, decisions can be made about optimising pump performance and water quality according to different conditions and the decision maker's judgment.
REFERENCES
AFSHAR A, SHARIFI F and JALALI MR (2009) Non-dominated archiving multi-colony ant algorithm for multi-objective optimisation: application to multi-purpose reservoir operation. Eng. Optimis. 41 (4) 313-325. [ Links ]
BAO YX and MAYS LW (1990) Model for water distribution system reliability. Hydraul. Eng. 116 (9) 1119-1137. [ Links ]
BOCCELLI DL, ROSSMAN LA, TRYBY ME, UBER JG, ZIEROLF ML and POLYCARPOU MM (1998) Optimal scheduling of booster disinfection in water distribution system. Water Resour. Plann. Manage. 124 (2) 99-111. [ Links ]
BROAD DR, DANDY GC and MAIER HR (2005) Water distribution system optimisation using metamodels. Water Resour. Plann. Manage. 131 (3) 172 180. [ Links ]
COELHO GM (1996) Standardization of the preparation and quantitation of water-accommodated fractions of petroleum for toxicity testing original research article. Mar. Pollut. Bull. 40 (11) 1007-1016. [ Links ]
COLORNI A, DORIGO M and MANIEZZO V (1991) Distributed optimisation by ant colonies. In: Proceedings of the First European Conference on Artificial Life, 11-13 December 1991, Paris, France. [ Links ]
GIBBS MS, DANDY GC and MAIER HR (2010) Calibration and optimisation of the pumping and disinfection of a real water supply system. Water Resour. Plann. Manage. 136 (4) 493-501. [ Links ]
GUPTA R and BHAVE PR (1994) Reliability analysis of water distribution systems. Environ. Eng. 120 (2) 447-460. [ Links ]
GUPTA R, SUSHMA D and PRAMOD RB (2009) Water quality reliability analysis of water distribution networks. In: Proceedings of the 33rd International Association of Hydraulic Engineering & Research Congress (IAHR), 9-14 August 2009, Vancouver. [ Links ]
HASHEMI SS (2010) Optimisation of water networks by minimizing pumping energy. MSc thesis, School of Civil Engineering, College of Engineering, University of Tehran. [ Links ]
HASHEMI SS, TABESH M and ATAEE KIA B (2013) Ant-colony optimisation of pumping schedule to minimize the energy cost using variable-speed pumps in water distribution networks. Urban Water J. 11 (5) 335-347. [ Links ]
IRAN'S INDUSTRIAL-COMMERCIAL COMPREHENSIVE SYSTEM (2012) Tehran acid Kimia engineering-trading company and the price list of several other companies in the field of water disinfection products. URL: http://www.batis.sanaatgar.com (Accessed 15 December 2012). [ Links ]
IRI/VPSPS (ISLAMIC REPUBLIC OF IRAN, VICE PRESIDENCY FOR STRATEGIC PLANNING AND SUPERVISION) (2013) systems, Guideline No. 117-3 (First Revision). Office of Deputy for Strategic Supervision, Department of Technical Affairs, Ministry of Energy, Bureau of Engineering and Technical Criteria for Water and Wastewater, Tehran, Iran. [ Links ]
KUREK W and OSTFELD A (2014) Multi-objective water distribution systems control of pumping cost, water quality, and storage-reliability constraints. Water Resour. Plann. Manage. 140 (2) 184-193. [ Links ]
MEHZAD N (2011) Multi-objective optimisation of water distribution networks exploitation taking into account the effects of the pump and the tank. MSc thesis, School of Civil Engineering, College of Engineering, University of Tehran. [ Links ]
MURPHY LJ, DANDY GC and SIMPSON AR (1994) Optimum design and operation of pumped water distribution systems. In: Proceedings of the Conference on Hydraulics in Civil Engineering, February 1994, Australia. [ Links ]
OSTFELD A and SALOMONS E (2006) Conjunctive optimal scheduling of pumping and booster chlorine injections in water distribution systems. Eng. Optimis. 38 (3) 337-352. [ Links ]
OSTFELD A and TUBALTZEV A (2008) Ant colony optimisation for least-cost design and operation of pumping water distribution systems. Water Resour. Plann. Manage. 134 (2) 107-119. [ Links ]
TABESH M (1998) Implications of the pressure dependency of outflows on data management, mathematical modeling and reliability assessment of water distribution systems. PhD thesis, Civil Engineering Dept., University of Liverpool. [ Links ]
TABESH M, AZADI B and ROOZBAHANI A (2011) Quality management of water distribution networks by optimizing dosage and location of chlorine injection. Int. J. Environ. Res. 5 (2) 321-332. [ Links ]
TABESH M, JAMASB M and MOEINI R (2011) Calibration of water distribution hydraulic models: A comparison between pressure dependent and demand driven analyses. Urban Water J. 8 (2) 93-102. [ Links ]
TABESH M and ZABIHI M (2009) The effects of quality constraints in water distribution networks optimisation. In: Proceedings of the 4th National Congress on Civil Engineering, 6-8 May 2009, Iran. [ Links ]
TABESH M and ZIA A (2003) Dynamic management of water distribution networks based on hydraulic performance analysis of the system. Water Sci. Technol.: Water Supply 3 (1) 95-102. [ Links ]
VIEIRA F, RAMOS HM and COVAS DC (2007) Multi-criteria optimisation of energy efficiency in water supply systems. In: Proceedings of the Conference on Water Management Challenges in Global Changes, 3-5 September 2007, London. [ Links ]
WAGNER J, SHAMIR U and MARKS D (1988) Water distribution system reliability: analytical methods. Water Resour. Plann. Manage. 114 (3) 253-275. [ Links ]
WALSKI TM, BRILL ED, GESSLER J, GOULTER LC, JEPPSON RM, LANSEY K, LEE HL, LEIBMAN JC, MAYS L, MOEGAN DR and ORMSBEE L (1987) Battle of the network models: epilogue. Water Resour. Plann. Manage. 113 (2) 191-203. [ Links ]
WU W, SIMPSON AR, MAIER HR and MARCHI A (2012) Incorporation of variable-speed pumping in multiobjective genetic algorithm optimisation of the design of water transmission systems. Water Resour. Plann. Manage. 138 (5) 543-552. [ Links ]
YOUNG HP (1993) An evolutionary model of bargaining. Econ. Theory 59 (1) 145-168. [ Links ]
ZHAO Y, LUO B, ZHUANG B and ZHAO X (2010) Hydraulic and water quality reliability analysis of water distribution system. In: Proceedings of the 2nd Conference on Environmental Science and Information Application Technology (ESIAT), 17-18 July 2010, Wuhan. [ Links ]
ZECCHIN AC, SIMPSON AR, MAIER HR and NIXON JB (2005) Parametric study for ant algorithm applied to water distribution system optimisation. Evol. Comput. 9 (2) 175-191. [ Links ]
Received 15 January 2014
Accepted in revised form 7 January 2015
* To whom all correspondence should be addressed. +98-912-5204208; e-mail: nadia babaei@ut.ac.ir

