


Serviços Personalizados
Artigo
 Inglês (pdf)
 Artigo em XML
 Referências do artigo
Indicadores

Links relacionados
-
 Citado por Google
 -
 Similares em Google
Compartilhar

 Permalink
Water SA
versão On-line ISSN 1816-7950
versão impressa ISSN 0378-4738
Water SA vol.41 no.1 Pretoria Jan. 2015
http://dx.doi.org/10.4314/wsa.v41i1.12
Temporal and spatial dietary dynamics of the longspine glassy (Ambassis ambassis) in the St Lucia estuarine system, iSimangaliso Wetland Park
David C DyerI, *; Renzo PerissinottoI, II; Nicola K CarrascoI
ISchool of Life Sciences, University of KwaZulu-Natal, Westville Campus, Durban 4000, Private Bag X54001, South Africa
IIDST/NRF Research Chair in Shallow Water Ecosystems, Nelson Mandela Metropolitan University, PO Box 77000, Port Elizabeth 6031, South Africa
ABSTRACT
Among the 155 recorded fish species in the St Lucia estuarine system, Ambassis ambassis is one of the most prominent. After a decade dominated by dry and hypersaline conditions, the St Lucia system has changed dramatically with the onset of a new wet phase in 2011. In response, A. ambassis has expanded its distribution throughout the system. Stable δ15N and δ13C isotope analysis was used in conjunction with gut content analysis to elucidate the diet of this species at 5 representative sampling localities. Zooplankton as well as terrestrial and aquatic insects were prevalent in the diet. Non-metric multidimensional scaling analysis revealed a considerable dietary overlap for the fish collected at the different localities. Seasonally, trophic position differed significantly, with the dry season showing consistently higher isotopic signatures at all sites. A significant relationship was identified between trophic position, salinity and temperature, indicating the potential effect of these variables on the diet. The ability of A. ambassis to link lower trophic level organisms, such as zooplankton, with larger piscivorous predators is thus indicative of the vital role this species occupies in the food webs of the St Lucia system.
Keywords: Ambassis ambassis, iSimangaliso Wetland Park, stable isotopes, gut content analysis, fish diet
INTRODUCTION
Lake St Lucia is the largest estuarine lake in Africa and has historically been considered the most important fish and prawn nursery along the southeast coast of Africa. The system is an integral part of the iSimangaliso Wetland Park, which is South Africa's first UNESCO World Heritage Site and a RAMSAR Wetland of International Importance (Taylor, 2006). With a recorded fish diversity of 155 species, this system is one of the most important lakes in the world (Cyrus, 2013). However, it is exposed to drastic spatio-temporal changes in response to climatic shifts in the region, as well as anthropogenic impacts such as water abstraction from inflowing rivers. Characteristically, the system experiences alternating wet and dry phases, which can persist for 4 to 10 years (Begg, 1978). Following a decade-long dry phase, the system has recently entered a wet phase since the beginning of 2011. Higher than average rainfall in the catchment of the system in late 2010 resulted in large amounts of freshwater entering the estuary, raising water levels and diluting salinities (Taylor et al., 2013). In addition, the Mfolozi River has recently been linked to the estuary via an artificial beach channel, providing freshwater and periodic marine input into the system.
The family Ambassidae has historically been well-represented in the St Lucia system, with 3 species recorded since the first comprehensive fish checklist compiled by Whitfield in 1980. Three species, Ambassis ambassis (formerly A. productus), A. natalensis and A. dussumieri (formerly A. gymnocephalus) have subsequently been recorded in the St Lucia and Mfolozi River systems by various authors (Vivier et al., 2010a; Vivier et al., 2010b; Cyrus et al., 2011). During the most recent survey conducted in 2008 only A. ambassis and A. natalensis were present in the system (Vivier et al., 2010a). Ambassis ambassis accounted for 12.7% of the total catch during this survey and around 10% in the survey conducted by Cyrus and Vivier (2006), making it the second-most dominant fish species after the Mozambique tilapia, Oreochromis mossambicus.
Ambassis ambassis has a wide (17-32°C) temperature tolerance range (Martin, 1988), but relatively low (2-35) salinity tolerance (Skelton, 1993; Whitfield, 1998). Although it is generally considered a euryhaline species, its distribution is often limited to estuarine areas with salinity below 10 (Martin, 1988; Martin, 1989; Whitfield, 1998). Previous studies have reported that the species feeds at night and early in the morning on planktonic crustaceans, fish fry and larvae, as well as insects (Martin and Blaber, 1983; Skelton, 1993; Whitfield, 1998). Ambassis ambassis is the largest of the Ambassidae reaching sexual maturity between 40 and 50 mm standard length, probably owing to the energy-rich composition of its diet (Martin and Blaber, 1983; Martin, 1988; Whitfield, 1998). Based on gut content data, Martin and Blaber (1983) showed that the Ambassidae can be separated by dietary composition, with A. ambassis being the only member to display piscivorous feeding behaviour.
This species has been classified as a resident species in estuaries, breeding under estuarine conditions (Whitfield, 1998; Cyrus, 2013). Most of the St Lucia system has historically had salinities exceeding 15, thus limiting A. ambassis densities (Martin, 1983). However, the recent shift to a wet phase, dominated by oligo/meso-haline conditions, has resulted in the spread of this species within the system. Apart from being a popular live-bait used by recreational fishermen, A. ambassis is also a key prey species for many of the estuarine piscivorous bird and fish species found in the St Lucia system, forming an important link in its food webs (Martin, 1983).
Stable isotope ecology has become an indispensable and informative tool for predicting the flow of organic matter through food webs in a variety of habitats (Peterson and Fry, 1987; Bouillion et al., 2011; Wada et al., 2013). The use of stable isotopes provides a better long-term image of the diet of an organism, rather than the more temporally-biased view which would be provided by gut content analysis (GCA) alone (Hesslein et al., 1993; Van der Zanden et al., 1997). As it considers assimilated material and not only ingested material, stable isotope analysis also gives a more accurate estimate of dietary composition over longer time periods (Gearing, 1991; Pinnegar and Polunin, 1999). This is particularly relevant for fish muscle tissue, where turnover rates can be as low as 0.1 to 0.2% per day (Hesslein et al., 1993). Stable carbon isotopes fractionate very little between energy transfers and can be used to confidently quantify food sources of an individual in aquatic systems (Van der Zanden and Rasmussen, 2001). Trophic positioning of consumers within a food web can be determined using stable nitrogen isotopes, as these have a higher rate of fractionation between energy transfers (DeNiro and Epstein, 1978; Van der Zanden et al., 1997). It is however advantageous to use a combination of stable isotope analysis and GCA to determine dietary composition.
The aim of this study was to determine the dietary dynamics of A. ambassis across spatial and temporal scales within the St Lucia estuarine system. Understanding how this species responds to changes in environmental conditions, in terms of its diet, will provide information on the functioning of the food webs in this estuarine system, which is critical for conservation and management.
MATERIALS AND METHODS
Habitat characteristics
The northern region of KwaZulu-Natal is characterised by 2 seasonal periods, wet periods with frequent rainfall and dry periods when rainfall is virtually absent. In order to account for the slow turnover rate of carbon and nitrogen within the tissue of the fish, sampling was carried out late in the respective seasons, in October/November 2012 (end of dry season) and February/March 2013 (end of wet season).
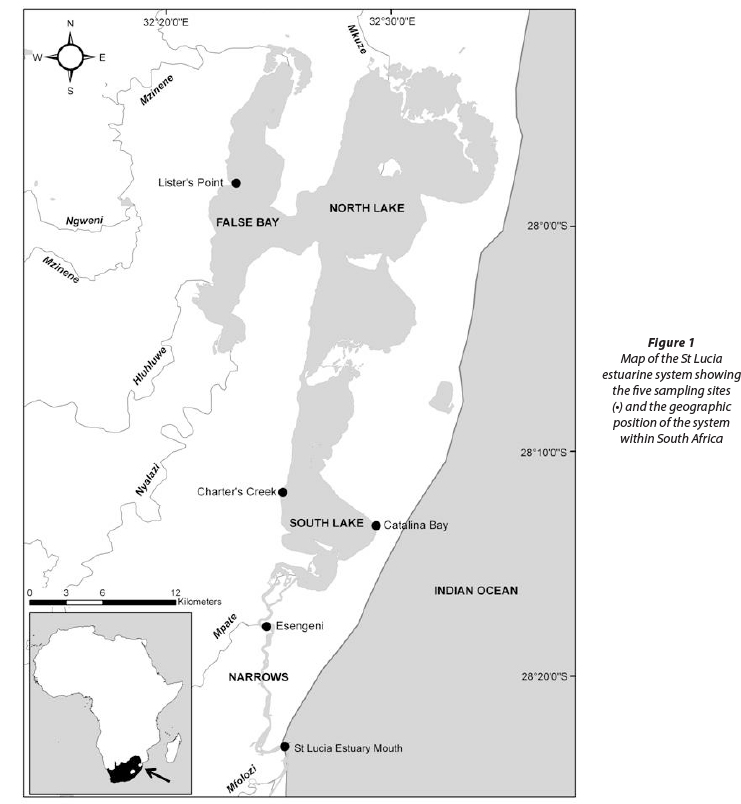
Five representative sampling sites were chosen around the St Lucia estuarine system, each representing a different area and thus different environmental conditions within the system (Perissinotto et al., 2013a). Lister's Point in False Bay, Charter's Creek and Catalina Bay on the Western and Eastern Shores of South Lake respectively, Esengeni in the Narrows and the mouth itself were sampled during the wet and dry seasons (Fig. 1).
Physico-chemical parameters such as temperature, salinity, pH, dissolved oxygen and turbidity were measured in situ with a YSI 6600-V2-D multi-probe system coupled with a 650 MDS data logger. Measurements were taken at the sediment-water interface with the exception of the mouth and Esengeni, where surface and bottom measurements were taken due to greater water depth (< 2 m).
Sample collection and preparation
Isotope material from ~20 Ambassis ambassis individuals was collected along with any potential food sources which were present at each of the sampling sites during the wet and dry season. Samples of detritus, sediment organic matter (SOM), particulate organic matter (POM), zooplankton, benthic macrofauna, dominant macroalgae, and macrophytes, as well as fringing and recently submerged vegetation, were collected at the five study sites, where available.
Fish were collected using a fine-mesh cast net with a diameter of 2.44 m, operated from the shore or from a ski boat. Samples were also obtained from illegal gill nets which had been confiscated by the Ezemvelo KZN Wildlife conservation authority. A total of 200 A. ambassis specimens were collected at the five study sites during the wet and dry seasons between March 2012 and March 2013 and subsequently frozen (-20°C) prior to laboratory processing. Standard length (SL) was measured in mm for each fish collected. Fish ranged in size from 45 to 135 mm SL, which covers the range from size at sexual maturity (40-50 mm SL) to near the maximum size recorded for this species in southern African waters (140 mm SL) (Whitfield, 1998). For stable isotope analysis, 98 of the fish collected were used (~10 per site, per season). Dorsal, white muscle tissue was excised from each individual and lipid treated in a solution of methanol, chloroform and distilled water in the ratio 2:1:0.8, respectively (Bligh and Dyer, 1959). Thereafter, samples were dried at 60°C for 24 h in an air-circulated oven. White muscle tissue is used for stable isotope analysis to limit the variability in 515N values, which can arise when using other tissue types (Pinnegar and Polunin, 1999). The fish used for isotope analysis ranged in size from 40 to 90 mm SL.
Zooplankton samples were collected either with an epi-benthic sled (200 μm, 37 cm diameter) or with a hand net (55 μm, 26 cm diameter), both operated from the shore or from a ski boat where necessary. Samples were concentrated onto 20 μm mesh nylon filters, placed into Petri dishes and frozen (-20°C) prior to laboratory processing. Once thawed, each sample was sorted into the dominant taxa present at the time of sampling. Where possible, 20 to 200 whole individuals of the dominant taxa were used per replicate for the analysis. Samples were first lipid-treated for 2 h (Bligh and Dyer, 1959), then acid-treated to remove any carbonates (Carabel et al., 2006; Soreide et al., 2006) and finally rinsed in excess distilled water before being oven-dried at 60°C for 24 h.
Samples of benthic macrofauna were collected using a Zabalocki-type Ekman grab. Grabs were emptied into 20 I buckets, and benthic invertebrates re-suspended by adding water to the samples and stirring vigorously. The supernatant was poured through a 500 μm sieve and the specimens retained emptied into a plastic jar. Samples were subsequently frozen (-20°C) prior to laboratory processing. Once in the laboratory, organisms were sorted into the dominant taxa. Single tissue samples were extracted from larger organisms. This material was treated with excess 2% HCl for 24 h, in order to remove any shell fragments. Smaller gastropods and bivalves were used whole. Gastropods were treated with 2% HCl for 24 h to dissolve their shells. The smaller bivalves were dried and tissue was then scraped from the inside of the shells. Triplicate samples were prepared where possible, using as many individuals as necessary to attain the required weight for analysis.
Detritus material was collected from the water edge and frozen (-20°C) prior to laboratory processing. After treating the samples with excess 2% HCl to remove biogenic carbonates, samples were rinsed with distilled water and oven-dried at 60°C for 24 h.
Dominant macroalgae, macrophytes and any fringing and submerged vegetation were collected where available from each of the study sites. This material was thoroughly rinsed with distilled water and oven-dried at 60°C for 24 h.
POM was collected by taking triplicate water samples at each of the study sites. These samples were filtered onto pre-combusted (450°C for 6 h) glass fibre filters (GF/F) with the aid of a vacuum filtration manifold. Once in the laboratory, the filters were treated with excess 2% HCl to remove any inorganic carbon and dried in an air-circulated oven at 60°C for 24 h.
Triplicate SOM samples were collected from each site by collecting the upper centimetre of sediment from a 20 mm diameter core and frozen (-20°C) prior to laboratory processing. In the laboratory, sediment samples were treated with excess 2% HCl for a minimum period of 24 h, in order to remove any carbonates. Samples were thoroughly rinsed with distilled water and subsequently oven-dried at 60°C for 24 h.
Stable isotope analysis
Once dried, sediment samples were ground with a mortar and pestle and placed into Eppendorf™ micro-centrifuge tubes. Treated filters were packaged into tin-foil envelopes once dry. Animal, plant and algal samples were homogenised into a fine powder with the aid of a sterilised mortar and pestle and weighed out into 5 x 8 mm microanalysis tin capsules. For animal tissues, 1 mg of the homogenised powder was packaged into the capsules for analysis, while plant, algae and detritus required a larger sample (2 mg) to attain an accurate signature.
All samples were then sent to IsoEnvironmental cc based at Rhodes University, Grahamstown, for analysis. Here the samples were analysed using a Europa Scientific Integra isotope ratio mass spectrometer linked to an ANCA SL elemental analyser. Ratios were expressed as the parts per thousand deviation from the standard (atmospheric nitrogen for nitrogen and Vienna Pee Dee Belemnite for carbon) in delta (δ) notation according to:

where:
Based on the results of the analysis an accuracy of 0.08%o and 0.11%o was measured for carbon and nitrogen, respectively.
Dietary composition and trophic positioning
Gut content analysis was conducted on each of the 200 A. ambassis specimens collected. Once thawed, specimens were gutted, and the entire gut was extracted and preserved in a 10% phloxine-stained formalin solution. Each gut was analysed under a dissecting microscope (2-30x magnification), and the visible contents were classified into the most likely dietary sources. Following Hyslop (1980), 2 methods were used to quantify the contents. A numerical abundance method was used for all dietary items which could be counted (e.g. zoo-plankton and other invertebrates) and a frequency of occurrence method was used to determine the proportion of fish which consumed a particular dietary item. In the event that dietary items could not be counted, such as detritus and mac-roalgae, the proportion of the total gut content was estimated on a counting grid and expressed as a percentage. In order to combine the results from the two GCA methods, the proportion of countable constituents was calculated from a corrected maximum, from which the major uncountable dietary items had been removed. Thus, if uncountable material accounted for 10% of the gut contents, the results of the numerical abundance method would be calculated out of a maximum of 90%.
Following Post (2002), trophic position was calculated with the following formula:

where:
δ15Nconsumer is the nitrogen signature of the consumer
δ15Nbase is that of the base of the food chain chosen based on its position relative to the consumer
λ refers to the trophic level of the base (for primary producers, δ = 1)
Δn is the average trophic enrichment of nitrogen (3.4%)
The trophic base was selected separately for each sampling site, in order to give an accurate estimation of how far the consumer is from the trophic base.
Statistical analysis
Statistical analyses were performed using IBM SPSS Statistics version 21. Stable carbon and nitrogen isotope ratios of all possible food sources were analysed using a 2-way ANOVA. Potential differences between the sources in the wet and dry seasons and among the study sites were determined and Tukey's HSD post-hoc comparisons identified specific differences between sources. To ensure that the assumptions of the tests were met, data were checked for normality and the residuals of the ANOVA were checked for homoscedasticity. The assumption of homoscedasticity was not met for any of the data, but Zar (1996) states that ANOVA is robust enough to overcome this.
In order to determine the likely contribution of each potential food item to the diet of A. ambassis at the five study sites during the wet and dry season, SIAR (stable isotope analysis in R) version 4.0 was used to generate mixing models, based on the standard corrected carbon and nitrogen ratios (Parnell et al., 2010). A trophic enrichment factor (TEF) was incorporated in the model, using values of 3.4% for δ15N and 1% for δ13C (Smit, 2001; Carrasco et al., 2012; Dyer et al., 2013). A standard deviation of 1% was used for both carbon and nitrogen signatures, to remove any bias in the variability of trophic fractionation among the sources (Caut et al., 2009; Inger et al., 2010). Dietary items collected at the sampling sites during the different seasons were used to run the models. Items which were not collected were excluded from the model, as no signature was available. For the SIAR modelling, it is necessary to assume that there is restricted movement of these fish between sampling sites.
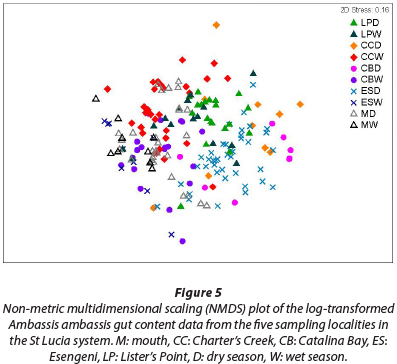
Primer version 6 multivariate statistics package (Clarke and Gorley, 2006) was used to test for spatial dietary differences based on the gut contents of Ambassis ambassis. A one-way analysis of similarity (ANOSIM) was used to test for differences among the different sampling sites, taking wet and dry season into account. The data were log-transformed in order to minimise the effect of dietary items which were dominant, thus accounting for total dietary composition. A Bray-Curtis similarity coefficient was used to calculate the similarity of the data among sites. The ANOSIM calculates a Global R value using randomisation to determine the average of the ranked dissimilarities within and among groups. An R value of 1 indicates the greatest dissimilarity possible (i.e. the biggest difference) and a value of 0 indicates no dissimilarity (i.e. the most similar). The similarity matrix was then used to create NMDS plots, using 100 iterations in order to generate the most likely outcome. A 2-dimensional plot was generated from the output of the analysis. In order to gain the best image of the groupings, obvious outliers were removed when the plot was generated.
In order to determine whether there was a significant relationship between fish size and the relative isotope ratios, a simple linear regression was performed on the δ15N and δ13C signatures of A. ambassis against the measured lengths of the fish sampled. To test whether the environmental variables affect the trophic level of the fish at the sampling sites, a simple linear regression was performed on the calculated trophic level of A. ambassis and the physico-chemical parameters that were measured at each sampling site.
RESULTS
Habitat characteristics
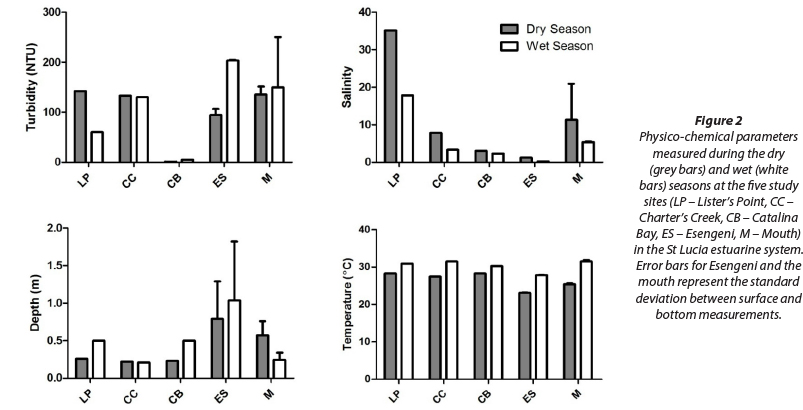
The physico-chemical data (Fig. 2) show a distinct difference between the wet and dry seasonal periods. Throughout the system, salinity exhibited a marked decrease in the wet season, compared to the dry season.
Temperatures ranged from 31.8°C at the mouth during the wet season to 22.9°C at Esengeni during the dry season. Catalina Bay had the lowest turbidity in the wet and dry seasons, with 5.2 NTU and 0.7 NTU, respectively. The highest turbidity recorded during the wet and dry seasons was at the mouth, with values of 151 NTU and 250 NTU, respectively. The depth data shows that Esengeni was the deepest site sampled, with a maximum depth of 1.82 m recorded during the wet season, whereas Charter's Creek was the shallowest site sampled, with a maximum depth of 0.21 m during the wet season (Fig. 2).
Temporal and spatial variation in stable isotope signatures of dietary sources
Lister's Point
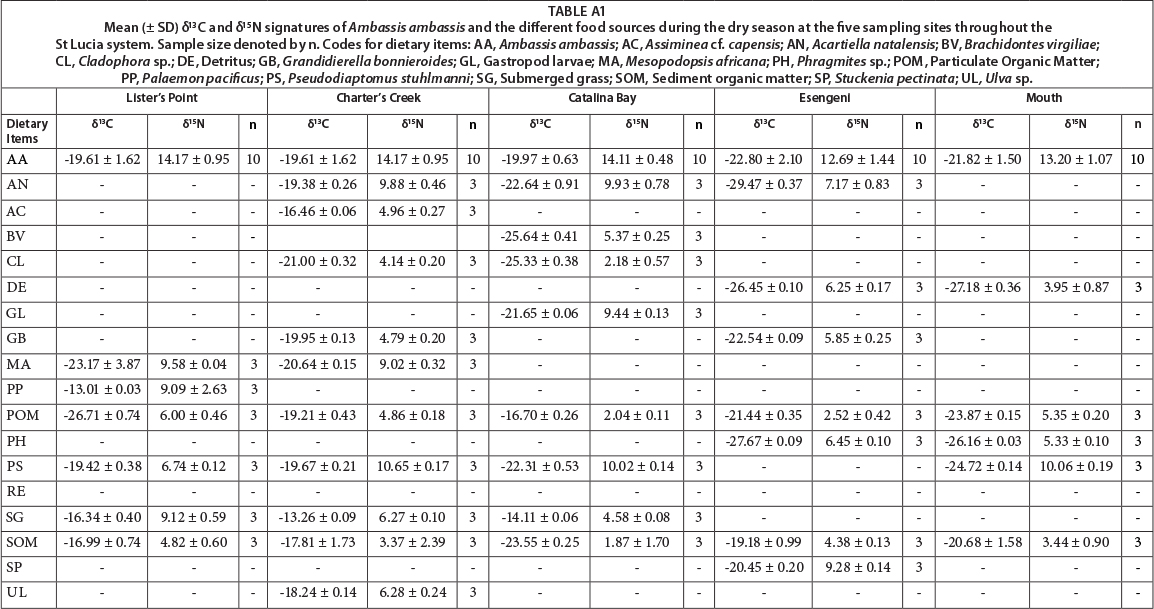
All dietary sources were significantly different from each other in terms of their δ13C (F = 25.97, p = 0.001) and δ15N (F = 26.16, p = 0.001) signatures. There was, however, no significant difference in the δ13C (F = 0.002, p = 0.95) and δ15N (F = 0.005, p = 0.96) signatures of the dietary sources between the wet and dry seasons. The δ13C signatures varied greatly among the different sources, with values between -26.71%o for POM and -12.86%o for submerged grass. The δ15N signatures also varied greatly, with values ranging from 4.82% for SOM to 12.81%o for the shrimp Palaemon pacificus (Appendix: Tables A1 and A2).
Charter's Creek
There was a significant difference between the different dietary sources, both in terms of their δ13C (F = 42.98, p = 0.001) and δ15N (F = 31.22, p = 0.001) signatures. The δ15N signatures were statistically similar for the wet and dry seasons (F = 2.332, p = 0.13), whereas the δ13C signatures were significantly different between seasons (F = 11.44, p = 0.001). The δ13C signatures of the sources ranged from -22.91% for Brachidontes virgiliae to -13.02% for submerged grass. The δ15N sources had a wide range, with values ranging from 1.21% for SOM to 12.59% for Mesopodopsis africana (Appendix: Tables A1 and A2).
Catalina Bay
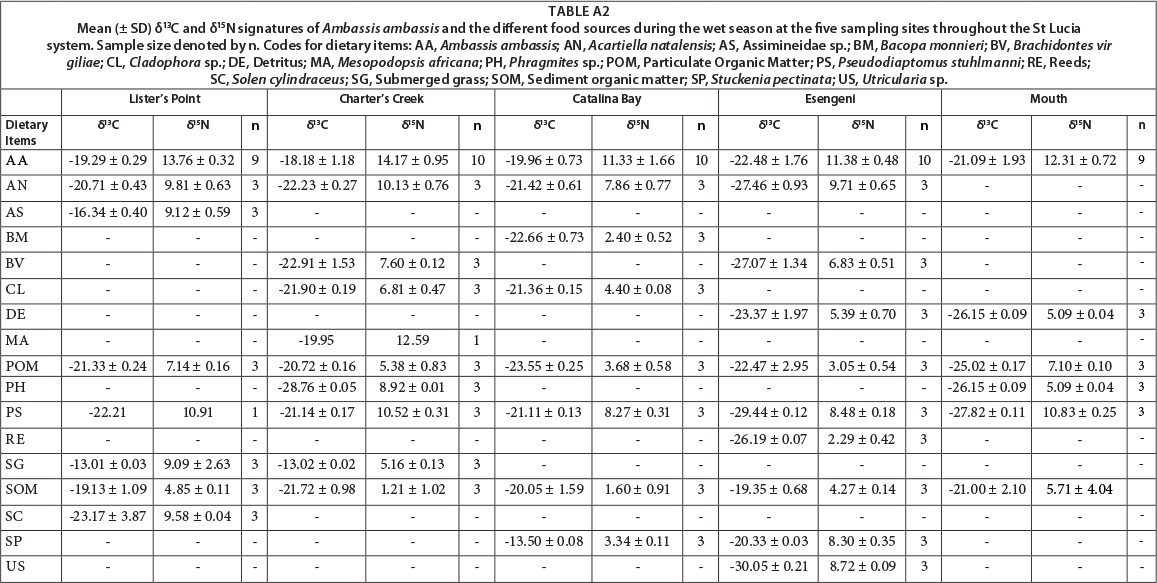
Dietary sources collected at Catalina Bay were significantly different in their δ15N (F = 36.91, p = 0.001) and δ13C (F = 15.46, p = 0.001) signatures. No significant difference between the wet and dry season was found for either S13C (F = 0.13, p = 0.72) or δ15N (F = 1.45, p = 0.24). The range of δ13C signatures was from -25.64% for Brachidontes virgiliae to -13.50% for Stuckenia pectinata. The δ15N signatures ranged from 1.60% for SOM to 10.02% for Pseudodiaptomus stuhlmanni (Appendix: Tables A1 and A2).
Esengeni
All dietary sources were significantly different in terms of both δ13C (F = 46.60, p = 0.001) and δ15N (F = 39.71, p = 0.001) signatures. There were, however, no significant differences in source δ13C (F = 0.42, p = 0.52) and δ15N (F = 0.58, p = 0.45) signatures between the wet and dry season at Esengeni. The δ15N signatures ranged from 2.29% for the reed Scirpus littoralis to 9.71% for the copepod Acartiella natalensis. The δ13C signatures ranged from -30.05% for the bladderwort Utricularia sp. to -19.18% for SOM (Appendix: Tables A1 and A2).
Mouth
At the mouth, dietary sources were significantly different in terms of the δ13C (F = 27.89, p = 0.001) and δ15N (F = 18.41, p = 0.001) signatures. Seasonally there was no difference in the δ15N (F = 1.12, p = 0.29) and δ13C (F = 0.69, p = 0.41) signatures of the dietary sources. The δ13C signatures ranged from -27.82% for Pseudodiaptomus stuhlmanni to -20.68% for SOM. The δ15N signatures ranged from 3.44% for SOM to 10.83%o for P. Stuhlmanni (Appendix: Tables A1 and A2).
Temporal and spatial variation in Ambassis ambassis signatures and trophic positioning
There was a significant spatial difference in the δ13C (F = 29.60, p = 0.001) and δ15N (F = 9.81, p = 0.001) signatures of A. ambassis. Seasonally, δ15N signatures were significantly different among the study sites (F = 42.25, p = 0.001) but δ13C signatures were statistically similar (F = 2.32, p = 0.13). The δ13C (F = 3.70, p = 0.001) and δ15N (F = 2.23, p = 0.01) signatures of A. ambassis were significantly different for different-sized individuals. Charter's Creek was the only site to yield a significant relationship between δ13C signatures and fish size (R2 = 0.31, p = 0.01), with all other sites yielding non-significant relationships (p > 0.05). Charter's Creek (R2 = 0.34, p = 0.01), Catalina Bay (R2 = 0.56, p = 0.001) and Esengeni (R2 = 0.20, p = 0.04) all yielded significant relationships between δ15N signatures and fish size, with Lister's Point and the mouth yielding non-significant results (p > 0.05).
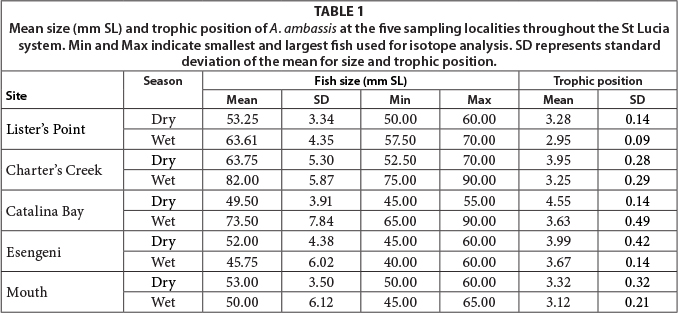
Trophic position was significantly different among the sampling sites (F = 19.79, p = 0.001) and between seasons (F = 24.63 p = 0.001). The highest trophic position (4.55) was recorded at Catalina Bay during the dry season, while the lowest (2.95) was recorded at Lister's Point (Table 1). Mean trophic level of A. ambassis during the dry season was consistently higher than that for the wet season at all sites.
A significant, albeit weak, relationship was identified between trophic position and fish size (R2 = 0.051, p = 0.026). A significant relationship was also found for trophic position and salinity (R2 = 0.15, p = 0.001), as well as trophic position and temperature (R2 = 0.087, p = 0.003). There was, however, no significant relationship between trophic position and turbidity or depth measured at the sampling sites (p > 0.05).
Dietary contribution: stable isotopes
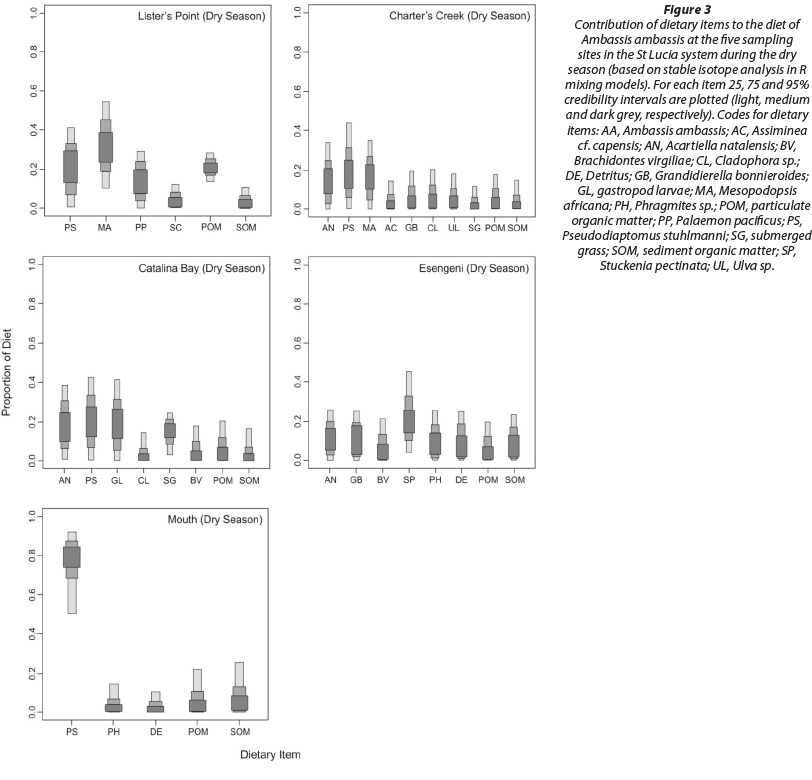
At Lister's Point during the dry season, Mesopodopsis africana was the dominant dietary item, contributing between 10 and 55% of the total diet. Pseudodiaptomus stuhlmanni was also of dietary importance, contributing up to 40%. Palaemon pacificus and particulate organic matter (POM) contributed up to 30% each of the diet, while submerged grass and sediment organic matter (SOM) contributed less than 10% (Fig. 3). During the wet season, P. stuhlmanni was the most important dietary constituent, contributing up to 60% of the total diet, while Acartiella natalensis contributed up to 40%. All other sources were of lesser importance, contributing less than 25% each (Fig. 4).
At Charter's Creek, zooplankton dominated the diet with P. stuhlmanni, M. africana and A. natalensis making up the top 3 dominant sources, respectively, during the dry season. All other sources were of lesser importance, contributing less than 20% to the total diet (Fig. 3). During the wet season, zoo-plankton was again dominant but this time M. africana was the main food source, contributing up to 70% of the total diet, while P. stuhlmanni and A. natalensis contributed up to 30 and 22%, respectively. Submerged grass was also found to play a role in the diet of these fish, contributing up to 25% of the total diet. All other sources were of minor importance, contributing less than 20% (Fig. 4).
Catalina Bay exhibited a very similar trend to Charter's Creek during the dry season, with zooplankton dominating the diet. Pseudodiaptomus stuhlmanni, A. natalensis and gastropod larvae were the top 3 dietary items, respectively. Again submerged grass was important to the diet, contributing up to 25% of the total. All other sources were less important, contributing less than 20% (Fig. 3). During the wet season, P. stuhlmanni was the most dominant item contributing up to 60% of the total diet, while Acartiella natalensis contributed up to 50%. All other sources were of lesser importance, contributing less than 30% (Fig. 4).
During the dry season, the aquatic plant Stuckenia pectinata, contributed up to 45% of the total diet of the fish collected at Esengeni. All other sources were of minor importance, contributing less than 25% (Fig. 3). During the wet season, S. pectinata was again the dominant food source, contributing up to 50%, while Acartiella natalensis contributed up to 40%. All other dietary sources were of minor importance to the diet of these fish, contributing less than 30% (Fig. 4).
At the mouth, P. stuhlmanni was the most dominant food item, contributing up to 90% of the total diet during the dry season and up to 70% during the wet season. POM and SOM were also of importance during both the dry and wet seasons, while detritus and Phragmites sp. contributed less than 20% in both seasons (Figs 3 and 4).
Dietary composition: gut contents
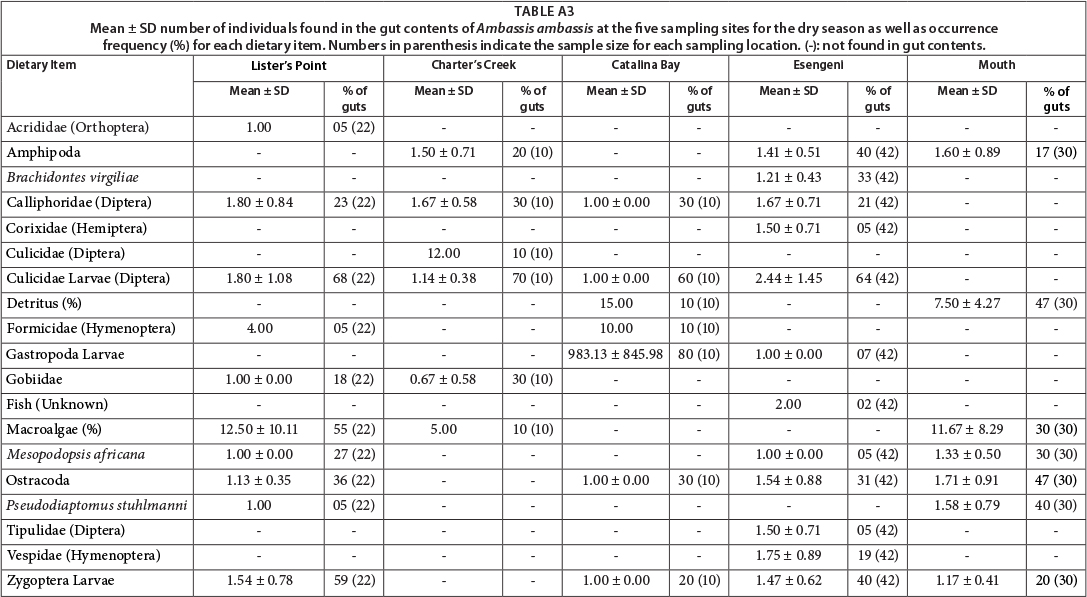
Gut content analysis was difficult for this species, as most guts were almost empty. Nevertheless, fish gut contents revealed that the short-term dietary composition of this species was generally similar at all sites, with some difference in the composition among sites (Appendix: Tables A3 and A4). Terrestrial and aquatic insects and insect larvae were present in the gut contents at all sites and in both seasons. Diptera was the dominant order recorded, with 3 families represented. Mosquito larvae were found in the gut contents from all sites, except the mouth, and were found in up to 70% of the fish collected at Charter's Creek during the dry season. During the wet season, these larvae were only identified in the gut contents from fish collected at Lister's Point. Pseudodiaptomus stuhlmanni was present in the gut contents from all sites during the wet season, but only from the gut contents of the fish at the mouth and Lister's Point during the dry season. Gastropod larvae were identified from Catalina Bay and Esengeni and occurred in gut contents of 80 and 20% of the fish collected during the dry season at these sites, respectively. The benthic gastropod, Assiminea cf. capensis, contributed to the diet of 50% of the fish collected at Charter's Creek during the wet season. Mesopodopsis africana were identified in the gut contents of fish at all sites but there was seasonal variation in their occurrence in gut contents. Macroalgae were identified in the gut contents of fish at all sites except Esengeni, contributing to the diet of 55% of the fish collected at Lister's Point during the dry season. The greatest variety in gut contents was found at Esengeni during the dry season, with a total of 12 distinct dietary items identified. The lowest diversity in gut contents was obtained from the mouth during the wet season, where only 6 distinct items were identified (Appendix: Tables A3 and A4).
The result of the ANOSIM reveals a high degree of similarity between the gut contents from the fish collected at the five sampling sites, with a large amount of overlap of the different clusters (Fig. 5) (R = 0.379, p = 0.001). The fish collected at Charter's Creek, Catalina Bay and Esengeni separated out on a seasonal level, with the respective seasons grouping together to form distinct clusters. At Lister's Point and the mouth there was, however, no indication of seasonal differences in the diet.
DISCUSSION
From the physico-chemical data presented, it is clear that the reverse salinity gradient that has persisted in the St Lucia system since 2002 (Perissinotto et al., 2013a) was still largely in effect during this study; the only difference is that salinities throughout the system have now decreased, indicative of the shift from a dry to a wet phase (Perissinotto et al., 2013a).
As a result of the drop in salinity throughout the system, A. ambassis has extended its distribution range from that which has been historically documented for this species in St Lucia. While it was previously limited to The Narrows, Charter's Creek and Fani's Island (Vivier et al., 2010a), the present study shows that it has expanded its distribution northward and southward, with fish also occupying habitats around Lister's Point and the mouth respectively. Thus it is now effectively distributed throughout the system. This shift in distribution is most likely related to the decrease in salinity, since this species has a narrow salinity tolerance (2 to 35), preferring areas with a salinity < 15 (Martin, 1988; Whitfield, 1998). Blaber and Cyrus (1981) reported that the species also survived extended periods at salinities < 1 in Lake Nhlange of the Kosi system, therefore indicating its potential to survive in freshwater habitats as well (Skelton, 1993).
From a stable isotopes perspective, the diet of A. ambassis was dominated by zooplankton at all sites, with the exception of Esengeni where the aquatic plant Stuckenia pectinata was also of importance. The presence of this aquatic plant and others in the models may however be a result of this source being transported through the food web, possibly via detrital pathways, rather than being directly consumed by A. ambassis. Our findings are congruent with the historical studies of the diet of this fish, which have shown that zooplankton, particularly fish larvae and crustaceans, are of vital importance to its diet (Martin, 1983; Martin and Blaber, 1983; Martin, 1989; Skelton, 1993; Whitfield, 1998). Past studies were, however, based on gut content analyses alone. The present study is the first to complement GCA with stable isotope analysis for a species of this family in southern Africa. The results from the gut content analyses revealed a similar trend to that observed for the isotope mixing models. However, terrestrial and aquatic insects, as well as benthic invertebrates such as amphipods and bivalves, are also included in the dietary composition, which is congruent with the findings of Martin (1989), confirming that this species can supplement its diet with insects of terrestrial and aquatic origin. As it is difficult to predict which insects will be preyed upon by these fish, insects were not included in the isotope sampling protocol for this study. Ambassis ambassis preferentially feeds near the water surface and it is thought that fish opportunistically feed on insects that fall into the water (Martin 1989). This highlights one of the benefits of employing both techniques to infer diet, as GCA can determine the contribution of items that are opportunistically preyed upon which may otherwise be impossible to identify using stable isotopes.
In this study, insects were found in the gut contents of A. ambassis at all sites, but were particularly prevalent at Esengeni. The δ13C signatures of the fish collected at Esengeni were the most depleted of the five sampling sites, indicating the importance of terrestrial input to the diet at this site. Juvenile fish belonging to the Gobiidae family were also identified in the gut contents. These fish are small enough for A. ambassis to ingest whole and have previously been recorded in the gut contents of this species (Nhleko, 2011). It is now evident that this species feeds at the surface (insects), in the water column (zooplankton) and along the substrate (Gobiidae).
When it comes to the selection of prey items, Martin (1989) suggested that the species composition of ingested organisms for these fish is not as important as the size and availability of the dietary items. This is indicative of an opportunistic foraging species, which is not exclusively targeting select organisms but merely supplementing its diet with the most energetically rich item it comes into contact with. Similarly, under flood conditions in Australian estuaries, Balcombe et al. (2005) showed that Ambassis sp. increases its dietary breadth and supplements its zooplanktivorous diet with insects and fish.
Nitrogen signatures of A. ambassis showed significant seasonal differences. Olin et al. (2013) also suggested strong seasonal variation in isotope signatures, with a marked increase in nitrogen values in the summer (wet) period. Nitrogen signatures were also shown to be higher in winter (dry) periods for A. jacksoniensis in mangrove environments of southern Australia (Mazumder et al., 2008). Carbon and nitrogen isotope signatures were significantly different for different-sized individuals. It has been shown that there is a dietary shift in this species between juveniles and adults, with adults targeting food items in suspension (Martin, 1989). Carbon isotope signatures were positively related to the size of the fish collected only at Charter's Creek, which implies that different-sized fish are feeding in different areas at this site. Following the freshwater influx into the system, large areas of vegetation have been inundated at this site resulting in the creation of new 'protected' habitats, particularly for juveniles. Paxton et al. (1989) reported that A. argrammus form shoals which congregate amongst submerged vegetation. It is therefore likely that A. ambassis will behave in a similar manner, with juveniles and potentially adults utilising these habitats. Smaller fish using these areas would therefore be exposed to different dietary items, when compared to larger fish utilising deeper water.
Nitrogen signatures were positively related to fish size at Esengeni, but negatively at Charter's Creek and Catalina Bay. Therefore, it is likely that the larger fish at Esengeni are feeding at a higher trophic level compared to the smaller fish. Vinagre et al. (2012) suggest that as fish increase in size, their ability to eat larger and higher trophic level prey increases, due to the increase in mouth gape. At Catalina Bay and Charter's Creek, this trend is reversed, with smaller fish feeding at a higher trophic level. This can also be associated with the inundated vegetation at these two sites. Smaller individuals may use the flooded vegetation as shelter and may thus come into contact with terrestrial insects, which fall into the water and are preyed upon by the smaller fish.
The seasonal variability in trophic positioning indicates that the dietary composition at the different sampling sites may differ, with fish targeting prey at a higher trophic position during the dry season. This follows the trends observed by Vinagre et al. (2012), who reported generally lower trophic levels for numerous estuarine organisms during the summer (wet) season. This was attributed to the higher abundances of micro- and macroalgae, which were consumed more extensively by lower trophic level organisms, thus resulting in a cascade up the food chain (Vinagre et al., 2012). In the St Lucia system, pelagic primary productivity is generally higher during the wet season, when higher nutrient levels are recorded in the lakes as a result of increased freshwater inflow (Perissinotto et al., 2013a; Perissinotto et al., 2013b). When linked to physico-chemical parameters, trophic position showed a significant, albeit weak, relationship with temperature and salinity. This could explain the differences in trophic position between the different sampling sites, as salinity is a primary determinant for explaining the differences between sites. However, trophic positioning is highly dependent on prey availability and this can be influenced by a number of factors other than physico-chemical parameters, such as nutrient input and productivity (Vinagre et al., 2012).
From the results of the NMDS analysis, it is evident that there is clear overlap between the different sampling sites from a dietary composition perspective, indicating that there were no significant spatial differences in diet. Seasonally, there was a difference in dietary composition at 3 of the 5 sampling sites, Charter's Creek, Catalina Bay and Esengeni, indicating a change in diet between seasons. There was, however, a large degree of dietary overlap at the mouth and Lister's Point indicating that these fish do not change their diet at a seasonal scale.
The results of the present study indicate that this species has a similar diet across its distribution within the St Lucia system. This can be interpreted as a high degree of prey selectivity, as differences in food availability at the sampling localities are not expressed in the dietary composition. To accurately determine this, however, abundance data for all prey items are required for the periods when samples were collected.
In conclusion, A. ambassis is largely planktivorous, feeding predominantly on zooplankton throughout the St Lucia system. In addition, it opportunistically supplements its diet with terrestrial and aquatic insects, as well as juvenile fish when available.
Ambassis ambassis therefore plays a vital role in the St Lucia estuarine food web, providing a pivotal link in the pathway of energy between trophic levels. The success of A. ambassis within St Lucia is however governed by its tolerance to salinity, rather than its dietary preferences. The expansion of its geographical distribution in the system will only see this species become more common during the wet phase and therefore more influential in the food webs of the system at this time.
ACKNOWLEDGEMENTS
Thanks to the iSimangaliso Wetland Park Authority and Ezemvelo KwaZulu-Natal Wildlife for providing invaluable support during the sampling process. We thank R Jackson, R Taylor, M Dyer and A Connell for their assistance with sampling procedures. I Germishuizen is acknowledged for constructing the map of St Lucia. Funding for this project was provided by the National Research Foundation (NRF), the Deutscher Akademischer Austausch Dienst (DAAD) and the University of KwaZulu-Natal (UKZN).
REFERENCES
BALCOMBE SR, BUNN SE, McKENZIE-SMITH FJ and DAVIES PM (2005) Variability of fish diets between dry and flood periods in an arid zone floodplain river. J. Fish Biol. 67 1552-1567. [ Links ]
BEGG G (1978) The estuaries of Natal. Natal Town and Regional Planning Report 41. 1-657. [ Links ]
BLABER SJM and CYRUS DP (1981) A revised checklist and further notes on the fishes of the Kosi system. Lammergeyer 31 173-188. [ Links ]
BLIGH EG and DYER RM (1959) A rapid method of total lipid extraction and purification. Can. J. Biochem. Physiol. 37 911-917. [ Links ]
BOUILLION S, CONNOLLY RM and GILLIKIN DP (2011) Use of stable isotopes to understand food webs and ecosystem functioning in estuaries. In: Wolanski E and McLusky DS (eds.) Treatise on Estuarine and Coastal Science 7 143-173. [ Links ]
CARRASCO NK, PERISSINOTTO R and NEL HA (2012) Diet of selected fish species in the freshwater-deprived St Lucia Estuary, South Africa, assessed using stable isotope analysis. Mar. Biol. Res. 8 (8) 701-714. [ Links ]
CARABEL S, GODINEZ-DOMINDUEZ E, VERISIMO P, FERNANDEZ L and FREIRE J (2006) An assessment of sample processing methods for stable isotope analysis of marine food webs. J. Exp. Biol. Ecol. 336 254-261. [ Links ]
CAUT S, ANGULO E and COURCHAMP F (2009) Variation in discrimination factors (A15N and A13C): the effect of diet isotopic values and applications for diet reconstruction. J. Appl. Ecol. 46 443-453. [ Links ]
CLARKE KR and GORLEY RN (2006) PRIMER v6 User Manual/ Tutorial. PRIMER-E, Plymouth. [ Links ]
CYRUS D, JERLING H, MacKAY F and VIVIER L (2011) Lake St Lucia, Africa's largest estuarine lake in crisis: Combined effects of mouth closure, low levels and hypersalinity. S. Afr. J. Sci. 107 (3/4) 1-13. [ Links ]
CYRUS DP and VIVIER L (2006) Status of estuarine fish fauna in the St Lucia Estuarine System, South Africa, after 30 months of mouth closure. Afr. J. Aquat. Sci. 31 (1) 71-81. [ Links ]
CYRUS DP (2013) Fish and fisheries. In: Perissinotto R, Stretch DD and Taylor RH (eds.) Ecology and Conservation of Estuarine Ecosystems: Lake St Lucia as a Global Model. Cambridge University Press, New York. 290-315. [ Links ]
DeNIRO MJ and EPSTEIN S (1978) Influence of diet on the distribution of carbon isotopes in animals. Geochim. Cosmochim. Acta 42 49-506. [ Links ]
DYER DC, PERISSINOTTO R and CARRASCO NK (2013) Post-flood dietary variation in the Mozambique Tilapia (Oreochromis mos-sambicus) in the St Lucia Estuary, South Africa. Mar. Ecol. Prog. Ser. 476 199-214. [ Links ]
GEARING JN (1991) The study of diet and trophic relationships through natural abundance 13C. In: Coleman DC and Fry B (eds.) Carbon Isotope Techniques. Academic Press, London. 201-218. [ Links ]
HESSLEIN RH, HALLARD KA and RAMLAL P (1993) Replacement of sulphur, carbon, and nitrogen in tissue of growing broad white-fish (Coregonus nasus) in response to a change in diet traced by δ34S, δ13C and δ15N. Can. J. Fish. Aquat. Sci. 50 2071-2076. [ Links ]
HYSLOP EJ (1980) Stomach content analysis - a review of methods and their application. J. Fish Biol. 17 411-429. [ Links ]
INGER R, McDONALD RA, ROGOWSKI D, JACKSON AL, PAR-NELLA, PRESTON SJ, HARROD C, GOODWIN C, GRIFFITHS D, DICK JTA and co-authors (2010) Do non-native invasive fish support elevated lamprey populations? J. Appl. Ecol. 47 121-129. [ Links ]
MARTIN TJ (1983) The biology of Ambassidae (Cuvier) in Natal estuaries. PhD thesis, University of Natal, Pietermaritzburg, unpublished. [ Links ]
MARTIN TJ (1988) Interaction of salinity and temperature as a mechanism for spatial separation of three co-existing species of Ambassidae (Cuvier) (Teleostei) in estuaries on the south-east coast of Africa. J. Fish Biol. 33 (A) 9-15. [ Links ]
MARTIN TJ (1989) Niche separation in Ambassis (Pisces: Perciformes) species co-existing in estuaries of south-east Africa. J. Fish Biol. 35 (A) 321-328. [ Links ]
MARTIN TJ and BLABER SJM (1983) The feeding ecology of Ambassidae (Osteichthyes: Perciformes) in Natal estuaries. S. Afr. J. Zool. 18 (4) 353-362. [ Links ]
MAZUMDER D, WILLIAMS RJ, REID D, SAINTILAN N and SZYM-CZAK R (2008) Variability of stable isotope ratios of glassfish (Ambassis jacksoniensis) from mangrove/salt-marsh environments in southeast Australia and implications for choosing sample size. Environ. Bioindic. 3 114 -123. [ Links ]
NHLEKO JBB (2011) The diet of selected benthic feeding fish in the Mfolozi-Msunduzi system. MSc thesis, University of Zululand, South Africa, unpublished. [ Links ]
OLIN JA, HUSSEY NE, RUSH SA, POULAKIS GR, SIMPFEN-DORFER CA, HEUPEL MR and FISK AT (2013) Seasonal variability in stable isotopes of estuarine consumers under different freshwater flow regimes. Mar. Ecol. Prog. Ser. 487 55-69. [ Links ]
PARNELL AC, INGER R, BEARHOP S and JACKSON AL (2010) Source partitioning using stable isotopes: coping with too much variation. PLoS ONE 5 (3) e9672. [ Links ]
PAXTON JR, HOESE DF, ALLEN GR and HANLEY JE (1989) Pisces. Pteromyzontidae to Carningidae. Zoological Catalogue of Australia, Vol. 7. Australian Government Publishing Service, Canberra. 665 pp. [ Links ]
PINNEGAR JK and POLUNIN NVC (1999) Differential fractionation of d13C and d15N among fish tissues: implications for the study of trophic interactions. Funct. Ecol. 13 225-231. [ Links ]
PERISSINOTTO R, CARRASCO NK and TAYLOR RH (2013a) Physico-chemical environment. In: Perissinotto R, Stretch DD, Taylor RH (eds) Ecology and Conservation of Estuarine Ecosystems: Lake St Lucia as a Global Model. Cambridge University Press, New York. 168-185. [ Links ]
PERISSINOTTO R, BATE GC and MUIR DG (2013b) Microalgae. In: Perissinotto R, Stretch DD and Taylor RH (eds) Ecology and Conservation of Estuarine Ecosystems: Lake St Lucia as a Global Model. Cambridge University Press, New York. 186-207. [ Links ]
PETERSON B and FRY B (1987) Stable isotopes in ecosystem studies. Ann. Rev. Ecol. Syst. 18 293-320. [ Links ]
POST DM (2002) Using stable isotopes to estimate trophic position: models, methods, and assumptions. Ecology 83 (3) 703-718. [ Links ]
SKELTON P (1993) A Complete Guide to the Freshwater Fishes of Southern Africa. Southern Book Publishers, Harare. 388 pp. [ Links ]
SMIT AJ (2001) Source identification in marine ecosystems: food web studies using d13C and d15N. In: Unkovich MJ, Pate JS, McNeil AM and Gibbs J (eds) Stable Isotope Techniques in the Study of Biological Processes and Functioning of Ecosystems. Kluwer Academic Publishers, Dordrecht. [ Links ]
SOREIDE JE, TAMELANDER T, HOP H, HOBSON KA and JOHAN-SEN I (2006) Sample preparation effects on stable C and N isotope values: a comparison of methods in Arctic marine food web studies. Mar. Ecol. Prog. Ser. 328 17-28. [ Links ]
TAYLOR RH (2006) Ecological responses to changes in the physical environment of the St Lucia Estuary. PhD thesis, Norwegian University of Life Sciences, Aas, Norway, unpublished. [ Links ]
TAYLOR R, FOX C and MFEKA S (2013) Monitoring the St Lucia Estuarine System: A synthesis and interpretation of the monitoring data for January-February 2013. Unpublished Ezemvelo KZN Wildlife report. 12 pp. [ Links ]
VAN DER ZANDEN MJ, CABANA G and RASMUSSEN JB (1997) Comparing trophic position of freshwater fish calculated using stable nitrogen isotope ratios (δ15N) and literature dietary data. Can. J. Fish Aquat. Sci. 54 1142-1158. [ Links ]
VAN DER ZANDEN MJ and RASMUSSEN JB (2001) Variation in δ15N and δ13C trophic fractionation: Implications for aquatic food web studies. Limnol. Oceanogr. 46 (8) 2061-2066. [ Links ]
VINAGRE C, SALGADO JP, MENDONCA V, CARABEL H and COSTA MJ (2012) Isotopes reveal fluctuation in trophic levels of estuarine organisms, in space and time. J. Sea Res. 72 49-54. [ Links ]
VIVIER L, CYRUS DP and JERLING HL (2010a) Fish community structure of the St Lucia Estuarine System under prolonged drought conditions and its potential for recovery after mouth breaching. Estuar. Coast. Shelf Sci. 86 568-579. [ Links ]
VIVIER L, CYRUS DP, OWEN RK and JERLING HL (2010b) Fish assemblages in the Mfolozi-Msunduzi estuarine system, KwaZulu-Natal, South Africa, when not linked to the St Lucia mouth. Afr. J. Aquat. Sci. 35 (2) 141-154. [ Links ]
WADA E, ISHII R, AITA MN, OGAWA NO, KOHZU A, HYODO F and YAMADA Y (2013) Possible ideas on carbon and nitrogen trophic fractionation of food chains: a new aspect of food-chain stable isotope analysis in Lake Biwa, Lake Baikal, and the Mongolian grasslands. Ecol.Res. 28 (2) 173-181. [ Links ]
WHITFIELD AK (1980) A checklist of fish species recorded from Maputaland estuarine systems. In: BRUTON MN and COOPER KH (eds.) Studies on the Ecology of Maputaland. Rhodes University, Grahamstown, and the Wildlife Society, Durban. 560 pp. [ Links ]
WHITFIELD AK (1998) Biology and Ecology of Fishes in Southern African Estuaries. Ichthyological Monographs of the JLB Smith Institute of Ichthyology 2. 223 pp. [ Links ]
ZAR JH (1996) Biostatistical Analysis (4th edn). Prentice Hall, New Jersey. 662 pp. [ Links ]
Received 15 April 2014
Accepted in revised form 17 December 2014
* To whom all correspondence should be addressed. +27 72 621 6406; e-mail: dcdyer007@gmail.com


