


Serviços Personalizados
Artigo
 Inglês (pdf)
 Artigo em XML
 Referências do artigo
Indicadores

Links relacionados
-
 Citado por Google
 -
 Similares em Google
Compartilhar

 Permalink
Water SA
versão On-line ISSN 1816-7950
versão impressa ISSN 0378-4738
Water SA vol.41 no.1 Pretoria Jan. 2015
http://dx.doi.org/10.4314/wsa.v41i1.11
Dynamics of MODIS evapotranspiration in South Africa
Nebo JovanovicI, *; Qiaozhen MuII; Richard DH BuganI; Maosheng ZhaoIII
ICSIR, Natural Resources and Environment, PO Box 320,7599 Stellenbosch, South Africa
IINumerical Terradynamic Simulation Group, College of Forestry and Conservation, University of Montana, 32 Campus Drive, Missoula, MT59812, USA
IIIDepartment of Geographical Sciences, University of Maryland, 2181 Samuel J. LeFrak Hall, College Park, MD 20742, USA
ABSTRACT
This paper describes the dynamics of evapotranspiration (ET) in South Africa using MOD16 ET satellite-derived data, and analyses the inter-dependency of variables used in the ET algorithm of Mu et al. (2011). Annual evapotranspiration is strongly dependent on rainfall and potential evapotranspiration (PET) in 4 climatically different regions of South Africa. Average ET in South Africa (2000-2012) was estimated to be 303 mm-a-1 or 481.4 x 10⁹ m3-a1 (14% of PET and 67% of rainfall), mainly in the form of plant transpiration (T, 53%) and soil evaporation (Soil E, 39%). Evapotranspiration (ET) showed a slight tendency to decrease over the period 2000-2012 in all climatic regions, except in the south of the country (winter rainfall areas), although annual variations in ET resulted in the 13-year trends not being statistically significant. Evapotranspiration (ET) was spatially dependent on PET, T and vapour pressure deficit (VPD), in particular in winter rainfall and arid to semi-arid climatic regions. Assuming an average rainfall of 450 mm-a-1, and considering current best estimates of runoff (9% of rainfall), groundwater recharge (5%) and water withdrawal (2%), MOD16 ET estimates were about 15% short of the water balance closure in South Africa. The ET algorithm can be refined and tested for applications in restricted areas that are spatially heterogeneous and by accounting for soil water supply limiting conditions.
Keywords: MOD16, potential evapotranspiration, soil evaporation, transpiration, water balance
INTRODUCTION
Sustainable management of water resources requires careful planning, monitoring and management, as water is a finite resource in quality and quantity. Environmental change driven by anthropogenic global warming imposes additional constraints, for example, increase in extreme weather occurrences (droughts and floods), increase in temperature and potential evaporation, changes in rainfall amounts and distribution, etc. The quantification of the water cycle components is a fundamental requirement in the assessment and management of water resources, in particular, under the impacts of human-induced land-use and climate change.
Evapotranspiration (ET) is a key process within the hydrological cycle and arguably the most difficult component to determine, especially in arid and semi-arid areas where a large proportion of low and sporadic precipitation is returned to the atmosphere via ET. In these areas, vegetation is often subject to water stress and plant species adapt in different ways to prolonged drought conditions (Jovanovic and Israel, 2012). Evapotranspiration (ET) is estimated to be >60% of rainfall on a global scale (Korzoun et al., 1978; L'vovich and White, 1990) and can reach nearly 100% of rainfall in arid regions (Bugan et al., 2012). In addition, ET varies depending on the heterogeneity of the landscape and topography, climate, type of vegetation and soil properties (Mu et al., 2007a). This makes the process of ET very dynamic over time and variable in space. By understanding how this parameter varies in space and time, we will improve our understanding of a critical component of the water cycle.
Besides the FLUXNET network (Baldocchi et al., 2001), measurements of ET are scarce and localised. However, our ability to use information from satellite sensors to estimate ET is developing rapidly and offers the opportunity to understand how ET varies across space and time, reduce uncertainty levels, increase spatial details and scale-up to large areas. The accuracy and uncertainty of satellite-based estimates of ET were evaluated in specific studies for different algorithms and products, e.g., SEBAL (Bastiaanssen et al., 1998a and b), METRIC (Allen et al., 2007a and b), SEBS (Su, 2002), and MODIS ET (Mu et al., 2007a), as well as for components of ET calculation such as MODIS fraction of absorbed photosynthetically active radiation (FPAR) and leaf area index (LAI) (Myneni et al., 2002). This was generally done by comparison between remote sensing-based estimates of ET and ground-based measurements of ET or other variables. Mueller et al. (2011) and Jimenez et al. (2011) also compared global ET datasets and surface fluxes obtained with satellite-based products and land surface models for large river basins of the world.
The Council for Scientific and Industrial Research (CSIR) has recently initiated research aimed at evaluating, validating and improving the MOD16 ET product, one of the free satellite-based ET products with readily available ET data for the past 13 years. These time series were seldom applied to estimate ET in Africa, especially in arid and semi-arid regions. The MOD16 ET product estimates global ET from ground-based meteorological observations and remote-sensing data from the Moderate Resolution Imaging Spectroradiometer (MODIS) located on NASA's Terra and Aqua satellites (Justice et al., 2002). The MODIS sensor works on a spatial resolution of approximately 1 km, making it potentially suitable for applications in water resource management. The images contain 36 spectral bands in the wavelength range of 0.4 to 14.4 µm. The MOD16 ET algorithm was developed by Mu et al. (2007a) from the original model of Cleugh et al. (2007), and later improved by Mu et al. (2011).
This paper presents the first evaluation of the MOD16 ET done in South Africa at countrywide scale. The aims were: (i) to describe the annual and spatial trends of ET and its components estimated with the modified ET algorithm of Mu et al. (2011) for South Africa, and (ii) to assess the limiting ranges of algorithm key variables in relation to ET and its components.
MATERIAL AND METHODS
MOD16 ET algorithm
Brief description of the MOD16 ET algorithm
The detailed algorithm description can be found in Mu et al. (2007a) and Mu et al. (2011). In this study, only the variables used in the analysis are described. The MOD16 ET algorithm is based on the physically sound theory of the Penman-Monteith energy balance (Monteith, 1965; Allen et al., 1998):

where:
ET is in mm
is the latent heat of vaporisation of water (J-kg-1)
is the gradient of the saturation vapour pressure-temperature function (Pa-°C-1)
Rn is the net radiation (J-m-2-s-4)
G is the soil heat flux (J-m-2-s-1)
ρa is the air density (kg-m3)
Cp is the specific heat of the air (J-kg-1-K1)
es is the saturated vapour pressure of the air
(Pa), a function of air temperature measured at height z
ea is the mean actual vapour pressure of the air measured at height z (Pa)
(es-ea) is vapour pressure deficit (VPD; Pa)
ra is the aerodynamic resistance to water vapour diffusion into the atmospheric boundary layer (s-m-1)
γ is the psychrometric constant (0.066 kPa-K-1)
rs is the surface resistance to water vapour transfer (s-m-1)
The MOD16 ET algorithm (Mu et al., 2011) calculates ET using global daily temperature, actual vapour pressure and incoming solar radiation, and remotely-sensed LAI, FPAR, albedo, and land cover type. The available energy at the land surface (Rn) is partitioned into vegetation surface and soil surface using FPAR (MODIS 15A product, assumed to be equal to canopy cover FC). The term rsfrom Eq. (1) is defined as an effective surface resistance to evaporation from the soil surface and transpiration from the plant canopy. Canopy rsdecreases as VPD decreases, and it is also limited by low temperature (Mu et al., 2007a; Mu et al., 2011).
Evaporation from the wet canopy occurs after certain conditions (e.g. after rainfall, when air relative humidity >70%) and can be a substantial component when leaf area is large. In order to calculate daytime and night-time ET, daily average air temperature (Tavg) is assumed to be the average of daytime air temperature (Tday) and nighttime temperature (Mu et al., 2011). Day-time and night-time ET are then added up to get daily ET values.
A soil evaporation (Soil E) component is also calculated in the MOD16 ET algorithm (Mu et al., 2011), which may be important in areas with a sparse canopy. The potential evaporation from the soil is first calculated with an equation that fully resembles the Penman-Monteith energy balance equation (Eq. (1)). Actual Soil E is then calculated as a function of air relative humidity (RH). The algorithm also considers the wet surface fraction (F wet) calculated as a function of RH. The wet surface fraction (F wet) represents the fraction of canopy or soil covered by water. In the case of the canopy, Fwet is used to separate evaporation of water intercepted by the canopy and transpiration (T). In the case of the soil, Fwetis used to separate evaporation from saturated and moist soil surface. The latent heat fluxes from vegetation canopy and soil (partitioned through FCand Fwet) are finally summed up to calculate ET for the particular vegetation. MOD16 ET is the sum of 3 components:

where:
Tc, Es, and Ei are canopy transpiration (T), soil evaporation (Soil E), and interception evaporation (Canopy E), respectively.

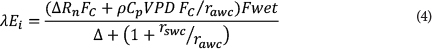
The term Esconsists of Soil E from dry soil surface and wet soil surface:


where:
FC is the fractional vegetation cover
Fwet is relative surface wetness (RH4)
rac, rsc are the aerodynamic and canopy resistances of the dry canopy
fsm is modified RHVPD to the one in Fisher et al. (2008)
rawc and rswc are the aerodynamic and wet canopy resistances of the wet canopy
ETwet_soil and ETSOILpot, are the wet and potential Soil E
ras and rss are the soil aerodynamic conductance and soil total resistances
The potential plant transpiration (Tpot) is calculated following the Priestley-Taylor (Priestley and Taylor, 1972) equation:

The total daily potential ET (PET) is calculated with Eq. (9):

GMAO MERRA meteorological input data
NASA/GMAO Modern Era Retrospective Analysis (MERRA) at spatial resolution of 0.5°x 0.66° provided every hour was used as meteorological input to the MOD16 ET algorithm. Mu et al. (2011) processed the hourly data to daily level. The technique proposed by Zhao et al. (2005) was used to interpolate data from coarse spatial resolution to 1 km, to fit MODIS pixels, to remove abrupt changes from one side of a GMAO pixel to another, and to improve the accuracy of these pixels.
Methodology and study area
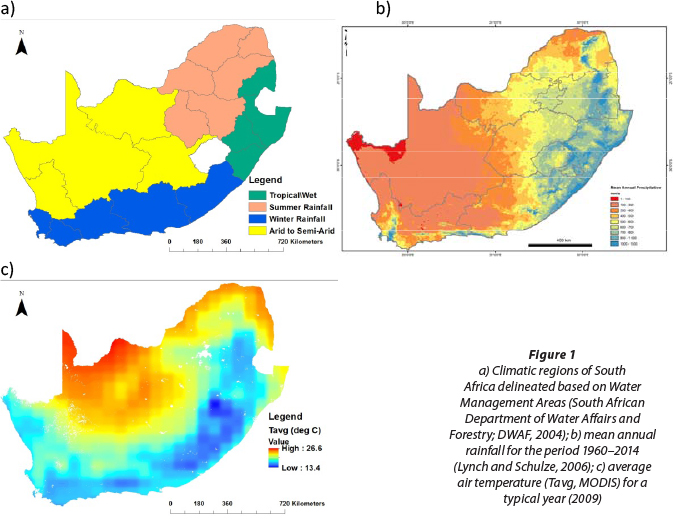
South Africa covers a wide range of climatic and hydrological conditions. The South African Department of Water Affairs classified the country's water resources into 19 water management areas (WMAs) in 2004 (DWAF, 2004, since regrouped into 9 WMAs). The WMA borders were used to delineate 4 climatic regions (Fig. 1a). The western and central WMAs fall in arid and semi-arid regions. The southern WMAs are in an area with a Mediterranean (winter rainfall) climate. The eastern coastal area has a tropical wet climate, whilst the northern regions are in the sub-tropical (summer rainfall) belt. Such climatic diversity is ideal for the analysis of a wide range of ET values. The division into 4 climatic regions is corroborated by the characteristic gradient in annual rainfall from west (arid and semi-arid climate) to east (tropical wet climate) (Fig. 1b; Lynch and Schulze, 2006). It is evident that average air temperatures are typically moderate in the south and east of the country, and high in the north-west (Fig. 1c).
Thirteen years (2000-2012) of annual MOD16 ET and GMAO MERRA meteorological data were collected and processed for the whole country, as well as for individual climatic regions as classified in Fig. 1a, on a 0.912 km x 0.912 km pixel basis. For each yearly data set, the following variables were extracted:
- Evapotranspiration (ET)
- Potential evapotranspiration (PET)
- Evaporation from wet canopy surface (Canopy E)
- Soil evaporation (Soil E)
- Dry soil evaporation (Dry soil E)
- Wet soil evaporation (Wet soil E)
- Transpiration (T)
- Average air temperature (Tavg)
- Daytime average air temperature (Tday)
- Daytime average vapour pressure deficit (VPD)
The variables were selected based on the improvements introduced by Mu et al. (2011) to the original algorithm. Yearly and spatial changes in ET were analysed and correlated to the yearly values for each variable in order to assess the sensitivity and dependence of ET to the selected variables. The data were analysed for the whole country as well as per climatic region.
Statistical analysis
The temporal (annual) changes in ET and associated variables were assessed using linear regression functions and tested for statistical significance. For the assessment of dependence between ET and associated variables over time, the Spearman rank correlation coefficient (rS) was used because it is suitable for small data series that may not necessarily have a normal distribution. The InfoStat software (Di Rienzo et al., 2012) was used for the calculation of rSand statistical significance.
For the spatial analysis it was not possible to generate a dataset by averaging the annual data for 13 years because the number of missing data (out of range) varied between years, and this may have introduced inconsistencies and bias. The spatial analysis was then performed for a year when annual ET and associated components exhibited the least deviation from the 13-year average. This typical year was 2009 and it was assumed that it would give a realistic and representative description of spatial differences. Average, median, standard deviation, coefficient of variation, skewness and kurtosis of all relevant variables were determined using all data pixels. The spatial dependence between variables was assessed for all years using the coefficient of determination (R2) of regression functions and Pearson correlation coefficient (r). In this instance, r was used instead of rS to reduce computation time because of the very large dataset (n>100 000) and to better account for outliers (the effects of outliers may be masked by the ranking in rS). Both the coefficient of determination (R2) and the correlation coefficients were reported to be suitable to indicate whether two datasets have similar temporal or spatial patterns (Ji and Gallo, 2006).
RESULTS AND DISCUSSION
Temporal changes of MOD16 ET and ET components
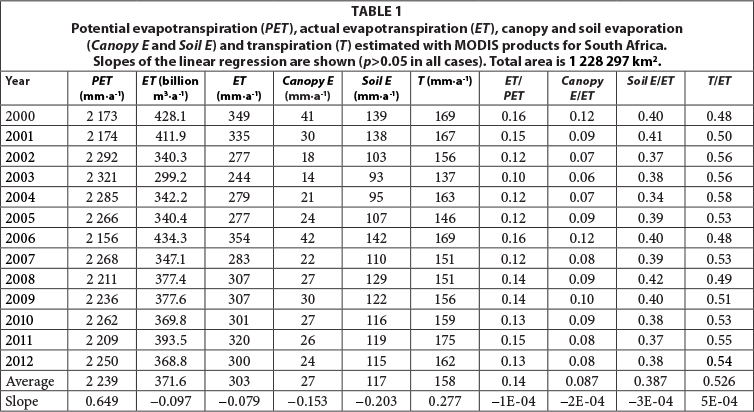
Thirteen years of annual PET, ET and its components were estimated with MODIS products and are shown in Table 1. It was estimated that the average ET in South Africa is 303 mm-a-1, ranging from 244 mm-a-1 in 2003 to 354 mm-a-1 in 2006. Only 14% of the potential atmospheric demand for water evaporates (ET/PET). The largest component of ET was transpiration of plants (53% on average), followed by Soil E (39% on average). Direct evaporation from the vegetation canopy was a minor component of ET (9% on average).
Annual values indicated that ET was rather stable in the period 2000-2012 (Fig. 2), depending on rainfall amounts and distribution. Evapotranspiration (ET), Canopy E and Soil E showed a slight tendency to decrease based on the negative slope of the linear regression (Table 1), whilst PET and T were slightly increasing (positive slope in Table 1). However, annual variability was much larger than the observed changes and these trends were not statistically significant (p>0.05). Tables 2 to 5 show 13 years of annual PET, ET and its components for each climatic region. Evapotranspiration (ET) displayed a slight tendency to decrease in all climatic regions, except in winter rainfall areas where the Canopy E and Soil E were increasing. However, none of the trends was statistically significant (p>0.05). Nation-wide average values (Table 1) are biased towards the values estimated in the arid and semi-arid climate, which represents the largest climatic region in extent (Fig. 1a).

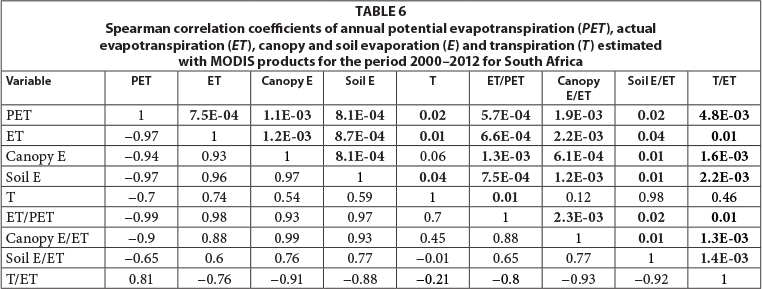
The relations between variables were determined using rS and the results are summarised in Table 6. The values below the main diagonal in Table 6 represent rS. A positive number represents positive correlation and vice versa. Good correlations tend to +1 (positive correlation) and -1 (negative correlation). The values above the main diagonal represent the probability associated with the null hypothesis. Values <0.05 represent statistically significant relations at probability of 95% or more, and these are highlighted in bold in Table 6. It is evident that there is generally a negative correlation between PET and all variables except T/ET. The remaining variables were generally positively correlated. Analysis by climatic region indicated that the correlations of ratios (Canopy E/ET, Soil E/T and T/ET) to other variables were generally not significant in the winter rainfall and especially arid and semi-arid climates.
In absolute terms, MOD16 ET estimated an average water loss to the atmosphere of 371.6 x 109 mm-a-1 for the country (Table 1). Assuming an average rainfall of 450 mm-a-1, corresponding to 553 x 109 mm-a-1, it was calculated that 67% of rainfall water evaporates. It was estimated that runoff is about 50 x 109 mm-a-1 or 9% of rainfall (DWAF, 2004) and that groundwater recharge is about 30 x 109 mm-a-1 or 5% of rainfall (Vegter, 1995; DWAF, 2005). Frenken (2005) estimated water withdrawal in South Africa to be 12.5 x 109 mm-a-1 in 2000. Considering missing data (about 3% of the total number of pixels), MOD16 ET estimates were about 15% short of the water balance closure for South Africa, possibly due to inaccuracies in the algorithm and input data (e.g. land cover).
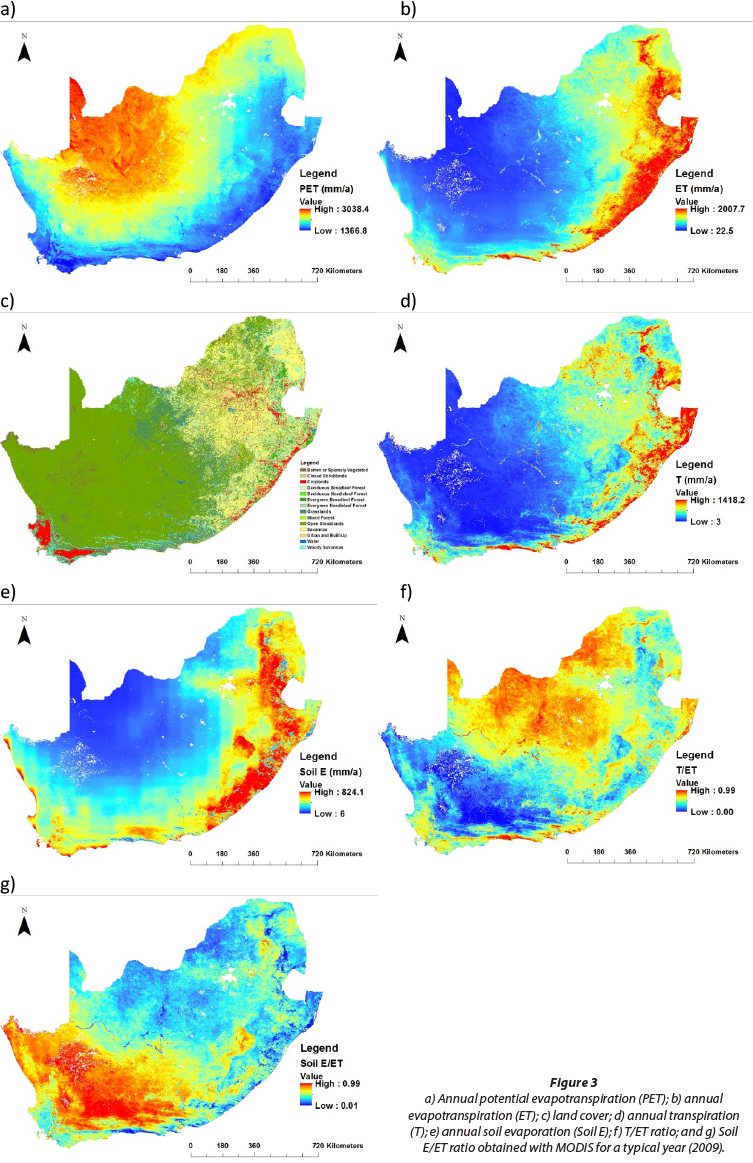
Spatial changes of MOD16 ET and ET components
Figure 3 (a to g) displays environmental variables obtained from MODIS for a typical year (2009) when annual ET and associated components exhibited the least deviations from the 13-year average (Table 1). Climatic conditions drive PET exhibiting a gradient from the southeast to the northwest (Fig. 3a). The gradient is inverse for ET (Fig. 3b), which is driven by atmospheric evaporative demand, but depends on rainfall (Fig. 1b) and vegetation cover (Fig. 3c). High rainfall areas (Fig. 1b) are generally associated with a more humid environment, lower PET and denser vegetation cover compared to dry areas. As a result, ET is higher in the tropical wet eastern region compared to the arid and semi-arid northwest region (Fig. 3b). Both components of ET, namely T (Fig. 3d) and Soil E (Fig. 3e), exhibit the same gradients, i.e., they are high in the high rainfall area of the east coast and low in the arid northwest of the country.
The MODIS land cover map (Fig. 3c) classifies the largest portion of inland South Africa (central and western regions) as open shrubland and grassland, with savanna occurring in the northeast part of the country. Land cover is classified as cropland mostly along the west and east coast and in the northeast. The main urban areas are clearly visible in the northeast (Johannesburg), southwest (Cape Town) and on the east coast (Durban). Values of MODIS variables were out of range for pixels coinciding with urban areas and these were discarded from the analysis. Another area with frequent missing data (out of range) is visible in the northwest inland and classified as barren or sparsely vegetated. The ratio T/ET tends to be high in the northern, summer rainfall parts of the country where grasslands commonly occur, and low in the dry southwest where sparse vegetation occurs (Fig. 3f). The opposite trend is visible for the Soil E/ET ratio (Fig. 3g). In the central and northwestern parts of the country, lines following major river systems (Orange and Vaal) are clearly visible providing exceptional values of high T/ET and low Soil E/ET (Figs 3f and g).
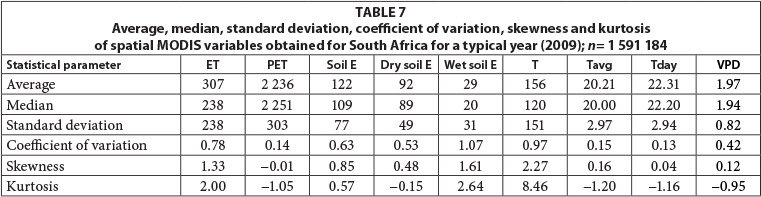
Table 7 shows the statistical analysis of MODIS spatial data for a typical year (2009). For ET and related variables (Soil E and T), the large standard deviations and coefficients of variation indicated the wide ranges of values observed. The median Annual values of PET, ET and its components are strongly dependent on climate (Tables 2 to 5). The highest PET values occurred in the semi-arid and arid areas (2 457 mm-a-1 on average) and the lowest under tropical wet conditions (1 892 mm-a-1) (Fig. 3a, Tables 3 and 5). This is consistent with isoreference evaporation maps produced by Savva and Frenken (2002) using ground-based meteorological measurements, and the historic pan evaporation data processed by Watkins (1993). Concerning ET and its components, an inverse spatial trend was observed. The highest ET, Canopy E, Soil E and T were under tropical conditions and the lowest in arid and semi-arid climate. ET was higher in summer rainfall areas compared to winter rainfall areas in some years, and lower in others, depending on rainfall pattern and distribution. Canopy E and Soil E were generally higher and T was lower in winter rainfall areas compared to summer rainfall. This was due to the low-intensity rainfall typically occurring in winter areas (frontal rain brought by cold fronts from the ocean) compared to tropical thunderstorms of high intensity occurring in summer rainfall areas. Canopy E in winter rainfall areas (8% of ET on average, Table 4) was consistent with the measurement of 6% made by Jovanovic et al. (2013) on fynbos vegetation endemic to this area. Canopy E in arid and semi-arid areas was basically negligible due to low rainfall and sparse vegetation. The highest ET/PET and Canopy E/ET ratios were in tropical areas (0.38 and 0.18 on average) and the lowest in arid areas (0.05 and 0). The highest Soil E/ET ratio was in arid areas due to sparse vegetation (0.52), followed by winter rainfall areas (0.46) due to low intensity rainfall. The highest T/ET ratio was in summer rainfall areas (0.63) with high intensity rainfall coinciding with periods of high atmospheric evaporative demand.
In comparative terms, Ahmad et al. (2005) estimated ET to be 3.51 mm-d-1 on average for the dominant land class (forest and woodlands) in the Olifants catchment (summer rainfall area), using a LandSat image and SEBAL on 7 January 2002. Meijninger and Jarmain (2014) estimated ET of dominant vegetation using MODIS and SEBAL. Annual ET was estimated to be 575 mm for native thicket, 520 mm for endemic fynbos and >800 mm for alien invasive and exotic forest plantation species in the Western Cape Province (southwest coastal zone of the winter rainfall region). In the KwaZuluNatal Province (east coast tropical wet region), annual ET was estimated to be 875 mm for alien invasive species, 755 for native thicket, 685 mm for savanna and 640 mm for grasslands. The dominant farming taking place along the east coast is with sugarcane. Olivier and Singels (2012), using lysimeters, measured a seasonal ET of irrigated sugarcane of between 1 061 and 1 378 mm depending on crop management. These literature data were collected for specific purposes, over different areas and targeted to specific types of vegetation, so a direct comparison with MOD16 ET is difficult. However, the values reported in the literature give a coarse indication that the ranges of ET were comparable to those estimated with MOD16 ET.
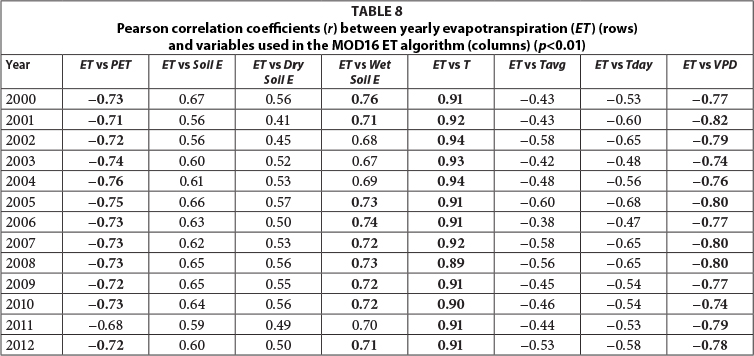
Data for ET and related components were correlated to test the interdependency of key variables in the algorithm. Table 8 summarises r obtained for ET and related variables per year. For convenience, |r| values >0.7 were marked in bold in values lower than averages and the positive skewness indicated that the frequency of observations is biased towards the low value range. For climatic variables (PET, Tavg, Tday and VPD), the frequency distribution tended to be symmetrical. Kurtosis is an indication of the shape (peak) of the distribution and varied from a negative number for the climatic variables (frequency distribution function with a shape of an inverted bell with no extreme tail values) to 8.64 for T (frequency distribution function with a sharp peak).
Table 8. This value was chosen arbitrarily to represent moderate to high correlation between variables. Attempts to fit nonlinear regression functions were made; however this did not result in substantial increases of R2. Significance tests resulted in probability values tending to 0 in all cases due to the large datasets and degrees of freedom (population number >100 000). The effects of large sample sizes on the p-value were discussed by Lin et al. (2003), who suggested procedures and guidelines to overcome this problem.
It is evident from Table 8 that ET was driven by atmospheric evaporative demand (PET) and strongly correlated to T and VPD. Analysis by climatic regions indicated that this was particularly true for winter rainfall and arid areas. Daytime average temperature (Tday) had higher r compared to Tavg (exception was tropical wet climate). The correlations between ET and Soil E were generally poor, with the exception of some years in arid areas. Concerning the directions of the relations, r was positive in the relations of ET to Soil E and T; an exception was the tropical wet climate where ET was negatively and weakly correlated to Soil E, possibly due to the effects of dense vegetation and canopy cover under humid conditions. The correlations between ET and climatic variables (PET, Tavg, Tday and VPD) had variable strength and were negative, with the exception of the tropical wet climate, where higher temperatures resulted in higher ET in most years.
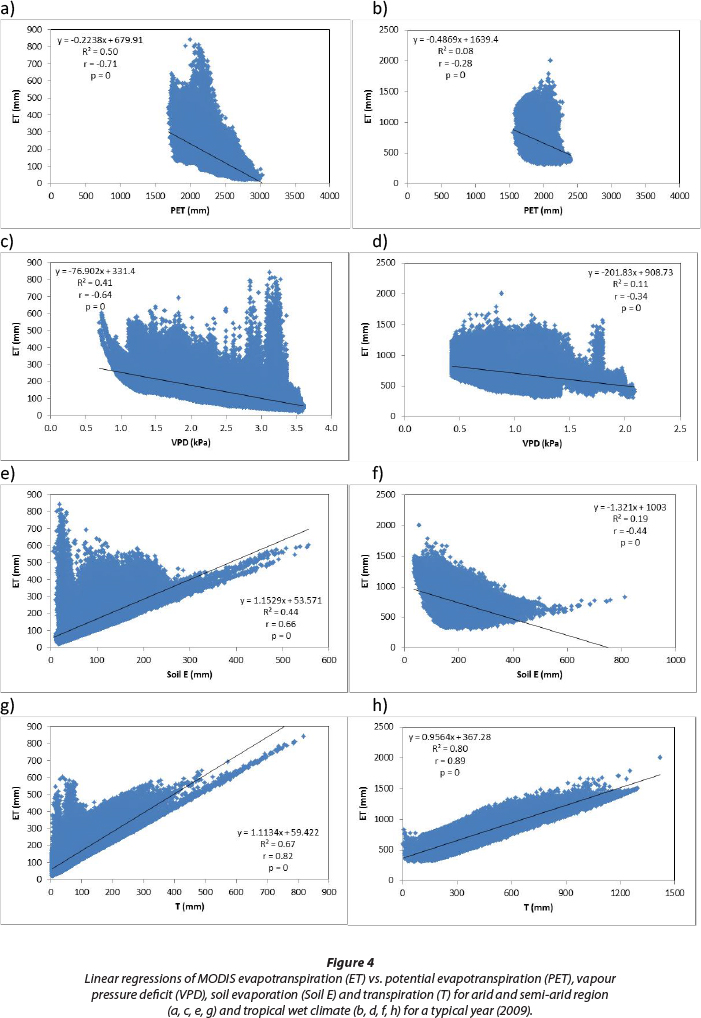
Examples of correlations between key algorithm variables are shown in Fig. 4 for two distinct climatic regions (tropical wet and arid to semi-arid) for a typical year (2009). Evapotranspiration (ET) is weakly driven by PET, particularly under tropical wet conditions. The negative slope of the linear regression indicates that ET is higher when the atmospheric evaporative demand is lower (Figs 4a and b). The correlation coefficient between ET and VPD was moderate in arid regions (Fig. 4c) and weak in the tropical climate (Fig. 4d). However, the direction of change was the same: higher VPD corresponded to lower ET (Tanner and Sinclair, 1983). The VPD derived from the global coarse-resolution (0.5°x0.66°) MERRA meteorological data cannot always reflect small-scale (1 km) VPD variations. As a result, small areas of wetland, springs or irrigated cropland may cause spikes in ET at high VPD values especially in the arid and semi-arid region. For example, this is visible in Fig. 4c at VPD ~ 3.25 kPa. Although outliers are visible in Figs 4c and d, the bulk of the data points are in the lower part of the graphs. Similar relations were generally observed for ET in relation to daily average and daytime temperature (data not shown). Figures 4e to h show the relations between ET and its components Soil E and T. The data distribution of ET vs. Soil E has a fanshape: it is controlled by T in the lower range of Soil E, whilst Soil E is usually the limiting factor in the high range of its values. The moderate R2 in the arid climate (Fig. 4e) indicates that Soil E is an important component of ET where vegetation is sparse and canopy cover is low. This is not the case in the tropical climate (Fig. 4f), where a low R2was observed with a negative slope of the linear regression, indicating that, in predominantly dense vegetation, T is the main controlling factor. Similar directions and relations were observed between ET and the separate components of Dry Soil E and Wet Soil E (data not shown). Amongst all factors analysed, ET had the strongest dependence on T (Figs 4g and h). The fanshape of the data plot is visible for arid areas (Fig. 4g), where the ET is controlled by Soil E in the lower range of T. In areas with dense vegetation, the R2 of the linear regression between ET and T was high and the fanshape of the data plot almost straightened completely (Fig. 4h). The T portion of the algorithm appears to be suitable for humid regions where ET is limited by available energy and stomatal resistance is regulated by air temperature and VPD. However, in dry regions, additional controlling factors like soil water supply play a role in the estimation of ET (Mu et al., 2007b).
CONCLUSIONS
Satellite Earth observations will be of huge importance in a variety of applications in future. Remote sensing-based methods have scope in routine applications for water and land resource planning and management, as well as in scientific research on physical, biogeochemical and ecological processes. In this study, we presented a first evaluation of MOD16 ET and related products for South Africa.
Average ET in South Africa (2000-2012) was estimated to be 303 mm-a-1 or 371.6 x 109 mm-a-1 (14% of PET and 67% of rainfall), mainly in the form of plant transpiration (53%) and Soil E (39%). Direct evaporation from the vegetation canopy was a minor component of ET (9% on average).
Evapotranspiration showed a slight tendency to decrease over the period 2000-2012 in all climatic regions except in the south of the country (winter rainfall areas), although annual variations in ET resulted in the 13-year trends not being statistically significant. Rainfall and atmospheric evaporative demand are the main climatic variables driving ET and particularly its transpiration component. The highest PET values occurred in the semi-arid and arid areas (2 457 mm-a-1 on average) and the lowest under tropical wet conditions (1 892 mm-a-1). Inversely, the highest ET, Canopy E, Soil E and T were under tropical conditions and the lowest in arid and semi-arid climate. Vapour pressure deficit (VPD) is an important climatic variable in arid and winter rainfall areas. The relation of ET to daytime average temperature generally had a higher correlation coefficient compared to Tavg in all climatic areas, except under tropical conditions. Evapotranspiration (ET) is strongly dependent on T in all climatic regions, and occasionally on Soil E in dry areas with sparse vegetation.
The MOD16 ET algorithm can be suitable to identify temporal changes and for relative comparisons of data between climatic regions. In absolute terms, MOD16 ET underestimated ET by 15% for water balance closure at national scale. These results, however, open up the opportunity to improve and test the algorithm for ET estimation, by accounting for both atmospheric demand limiting and soil water supply limiting conditions in the next research phase. The relatively coarse resolution of ~1 km2 pixels may have implications for applications in restricted areas, especially in heterogeneous vegetation, land use/cover and landscape.
ACKNOWLEDGMENTS
The authors acknowledge funding from the CSIR Parliamentary Grant and the National Research Foundation of South Africa.
REFERENCES
AHMAD M, MAGAGULA TF, LOVE D, KONGO V, MUL ML and KINOTI J (2005) Estimating actual evapotranspiration through remote sensing techniques to improve agricultural water management: A case study in the transboundary Olifants catchment in the Limpopo Basin, South Africa. In: Proceedings of the 6th WaterNet/ WARFSA/GWP Annual Symposium, 1-4 November 2005, Ezulwini, Swaziland. [ Links ]
ALLEN RG, PEREIRA LS, RAES D and SMITH M (1998) Crop Evapotranspiration: Guidelines for Computing Crop Water Requirements. Irrigation and Drainage Paper 56. United Nations Food and Agriculture Organization, Rome. 300 pp. [ Links ]
ALLEN RG, TASUMI M and TREZZA R (2007a) Satellite-based energy balance for mapping evapotranspiration with internalized calibration (METRIC) - Model. J. Irrig. Drain. Eng. 133 (4) 380-394. [ Links ]
ALLEN RG, TASUMI M, MORSE A, TREZZA R, WRIGHT JL, BASTIAANSSEN W, KRAMBER W, LORITE I and ROBINSON CW (2007b) Satellite-based energy balance for mapping evapotranspiration with internalized calibration (METRIC) - Applications. J. Irrig. Drain. Eng. 133 (4) 395-406. [ Links ]
BALDOCCHI D, FALGE E, GU G, OLSON R, HOLLINGER D, RUNNING S, ANTHONI P, BERNHOFER Ch, DAVIS K, EVANS R and co-authors (2001) FLUXNET: A new tool to study the temporal and spatial variability of ecosystem-scale carbon dioxide, water vapor, and energy flux densities. Bull. Amer. Meteor. Soc. 82 2415-2434. [ Links ]
BASTIAANSSEN WGM, MENENTI M, FEDDES RA and HOLTSLAG AAM (1998a) A remote sensing Surface Energy Balance Algorithm for Land (SEBAL) 1. Formulation. J. Hydrol. 212-213 198-212. [ Links ]
BASTIAANSSEN WGM, PELGRUM H, WANG J, MA Y, MORENO JF, ROERINK GJ and VAN DER WAL T (1998b) A remote sensing Surface Energy Balance Algorithm for Land (SEBAL) 2. Validation. J. Hydrol. 212-213 213-229. [ Links ]
BUGAN RDH, JOVANOVIC N and DE CLERCQ WP (2012) The water balance of a seasonal stream in the semi-arid Western Cape (South Africa). Water SA 38 (2) 201-212. [ Links ]
CLEUGH HA, LEUNING R, MU Q and RUNNING SW (2007) Regional evaporation estimates from flux tower and MODIS satellite data. Remote Sens. Environ. 106 285-304. [ Links ]
DI RIENZO JA, CASANOVES F, BALZARINI MG, GONZALEZ L, TABLADA M and ROBLEDO CW (2012) Grupo InfoStat, FCA, Universidad Nacional de Cordoba, Argentina. URL: http://www.infostat.com.ar (Accessed 23 October 2014). [ Links ]
DWAF (DEPARTMENT OF WATER AFFAIRS AND FORESTRY, SOUTH AFRICA) (2004) National Water Resource Strategy. 1st Edition. Chapter 2. Department of Water Affairs and Forestry, Pretoria. 54 pp. [ Links ]
DWAF (DEPARTMENT OF WATER AFFAIRS AND FORESTRY, SOUTH AFRICA) (2005) Groundwater Resource Assessment II - Task 3aE Recharge. Department of Water Affairs and Forestry, Pretoria. 129 pp. [ Links ]
FISHER JB, TU K and BALDOCCHI DD (2008) Global estimates of the land atmosphere water flux based on monthly AVHRR and ISLSCPII data, validated at FLUXNET sites. Remote Sens. Environ. 112 (3) 901-19. [ Links ]
FRENKEN K (2005) Irrigation in Africa in Figures - Aquastat Survey 2005. United Nations Food and Agriculture Organization, Rome. 53 pp. [ Links ]
JI L and GALLO K (2006) An agreement coefficient for image comparison. Photogram. Eng. Remote Sens. 72 (7) 823-833. [ Links ]
JIMENEZ C, PRIGENT C, MUELLER B, SENEVIRATNE SI, McCABE MF, WOOD EF, ROSSOW WB, BALSAMO G, BETTS AK, DIRMEYER PA and co-authors (2011) Global intercomparison of 12 land surface heat flux estimates. J. Geophys. Res. 116 (D02102) 1-27. [ Links ]
JOVANOVIC N and ISRAEL S (2012) Critical review of methods for the estimation of actual evapotranspiration in hydrological models. In: Irmak A (ed.) Evapotranspiration - Remote Sensing and Modelling. Intech, Rijeka, Croatia. [ Links ]
JOVANOVIC N, BUGAN R and ISRAEL S (2013) Quantifying the evapotranspiration component of the water balance of Atlantis Sand Plain Fynbos (South Africa). In: Stavros A and Stricevic R (eds.) Evapotranspiration - An Overview. Intech, Rijeka, Croatia. [ Links ]
JUSTICE CO, TOWNSHEND JRG, VERMOTE EF, MASUOKA E, WOLFE RE, SALEOUS N, ROY DP and MORISETTE JT (2002) An overview of MODIS land data processing and product status. Remote Sens. Environ. 83 3-15. [ Links ]
KORZOUN VI, SOKOLOV AA, BUDYKO MI, VOSKRESENSKY KP and KALININ GP (1978) World Water Balance and Water Resources of the Earth (English). Studies and Reports in Hydrology (UNESCO), no. 25/United Nations Educational, Scientific and Cultural Organization, 75 Paris (France); International Hydrological Decade. USSR National Committee, Moscow, USSR. 663 pp. [ Links ]
L'VOVICH MI and WHITE GF (1990) Use and transformation of terrestrial water systems. In: Turner BL, Clark WC, Kates RW, Richards JF, Mathews JT and Meyer WB (eds.) The Earth as Transformed by Human Action. Cambridge University Press, Cambridge, UK. [ Links ]
LIN M, LUCAS HC Jr and SHMUELI G (2003) Too big to fail: Large samples and the pvalue problem. Inf. Syst. Res. 24 (4) 906-917. [ Links ]
LYNCH SD and SCHULZE RE (2006) South African atlas of climatology and agrohydrology - Rainfall database. WRC Report No. 1489/1/06, Section 2.2. Water Research Commission, Pretoria. [ Links ]
MEIJNINGER WML and JARMAIN C (2014) Satellite based annual evaporation estimates of invasive alien plant species in South Africa. Water SA 40 (1) 95-107. [ Links ]
MONTEITH JL (1965) Evaporation and environment. Symp. Soc. Exp. Biol. 19 205-234. [ Links ]
MU Q, HEINSCH FS, ZHAO M and RUNNING SW (2007a) Development of a global evapotranspiration algorithm based on MODIS and global meteorology data. Remote Sens. Environ. 111 519-536. [ Links ]
MU Q, ZHAO M, HEINSCH FS, LIU M, TIAN H and RUNNING SW (2007b) Evaluating water stress controls on primary production in biogeochemical and remote sensing based models. J. Geophys. Res. 112 (G01012) 1-13. [ Links ]
MU Q, ZHAO M and RUNNING SW (2011) Improvements to a MODIS global terrestrial evapotranspiration algorithm. Remote Sens. Environ. 115 1781-1800. [ Links ]
MUELLER B, SENEVIRATNE SI, JIMENEZ C, CORTI T, HIRSCHI M, BALSAMO G, CIAIS P, DIRMEYER P, FISHER JB, GUO Z and co-authors (2011) Evaluation of global observations-based evapotranspiration datasets and IPCC AR4 simulations. Geophys. Res. Lett. 38 (L06402) 1-7. [ Links ]
MYNENI RB, HOFFMAN S, KNYAZIKHIN Y, PRIVETTE JL, GLASSY J, TIAN T, WANG Y, SONG X, ZHANG Y, SMITH GR and co-authors (2002). Global products of vegetation leaf area and fraction absorbed PAR from year one of MODIS data. Remote Sens. Environ. 83 (1-2) 214-231. [ Links ]
OLIVIER FC and SINGELS A (2012) The effect of crop residue layers on evapotranspiration, growth and yield of irrigated sugarcane. Water SA 38 (1) 77-86. [ Links ]
PRIESTLEY CHB and TAYLOR RJ (1972) On the assessment of surface heat flux and evaporation using large scale parameters. Mon. Weather Rev. 100 81-92. [ Links ]
SAVVA AP and FRENKEN K (2002) Crop Water Requirements and Irrigation Scheduling. Irrigation Manual. Module 4 FAO Sub-Regional Office for East and Southern Africa. Fontline Electronic Publishing, Harare, Zimbabwe. 122 pp. [ Links ]
SU Z (2002) The Surface Energy Balance System (SEBS) for estimation of turbulent heat fluxes. Hydrol. Earth Syst. Sci. 6 85-99. [ Links ]
TANNER CB and SINCLAIR TR (1983) Efficient water use in crop production: research or re-search? In: Taylor HM, Jordan WR, Sinclair TR (eds.) Limitations to Efficient Water Use in Crop Production. American Society of Agronomy, Madison, WI, USA. [ Links ]
VEGTER JR (1995) An explanation of a set of national groundwater maps. WRC Report No. TT 74/95. Water Research Commission, Pretoria. [ Links ]
WATKINS DA (1993) The relationship between daily and monthly pan evaporation and rainfall totals in Southern Africa. MSc thesis, Rhodes University. [ Links ]
ZHAO M, HEINSCH FA, NEMANI R and RUNNING SW (2005) Improvements of the MODIS terrestrial gross and net primary production global data set. Remote Sens. Environ. 95 164-176. [ Links ]
Received 13 May 2014
Accepted in revised form 10 December 2014
* To whom all correspondence should be addressed. 27 21 888 2506; Fax: +27 21 888 2682; e-mail: njovanovic@csir.co.za

