


Services on Demand
Article
 English (pdf)
 Article in xml format
 Article references
Indicators

Related links
-
 Cited by Google
 -
 Similars in Google
Share

 Permalink
Water SA
On-line version ISSN 1816-7950
Print version ISSN 0378-4738
Water SA vol.41 n.1 Pretoria Jan. 2015
http://dx.doi.org/10.4314/wsa.v41i1.7
Measuring spatial variability of land use associated with hydrological impact in urbanised quaternary catchments using entropy
M IlungaI, *; VP SinghII
IDepartment of Civil Engineering, College of Science, Engineering and Technology, Private Bag X6, Florida Campus, 1710, University of South Africa, South Africa
IIDepartment of Biological and Agricultural Engineering & Zachry Department of Civil Engineering, Texas A and M University Scoates Hall, 2117 TAMU College Station, Texas 77843-2117, USA
ABSTRACT
Decision making for water resources is needed for land-use change due to urbanisation, which impacts hydrological variables such as mean annual runoff (MAR) of catchments. Urbanisation introduces some degree of uncertainty (expressed as entropy) to this specific variable. This study uses Shannon or theoretic entropy as a tool for measuring land use variability/diversity of urbanised areas in South Africa. Positive correlations between entropy and increase in mean annual runoff (MAR) due to urbanisation are derived. Also, relationships between return period/risk of failure (flooding or water supply) and entropy are established. A case of Pieter Wright Dam of the Vaal drainage region is used to demonstrate these relationships. Consequently, the reliability of this dam is shown to be positively correlated with entropy. Data on surface water resources of South Africa 1990 (WR90) compiled by the Water Resource Commission (WRC) were used in this study.
Keywords: decision-making, entropy, hydrological impact, quaternary catchments, urbanisation, risk
INTRODUCTION
Known as a degree of uncertainty of a system or a measure of variability (Mishra et al., 2011), the Shannon entropy derived for communication science (Shannon and Weaver, 1949) has been applied to a range of problems in environmental and water resource engineering (Singh and Krstanovic, 1997; Singh, 1998; Singh, 2000; Markus et al., 2003; Ilunga and Stephenson, 2004; Keylock, 2005; Zhang et al., 2006; Chen et al., 2007; Xuan et al., 2012; Singh, 2011 and 2013). Xuan et al. (2012) used information entropy to provide a new regulation for complex ecological and environmental issues during urbanisation. Li et al. (2012) conducted an entropy weight observability-controllability risk analysis to select water resource planning alternatives. Ma et al. (2012) used information theory to measure and characterise water use diversity at a regional scale. Xiao et al. (2011) studied the dynamic evolution of entropy in both space and time for an urban land-use system and showed that the decrease in entropy of such a land-use system is linked to orderly development. Payraudeau et al. (2003) employed an entropy index to measure intra-sub-catchment land-use space variability using different land-use classes, and showed that the land-use variability was higher when using a higher number of categories than when using a lower number of categories. Consequently, entropy is regarded as a good measure of the spatial extent of land development (Deka et al., 2012). The study by Payraudeau et al. (2003) is one of only a few studies that have dealt with entropy and land-use classes.
Studies have shown that urbanisation impacts on runoff (e.g. Midgley et al., 1994; Shi et al., 2007; Zhou et al., 2013). Increases in impervious areas reduce infiltration and increase surface water runoff (O'Driscoll et al., 2010; Suriya and Mudgal, 2012). Extreme hydrological events such as floods can be associated with rapid urbanisation that modifies the nature of both the land surface and the river network (Shi et al., 2007; Ya et al., 2012) and may reduce runoff confluence time (Shi et al., 2007). Increased hydrological risk or loss of property can be due to severe events related to entropy (Singh, 2000). Patera (2001) established a connection between risk and entropy, using average daily values of damage caused by water supply deficiencies. However, no such relationship has previously been established between changes in MAR due to urbanisation and the degree of uncertainty measured in terms of entropy. Consequently, a relationship between entropy and the risk associated with flooding or water supply from a reservoir (dam) due to urbanisation has not yet been established. Two main categories of land-use classifications are used in the present study: major urbanised areas and non-urbanised areas. The current study investigates the connection between land-use variability (in terms of entropy index) and the increase in mean annual runoff (MAR) for major urbanised quaternary catchments (QCs) in South Africa. It also attempts to make the connection between entropy and risk associated with hydrological events, such as floods, that could result from urbanisation. Hence, the connection between reliability (as the inverse of risk) and entropy can be derived.
The land use and data used in this study are limited to the 1994 surface water resources assessment of South Africa (WR90) (Midgley et al., 1994). The current study does not deal with the temporal evolution of entropy, but with spatial variability of urbanised QCs. This is a preliminary study based only on the datasets (i.e. urbanised areas and non-urbanised areas) extracted from the WR90 reports. In this paper, non-urbanised areas implicitly encompass forestry, cultivation, mining and many others. The current study does not use data from the 2005 surface water resources assessment (WR2005 - Middleton and Bailey, 2009, 2011) or specific land cover classes such as forestry, mining, cultivation, etc. (Van der Berg et al., 2008; SANBI, 2009).
Land use and entropy
The Shannon entropy (i.e. degree of uncertainty or chaos) of a discrete hydrological variable X, written as H(X), can be expressed as follows:

where:
X is a random variable that takes on values x1, i = 1, 2, 3, ..., n
pi is the probability of occurrence of X = xi or event i
The unit of measurement of H(X) depends on the base of the logarithm; it is expressed in bits if the base is 2, in Napiers if the base is e, and in decibels (dB) if the base is 10. Studies relating entropy to land classes are very sparse, e.g. Xiao (2011) and Payraudeau et al. (2003). Considering different land use types, Eq. (1) can be recast as:

where:
H(A) is the entropy index (Payraudeau et al., 2003)
A is the total catchment area
pi is the area of land use ai divided by the total catchment area A
A higher value of H(A) implies higher catchment land use variability (Payraudeau et al., 2003). Chen et al. (2010) used information entropy as a measure of land type diversity. Land variability and land diversity are essentially synonymous. Subsequently, entropy was used as a measure of urbanisation, i.e., the probability of an urban area occurring around a city centre (Chen et al., 2010). The hydrological impact (i.e. change in runoff) due to urbanisation associated with entropy, distinguishes the current study from previous studies. Xuan et al. (2012) approached an urban ecosystem as a system where entropy change results from the exchange of flows of material and energy between the urban socio-economic system and the natural support system. This evolutionary approach is not adopted in the current study.
Entropy as a decision-making tool
Urban ecological regulation at a town scale can be developed with the aim at reducing the entropy of the system (Xuan et al., 2012); hence, the overall uncertainty of the system can be minimised. Information entropy theory can help managers to make planning decisions for the structural evolution of urban lands (Xiao et al., 2011; Deka, et al., 2012). A high degree of observability-controllability implies a large amount of information and, therefore, a small amount of uncertainty and risk (Li et al., 2012). In general, a sound decision-making process is associated with a certain level of risk. The notion of risk involves both uncertainty and some kind of loss or damage. Although the notion of risk is subjective, risk is seen as probability (uncertainty) and consequence (loss or damage); hence risk is related to entropy (Singh, 2000). The notion of risk for a dam, for example, may imply failure: flood events (e.g. peak discharges) are always associated with a risk of the dam being overtopped. Water supply from a dam (reservoir) is always associated with some degree of risk since the water retained by the dam (reservoir) might fail to satisfy demand. The failure indicator could be the water level, or the depth of water at the dam top (Singh, 2000). As the risk level increases (i.e. a gradual reduction in water supply before the expected low-flow period), the entropy of average daily values for damage caused by water supply deficiencies gradually decreases (Patera, 2001).
In this study, Eq. (3) below is an expression of the hydro-logical annual risk (R).

where:
T is the return period (recurrence interval)
R is the annual risk which relates to the probability of failure of the system
In this case, the notion of risk is expressed as the probability of occurrence of an event or the probability of the water system not meeting a given water demand. In particular, extreme events such as floods and droughts are associated with relatively low risk or probability of occurrence. These events may cause significant damages, e.g., property loss, life loss and ecosystem degradation, etc. Hence, the reliability (r), e.g. the capability of the system in meeting a certain demand (not flooding) is given by Eq. (4):

where:
r is the reliability
R is the annual risk, which is related to hydrological conditions
The ever-increasing demand for water resources and the change in natural conditions may increase the severity of current water shortages, flooding and deterioration of ecological function (Li et al., 2012). Water planners/managers have always been concerned with increasing water demand (Ma et al., 2012). Socio-economic growth fosters increases in water demand and urbanisation that may result in an entropy increase (Ma et al., 2012). For a water distribution network, a positive correlation between hydraulic reliability and entropy can be established (Tanyimboh et al., 2011). Entropy can be approached as a measure of the redundancy of the paths available for water flow in the water distribution network (Greco et al., 2012). Entropy may act as a surrogate of topological reliability, useful in water network design procedures, but does not provide information about the capability of the network to assure good performance after the occurrence of link failures (Greco, et al., 2012). The above studies suggest that the risk of failure (hence probability of occurrence) associated with increase in river runoff due to urbanisation can eventually lead to uncertainty. The risk of failure can be translated, for example, into dam failure, flooding, loss of property, etc. Increases in river runoff, or MAR, due to urbanisation can therefore be related to entropy or the level of uncertainty. Safety evaluation and reliability analysis can help water resource decision makers to reduce the risk of failure of hydraulic system operations. However, it is not the purpose of this study to explicitly show the costs/damage that can result from such a risk.
Effect of urbanisation on runoff
According to Midgley et al. (1994), urbanisation can cause significant changes in hydrological variables. Associated paved areas cause an increase in surface runoff and, in general, a decrease in groundwater recharge. The impact of urbanisation on runoff regime has also been reported in several other studies and the change in runoff evaluated (e.g. Shi et al., 2007; O'Driscoll et al., 2010; Suriya and Mudgal, 2012; Ya et al., 2012). Midgley et al. (1994) assumed that for South African QCs, the mean annual runoff (MAR) from paved surfaces would be 84% of mean annual precipitation (MAP), and developed the following equation:

where:
URB is the increase in runoff (Mm3-a-1)
Ap is the paved area as a proportion of the total catchment area
A is the total catchment area (km2)
MAP is the mean annual precipitation (mm-a1)
MAR is the mean annual runoff (mm)
A QC is the basic areal unit for water resource assessment in South Africa (Midgley et al., 1994). The primary drainage is divided into secondary, tertiary and quaternary catchments (QCs). The following nomenclature designating QC number was adopted. For example, a QC designated as W51F, which lies to the north of the town of Piet Retief, would have the following meaning: W is the primary drainage, 5 is the secondary drainage of the primary drainage W (a maximum of 9 secondaries per primary), 1 refers to the tertiary sub-drainage region (maximum of 9 tertiary per secondary). Finally, each quaternary sub-catchment name ends with an upper case letter -in this case F.
METHODS
Computation of entropy
The basis of the computation of land-use spatial variability is the Shannon entropy, which is recast in the form of Eq. (2) given previously. In the present study, the i values in Eq. (2) comprise urbanised and non-urbanised areas, since land-use types were classified into urban and non-urban for major urbanised hydrological QCs in South Africa, using the data extracted from WR90. Hence, each class (e.g. urban or non-urban) is not disaggregated into further components. In this case, Eq. (2) can be written as:

where:
H is the entropy index of the given QC
HUA is the marginal entropy index associated with the urbanised area
HNUA is the marginal entropy index associated with the non-urbanised area within the hydrological QC
For the two land-use types considered, the entropy index or land-use variability/diversity of the QCs will comprise the land use variability of the urbanised area (HUA) and the land use variability of the non-urbanised area (HNUA). For the rest of this paper 'marginal entropy index' and 'entropy' are used interchangeably. Eq. (2) was used for calculating entropy values. Eq. (5), combined with Eq. (2), was used to derive the relationships between entropy (HUA) and increase in MAR due to urbanisation (URB) for different QCs across the drainage regions of South Africa.
Hydrological risk and entropy
The notion of risk is approached from a hydrological perspective. Urbanisation (a feature of 'land diversity') is one of the main factors that influence entropy. The relationship between entropy and risk of failure (due to flooding) for the reservoir, as well as the relationship between entropy and risk of failure for water supply, will be investigated by assuming there is a framework for reservoir management/planning in place.
The relationship between entropy (uncertainty) and risk of failure for a reservoir (dam) due to flooding will be investigated as follows:
- It is assumed that the flooding amount of water leads to spillage.
- According to Eq. (3), risk (R) of failure (hence entropy) relates to return period (T) or recurrence interval. Hence, using Eq. (4), the reliability of the dam can be computed.
- For different recurrence intervals, storage-draft-frequency (S-D-F) curves help to determine the increase in storage as %MAR, for a given draft. This increase in storage can be expressed in terms of equivalent URB through Eq. (5). In this way, the relationship between entropy and URB due to flooding can be derived, when Eq. (5) is combined with Eq. (2).
The relationship between entropy and the risk of the hydraulic structure (dam) not meeting the demand due to the intensity of urban (land) development can be determined as follows:
- For a reservoir (dam), the increase in annual urban growth is usually associated with an increase in gross draft in terms of water supply (i.e. storage-draft-frequency curves are used).
- A given increase in gross draft (as % of MAR) corresponds to the increase in dam storage (i.e. live storage as % MAR) approximated at different recurrence periods (T) or probabilities of failure to meet water demand (entropy), hence failure of water supply.
- Similar to the flooding case, the increase in storage can be expressed in terms of equivalent URB via Eq. (5). Combining this equation with Eq. (2), the relationship between entropy and URB can be derived in the case of failure of the hydraulic structure (dam) to meet demand.
Data
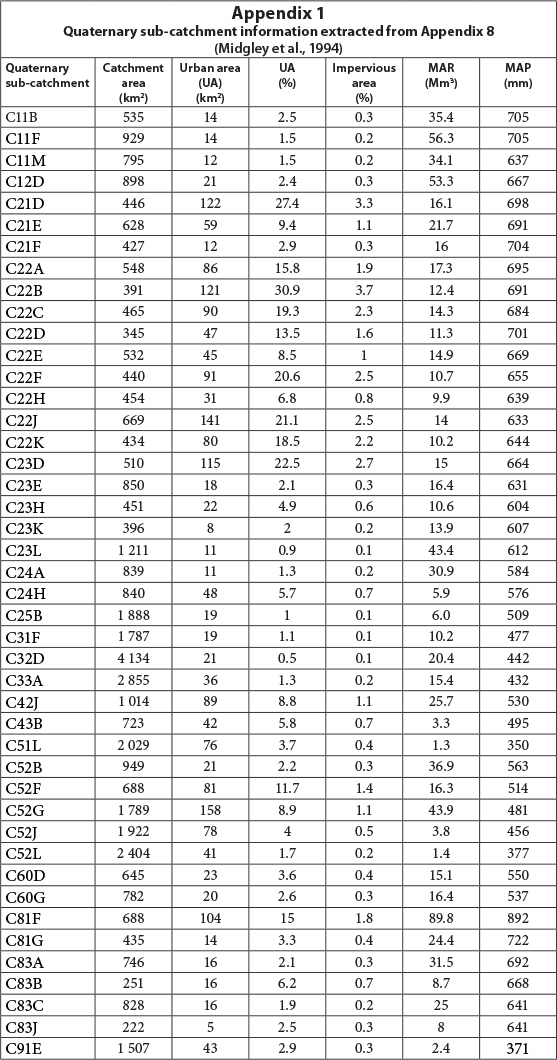
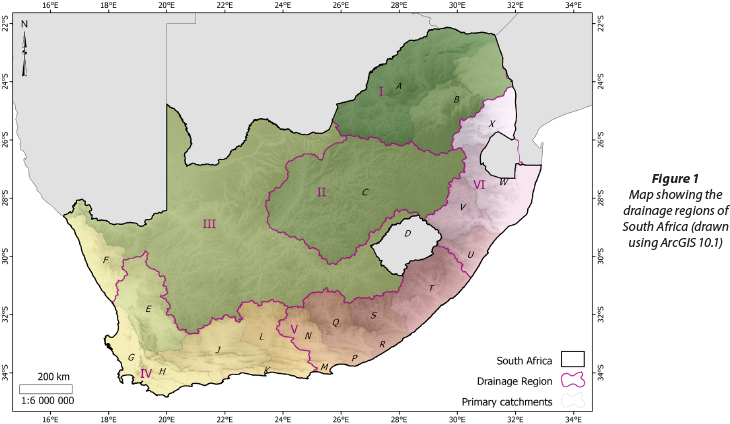
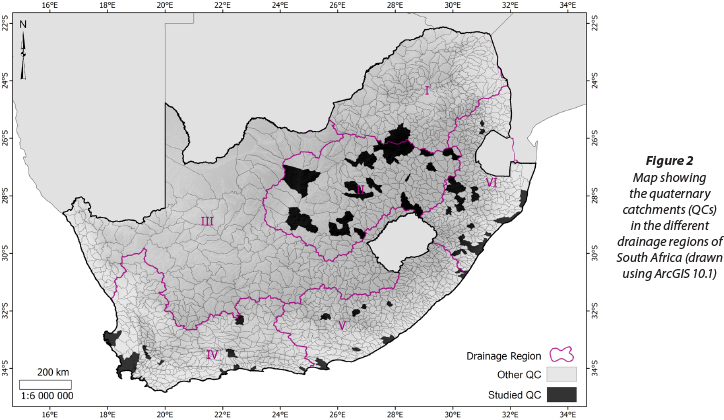
Land-use and hydrological data for this study were extracted from the 1990 surface water resources assessment of South Africa (Midgley et al., 1994). There are 5 primary drainage regions: I, II, III, IV and V (Fig. 1) and about 1 945 QCs (Fig. 2). Table 1 gives the catchment area, MAP and MAR of the primary drainage regions. Appendix 1 displays the information for different QCs (of the Vaal drainage region) that were used to compute the entropy values and the change in runoff due to urbanisation. Similar information for the remaining drainage regions used in this study can be found in Midgley et al. (1994).

Figure 3, i.e., Hydrozone: II-C according to the WR90 classification (Midgley et al., 1994) was used to derive the relationship between risk of flooding or supply of a reservoir (dam) and the marginal entropy index due to urbanisation. A preliminary illustration is given for the Pieter Wright Dam. This dam is situated in QC C22H of the Vaal drainage region and was chosen arbitrarily for illustration purposes. Pieter Wright Dam is an earth-fill embankment dam, erected in 1971 on the Riet River, in the town of Westonaria. The characteristics of the dam are summarised in Table 2.


RESULTS AND DISCUSSION
Computation of entropy
The steps involved in computing probabilities and entropy are shown below and are based on information relating to different land-use types for different QCs given in Appendix 1. For any quaternary catchment, the steps are as follows:
- Step 1. The marginal entropy index HUAfor an urbanised area is obtained using Eq. (2). as follows:

where: UA = urbanised area values expressed in % as given in Appendix 1.
- Step 2. The marginal entropy index HNUAfor the non-urbanised area is given by:

- Step 3. The total entropy index H associated with the total area (i.e. urbanised and non-urbanised areas) is estimated using Eq. (6):

- Step 4. % of H„. is obtained using Eq. (9) as given below:

- Step 5. From the data given in Appendix 1, Eq. (5) is used to calculate the increase in MAR due to urbanisation.
The entropy values calculated are summarised in Tables 3 to 7. Urbanised QCs that have negligible percentage values for impervious areas, as established from WR90 , were excluded from this study. QCs of the Orange River system (D, F or Region III), as well as C91B, R20B and U20C, V60D, V12F, V70E, V70F, W11A, V12H were therefore excluded.
Results presented in Tables 3 to 7 indicate that the marginal entropy values for various QCs were higher for urbanised areas than for non-urbanised areas, and constituted at least 69% of the total entropy index. One can thus infer that the major contributing factor to land-use spatial variability (entropy) was urbanisation for major urban QCs. Urbanised areas are linked to impervious areas. Since urbanisation increases hydrologi-cal variables such as runoff peaks and MAR (Midgley et al., 1994; Shi, et al., 2007), high entropy values (or uncertainty) for urbanised areas may correspond to severe hydrological events, such as floods. Hence sound planning or decision making is required to minimise the hydrological impact of urbanisation. This can be achieved, for example, through structured evolution of urban lands (Xuan et al., 2012; Deka et al., 2012).
Tables 3 to 7 also show that the highest marginal entropy values for drainage regions I, II, IV, V and VI were 0.159, 0.158, 0.159, 0.159 and 0.160 dB, respectively. The hydrological QCs associated with these values were A21C, C22B, G22C, M20A and U20M, respectively. It is noted that these values were close or equal to 0.16 dB. For South African QCs, the overall limit value for entropy can be reasonably assumed to be 0.16 dB. This value indicates the relatively higher uncertainty associated with urbanised areas for different QCs of South Africa, in terms of land-use spatial variability. The maximum entropy for any QC is 0.3 (Log 2) dB and the urbanised area in each of these QCs represents around 53% of the maximum degree of land-use spatial variability. This means that urbanisation in these specific QCs is more likely to have a greater influence on peak runoff, and hence on MAR. Urbanisation may change the hydrological response of a catchment (in terms of extreme events like storms or floods), increasing damage or hazard to property, infrastructure, etc. For any hydraulic system (e.g., a dam) located in these QCs, sound planning in terms of safety evaluation and risk assessment should be carried out.
In general, for a specific drainage region, it was observed that if an urbanised QC has the highest URB, its marginal entropy was also the highest or close to the highest value for that drainage region. For instance, for Limpopo-Olifants (primary drainage region I), A21C had both the highest value for marginal entropy (due to urbanisation) and the highest value for URB. For Vaal (primary drainage region II), C22B had its URB value closer to the maximum value of URB (8.10 Mm3) for the drainage region. For Western Cape (primary drainage region IV), G22C had both the highest value for marginal entropy (due to urbanisation) and the highest value for URB. For Eastern Escarpment (primary drainage region VI), U20M had its URB value closer to the highest value of URB (13.50 Mm3) for the drainage region. For Eastern Cape (primary drainage region V), M20A had the highest value for URB for the region. Higher values of URB relate to relatively greater hydrological uncertainty for urbanised QCs, since the change in MAR is relatively high. Decision-makers, such as water resource managers, urban planners, etc., should set good management plans for further urbanisation. Nonetheless, the uncertainty in these urbanised QCs approximates to 53% of the maximum uncertainty.
The relationship between URB and marginal entropy due to urbanisation of QCs was investigated, as shown in Figs. 4 to 9.
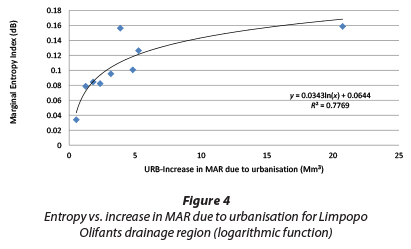
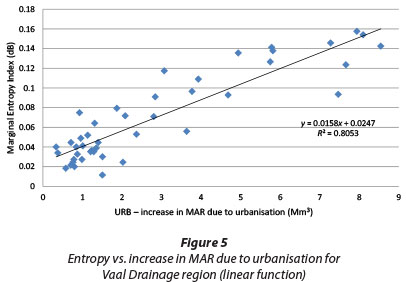
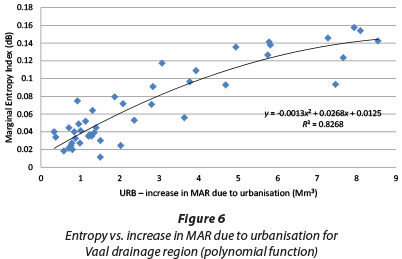

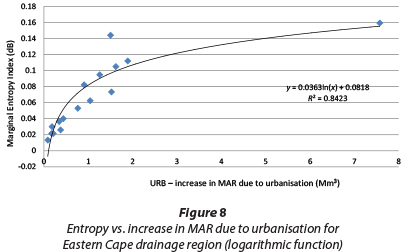
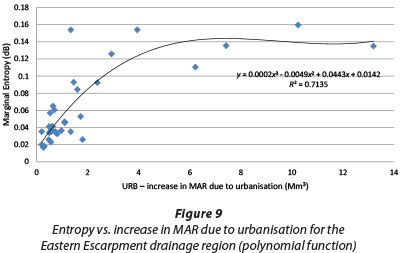
These figures reveal that this relationship in the South African context was linear, polynomial and logarithmic, with general forms as given below.


where:
a, b, c and d are coefficients determined by curve fitting
HUA and URB are as defined previously.
Eqs. (12) and (13) are logarithmic and polynomial functions, respectively. These equations show that the land use variability (entropy) rapidly increases for low-runoff values in QCs. Small changes in runoff may lead to relatively high changes in entropy. For relatively high runoff values, there is a slow increase in entropy. Eq. (11) suggests that land-use variability (entropy) increases uniformly with respect to runoff.
From Figs 4 to 9 it can be observed that, generally, the greater proportion of URB values are below 5 Mm3 for most primary drainage regions, except the Vaal, which has a quasi-uniform spread of URB values. Hence, for most QCs in drainage regions other than the Vaal, the rate of change in entropy due to urbanisation is relatively high.
While the rest of the drainage regions can be described by a single function, the QCs in the Vaal drainage system can be described by both linear and polynomial functions. However, the polynomial function (R2 = 0.83) describes the relationship between entropy and URB slightly better than the linear function (R2 = 0.81). Hence, Eqs. (11) to (13) suggest that the increase in runoff (hence MAR) in QCs due to urbanisation (URB) is related to the hydrological uncertainty or entropy. When entropy approaches its highest value (0.16 dB), the increase in runoff due to urbanisation (URB) for QCs may significantly contribute to the level of hydrological uncertainty. Hence, due to this maximum uncertainty, it would be wise for decision makers to pay attention to safety evaluation of water infrastructures situated in these QCs.
It was observed that the nature of the abovementioned equations (i.e. linear, logarithmic and polynomial functions) linking entropy and URB is not uniquely linked to hydrological, physiographic and geological characteristics of the selected QCs in the different drainage regions. For instance, QCs in Limpopo-Olifants, Western Cape and Eastern Cape drainage regions are all described by a logarithmic function, while QCs in the Eastern Escarpment and Vaal drainage regions are better described by a polynomial function. Nonetheless, it has been established that the change in MAR due to urbanisation (URB), which incorporates the MAP values, is linked to entropy and MAR may be influenced by hydrological, physiographic and geological characteristics of the QCs.
Relationship between hydrological risk and entropy
As outlined previously, the notion of risk is associated with entropy (e.g. Singh, 2000; Li et al. 2012; Patera, 2001). In this section, the Pieter Wright Dam (situated in the Vaal Drainage region) is used to establish the existing relationship between return period (annual hydrological risk of failure) and entropy. Secondly, the same dam is considered to demonstrate the relationship between entropy and risk of failure for water supply, by assuming urban development (urbanisation) around the catchment area of the dam. Consequently the reliability of the dam with respect to entropy can be derived in both situations.
Risk of failure due to flooding and entropy
According to WR90, the Pieter Wright Dam falls in the hydrological region named Hydrozone: II-C (Midgley et al., 1994). Hydrozone II-C storage-draft-frequency curves were therefore used for this specific dam (refer to Fig. 3). The total storage of a dam is comprised of live storage and reserve. For the Pieter Wright Dam, live storage can be assumed to be 2 Mm3 (77% of full dam capacity) and the reserve 33% of full dam capacity. Using storage-draft-frequency curves for 45% gross draft for Pieter Wright Dam, the following can be obtained:
- [Live storage/Net MAR] X 100 = 200/9.9 = 20% (Live storage as % of MAR)
- For T = 5 years, there is no increase in storage since the reference is 2 Mm3 and at T = 10 years, the increase in storage in terms of MAR is 1.4 Mm3.
- Hence for different return periods T (recurrence intervals) and risks of failure of the dam due to flooding, the computation of entropy can be summarised as in Table 8.

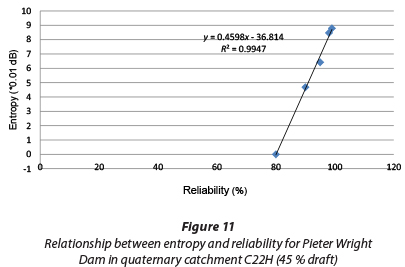
If the increases in MAR are considered to be equivalent to increases in runoff due to urbanisation (URB), Eq. (11) and Fig. 5 for the Vaal drainage region can then be used to correlate the return period (risk of failure of flooding) with entropy. Entropy calculations for different URB values are summarised in Table 9, which shows the connection between hydrological risk (reliability) and entropy. This relates to the argument that risk due to flooding relates to entropy (Singh, 2000). It should be noted that for T = 5 years, increase in MAR = 0, therefore URB = 0.

From Table 9, the entropy values increase with the return period, but decrease with the annual risk of failure due to flooding (defined earlier as the probability of occurrence or the inverse of return period), according to Eq.(3). Extreme events, such as floods, generally characterised by low probabilities of occurrence (or risk of failure of the dam), are associated with relatively high uncertainty values (entropy) (Fig. 10). Hence, high values of URB are associated with longer return periods, or low probabilities of occurrence of flooding (risk of failure of the dam). In other words, the frequency of large increases in MAR is low relative to the frequency of low increases in MAR; i.e., floods are usually associated with low probabilities of occurrence and may lead to severe damages or losses. Conversely, the reliability, defined earlier as the inverse of risk of failure (e.g. ability of dam to cope with flooding), increases with entropy (Fig. 11). Tanyimboh et al. (2011) obtained a similar correlation between entropy and reliability for a hydraulic water network distribution. For different T values, the increase in entropy (uncertainty) ranges from 30% to 55% of the highest entropy value. Since urbanisation increases entropy, decision-makers and urban planners should pay attention to flood planning and management during urbanisation. The above results should be understood within the limits of Eqs (3) and (4).

Risk of failure of water supply and entropy
In South Africa, an average annual urban growth of 2% is considered acceptable, according to the World Bank. It is worth mentioning that this urban growth is usually associated with increased water demand (Ma et al., 2012), and therefore an increase in gross drafts in terms of water supply. Using Hydrozone: II-C storage-draft-frequency curves for the Pieter Wright Dam, a gross draft (50% MAR) would correspond to 26% live storage (as % of MAR). For T = 5 years, there is a 6% increase in MAR corresponding to 0.6 Mm3. Calculations of increases in storage (as summarised in Table 10) can therefore be carried out for different recurrence intervals (risks of failure) of the dam not supplying/meeting the water demand. More water should be stored in order to meet the new demand. Alternatively, water transfer between dams within Vaal region and other drainage regions could be envisaged, since the current dam could not cater for this draft.

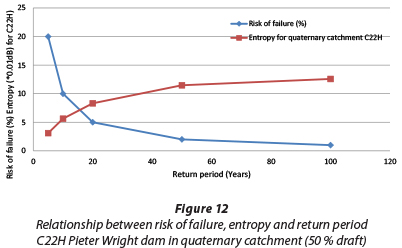
Similarly to the previous case, Eq. (11) developed for the Vaal Region can then be used to correlate the return period (or probability of failure of water supply due to urban growth) with entropy. Hence for different risks of failure of water supply due to urban growth, the values of entropy as well as reliability are obtained as shown in Table 11.

Results in Tables 10 and 11 are similar to the results depicted in Tables 8 and 9. Accordingly, Fig. 12 shows that hydrological risk (defined earlier as probability of failure of the water system or the inverse of the return period) decreases as entropy increases. A similar observation was made for entropy associated with average daily values of damage caused by water supply deficiencies (Patera, 2001). Hence, the annual risk due to urban growth is generally associated with relatively high gross drafts that can lead to an increase in entropy (uncertainty) of the water supply system not meeting the demand. Conversely, reliability, defined earlier as the inverse of annual risk (e.g. ability of the dam to meet the water demand), increases with entropy (Fig. 13). The strong correlation observed between reliability and entropy is similar to observations made by Tanyimboh et al. (2011) for a hydraulic water distribution network.

Entropy measures involved in this study show a connection with urbanisation. Urbanisation increasingly impacts on hydrological response (Zhou et al., 2013). However entropy does not provide information on how activities should be carried out or implemented during management/planning for further urbanisation. In addition, entropy does not indicate mechanisms of recovery for a system that could fail due to flooding or not meeting the water demand.
CONCLUSIONS
The concept of entropy has the potential to assist decision makers/urban planners to assess the level of uncertainty associated with urbanisation, which impacts on hydrological characteristics of watersheds. This preliminary study shows that information can be used to measure spatial variability of land use (i.e. urbanised areas and non-urbanised areas). Entropy (hence degree of uncertainty) generally increases with change in runoff due to urbanisation (URB) for hydrological quaternary catchments (QCs) of South Africa. Urban areas in South Africa contribute more to entropy than non-urban areas do. For these QCs, the relationships between entropy and URB were better described by linear, polynomial and logarithmic functions. No connection was established between the nature of these functions and the characteristics of QCs, such as hydrology, geology, physiographic conditions, etc.
The annual risk (probability of occurrence or the inverse of return period) of flooding due to urbanisation (as illustrated through Pieter Wright Dam) decreases as entropy increases. Hence the reliability of the dam increases. Good management of dam operation is required. The annual risk of failure (probability of failure) for the water supply system (Pieter Wright Dam) decreases as entropy increases. Hence, relatively high gross drafts associated with urban growth are related to increases in entropy related to the water supply system not meeting the demand. The reliability (inverse of the annual risk) of water supply is highly correlated with entropy, which is associated with change in runoff due to urbanisation. Entropy computations indicate that sound planning and management of water resources is required for further urbanisation so that adverse hydrological impacts can be minimised. However, entropy as a concept does not provide information on how a set of measures should be taken and implemented for future urban development.
This study was based only on WR90 data and did not include the temporal variability aspect of both urbanised and non-urbanised areas. Further work should include this aspect. Dams other than Pieter Wright Dam should be investigated. It would be interesting to extend the current study to data from the latest water resources assessment (WR2005) as well as the updated national land cover (i.e. NLC2009; Van den Berg et al., 2008).
REFERENCES
CHEN X, LI BL and ALLEN MF (2010) Characterising urban and agricultural and conservation land use change in Riverside County, California, USA. Ann. New York Acad. Sci. Ecol. Compl. Sust. 1195 164-176. [ Links ]
CHEN CC, TSENG CY and DONG JJ (2007) New entropy based method for variable selection and its application to the debris-flow hazard assessment. Eng. Geol. 94 (1-2) 19-26. [ Links ]
DEKA J, TRIPATHI OP and KHAN ML (2012) Urban growth trend analysis using Shannon entropy approach - a case study in North East India. Int. J. Geomatics Geosci. 2 (4) 1062-1067. [ Links ]
GRECO R, DINARDO A and SANTONASTASO G (2012) Resilience and entropy as indices of robustness of water distribution networks. J. Hydroinformatics 14 (3) 761-771. [ Links ]
ILUNGA M and STEPHENSON D (2004) Flow simulation model performance assessment using entropy approach. In: Shemang EM, Chaoka TR and Stephenson D (eds) Water Resources of Arid Areas. Taylor & Francis, London. ISBN: 0415359139. 23-27. [ Links ]
KEYLOCK CJ (2005) Describing the reccurence interval of extreme floods using nonextensive thermodynamics and Tsallis statistics. Adv. Water Res. 28 (8) 773-778. [ Links ]
LI XG, WEI X and HUANG X (2012) Comprehensive weight observability-controllability risk analysis and its application to water resource decision-making. Water SA 38 (4) 573-579. [ Links ]
MA L, KANG S, XUAN Y, SU X, SOLOMATINE DP (2012) Analysis and simulation of influencing factors on regional water use based on information theory. Water Polic. 14 (6) 1033-1046. [ Links ]
MARKUS M, KNAPP HV and TASKER GD (2003) Entropy and generalized least square methods in assessment of the regional value of streamgages. J. Hydrol. 283 (1-4) 107-121. [ Links ]
MISHRA AK, OZGER M and SINGH VP (2011) Associations between uncertainties in meteorological variables and water resources planning for the state of Texas. J. Hydrol. Eng. 16 (12) 984-999. [ Links ]
MIDGLEY DC, PITMAN WV and MIDDLETON, BJ (1994) Surface Water Resources of South Africa 1990, Volumes I to IV. WRC Report Nos. 298/1.1/94 to 298/6.2/94. Water Research Commission, Pretoria. [ Links ]
MIDDLETON BJ and BAILEY AK (2009) Water Resources of South Africa, 2005 Study (WR2005) Version 1. WRC Report No. TT 380/08. Water Research Commission, Pretoria. [ Links ]
MIDDLETON BJ and BAILEY AK (2011) Water Resources of South Africa, 2005 Study (WR2005) Version 2. WRC Report No. TT 512/11. Water Research Commission, Pretoria. [ Links ]
O'DRISCOLL M, CLINTON S, JEFFERSON A, MANDA A and McMILLAN S (2010) Urbanisation effects on watershed hydrology and in-stream processes in the Southern United States. Water 2 (3) 605-648. [ Links ]
PATERA A (2001) Applications of principles of the theory of information in management of reservoirs and water resource systems. Water Res. 28 (1) 21-29. [ Links ]
PAYRAUDEAU S, TOURNOUD MG and CERNESSON F (2003) Sensitivity of effective rainfall amount to land use description using GIS tool. Case of a small Mediterranean catchment. Phys. Chem.Earth 28 (6-7) 255-262. [ Links ]
SANBI (SOUTH AFRICAN NATIONAL BIODIVERSITY INSTITUTE) (2009) Updating the National Land Cover, 2009 (NLC2009). SANBI, Pretoria. [ Links ]
SHANNON CE and WEAVER W (1949) The Mathematical Theory of Communication. University of Illinois Press, Chicago. [ Links ]
SHI PJ, YUAN Y, ZHENG J, WANG JA, GE Y and QIU GY (2007) The effect of land use/cover change on surface runoff in Shenzhen, China. Catena 69 (1) 31-35. [ Links ]
SINGH VP (1998) Entropy as a decision tool in environmental and water resources. Hydrol. J. 21 (1-4) 1-12. [ Links ]
SINGH VP (2000) The entropy theory as a tool for modelling and decision making in environmental and water resources. Water SA 26 (1) 1-11. [ Links ]
SINGH VP (2011) Hydrologic synthesis using entropy theory: Review. J. Hydrol. Eng. 16 (5) 421-433. [ Links ]
SINGH VP (2013) Entropy Theory and its Application in Environmental and Water Engineering. John Wiley, New York. [ Links ]
SINGH VP and KRSTANOVIC PF (1987) A stochastic model for sediment yield using the principle of maximum entropy. Water Resour. Res. 23 (5) 781-793. [ Links ]
SURIYA S and MUDGAL BV (2012) Impact of flooding on urbanisation: The Thirusoolam sub watershed - a case study. J. Hydrol. 412-413 210-219. [ Links ]
TANYIMBOH TT, TIETAVAINEN MT AND SALEH S (2011) Reliability of assessment of water distribution systems with statistical entropy and other surrogate measures. Water Sci. Technol. Water Supply 11 (4) 437-443. [ Links ]
VAN DEN BERG EC, PLARRE C, VAN DEN BERG HM and THOMPSON MW (2008) The South African National Land Cover 2000 (NLC2000). Agricultural Research Council, Institute for Soil, Climate and Water. Report No. GW/A/2008/86. ARC ISCW, Pretoria. [ Links ]
XIAO J, LI J Q, CHEN JL and TANG P (2011) Analysis on the evolution of urban land structure and economic driving force in change. J. Agric. Sci. 3 (1) 163-168. [ Links ]
XUAN W, JIEQIONG S, SHAN S and ZHANG Y (2012) Urban ecological regulation based on information entropy at town scale. A case of Tongzhou district, Beijing City. Procedia Environ. Sci. 13 1155-1164. [ Links ]
YA L, YOUPENG X and YI S (2012) Hydrological effects of urbanisation in the Qinhuai river basin. In: 2012 International Conference on Modern Hydraulic Engineering. Procedia Eng. 28 767-771. [ Links ]
ZHANG Y, YANG Z and LI W (2006) Analysis of urban ecosystem based on Information theory. Ecol. Model. 197 (1-2) 1-12. [ Links ]
ZHOU F, XU YP, CHEN Y, XU CY, GAO YQ and DU JK (2013) Hydrological response to urbanisation at different spatio-temporal scales simulated by coupling of CLUE-S and the SWAT model in the Yangtze River Delta region. J. Hydrol. 485 113-125. [ Links ]
Received 7 June 2011
Accepted in revised form 7 November 2014
* To whom all correspondence should be addressed. +27 11 471-2791; e-mail: ilungm@unisa.ac.za

