


Services on Demand
Article
 English (pdf)
 Article in xml format
 Article references
Indicators

Related links
-
 Cited by Google
 -
 Similars in Google
Share

 Permalink
Water SA
On-line version ISSN 1816-7950
Print version ISSN 0378-4738
Water SA vol.40 n.4 Pretoria Oct. 2014
SST prediction methodologies and verification considerations for dynamical mid-summer rainfall forecasts for South Africa
Willem A LandmanI, II; Asmerom BerakiIII; David DeWittIV; Daleen LötterI
ICouncil for Scientific and Industrial Research, Natural Resources and the Environment, Pretoria, South Africa
IIDepartment of Geography, Geoinformatics and Meteorology, University of Pretoria, South Africa
IIISouth African Weather Service, Pretoria, South Africa
IVInternational Research Institute for Climate and Society, Palisades, New York, USA; current affiliation is NOAA/NWS
ABSTRACT
Seasonal-to-interannual hindcasts (re-forecasts) for December-January-February (DJF) produced at a 1-month lead-time by the ECHAM4.5 atmospheric general circulation model (AGCM) are verified after calibrating model output to DJF rainfall at 94 districts across South Africa. The AGCM is forced with SST forecasts produced by (i) statistically predicted SSTs, and (ii) predicted SSTs from a dynamically coupled ocean-atmosphere model. The latter SST forecasts in turn consist of an ensemble mean of SST forecasts, and also by considering the individual ensemble members of the SST forecasts. Probabilistic hindcasts produced for two separate category thresholds are verified over a 24-year test period from 1978/79 to 2001/02 by investigating the various AGCM configurations' attributes of discrimination (whether the forecasts are discernibly different given different outcomes) and reliability (whether the confidence communicated in the forecasts is appropriate). Deterministic hindcast skill is additionally calculated through a range of correlation estimates between hindcast and observed DJF rainfall. For both probabilistic and deterministic verification the hindcasts produced by forcing the AGCM with dynamically predicted SSTs attain higher skill levels than the AGCM forced with statistical SSTs. Moreover, ensemble mean SST forecasts lead to improved skill over forecasts that considered an ensemble distribution of SST forecasts.
Keywords: AGCM, SST predictions, seasonal forecasting, South Africa
INTRODUCTION
South Africa's seasonal rainfall variability is associated with different levels of predictability and is dependent on the time of the year: Spring (September-October-November) season rainfall totals are for the most part not predicted with high confidence owing to the fact that this season is mostly influenced by transient weather systems, while the best forecast skill has been demonstrated during mid-summer (Landman et al., 2005; Landman et al., 2012) when the tropical atmosphere starts to dominate the atmospheric circulation over South Africa (e.g. Mason et al., 1996; Landman and Mason, 1999). Some useful prediction skill is also found during austral autumn (Landman et al., 2005). However, the modelling work presented here only focuses on mid-summer (December to February - DJF), owing to the relatively high skill found for this season (Landman et al., 2005; Landman et al., 2009; Landman et al., 2012), and because the larger part of South Africa's austral summer rainfall areas receive most of their rainfall during this season.
The use of dynamically based atmospheric models as realtime operational seasonal forecasting tools has been practised in South Africa since the turn of the century (e.g. Landman et al., 2001). Major advances in the use of atmospheric general circulation models (AGCMs) for operational seasonal forecasting in South Africa also continued to occur at the Universities of Cape Town and of Pretoria, and at the Council for Scientific and Industrial Research. A notable recent advancement is the development of a fully coupled ocean-atmosphere model at the South African Weather Service (SAWS; Beraki et al., 2014). In addition, a notable acquisition by SAWS is the World Meteorological Organisation's Global Producing Centre for Long-Range Forecasts (GPCLRF) status. As part fulfilment of this obligation, SAWS runs the ECHAM4.5 AGCM (Roeckner et al., 1996) operationally, and so this model is the focus of this paper. However, the ECHAM4.5 forecast ensembles used in this study are obtained from the Data Library of the International Research Institute for Climate and Society (IRI) and not from the archives of SAWS, since the IRI archived data set of this AGCM is more comprehensive. For example, the IRI has available a variety of ECHAM4.5 hindcast sets and for various forecast lead-times. These archived sets can be used to help determine some of the modelling strategies that SAWS, and possibly other institutions in South Africa involved with AGCM operations, can follow in order to optimise their own operational seasonal forecasting systems.
Employing predicted or persisted SST anomalies in AGCMs provides a means of generating forecasts of seasonal-average weather (Graham et al. 2000; Goddard and Mason, 2002), since the evolution of global sea-surface temperature (SST) anomalies over several months ahead is predictable, especially over the tropics, even with statistical models (Landman and Mason, 2001). Coupled ocean-atmosphere general circulation models (CGCMs) have also been increasingly used worldwide for operational seasonal forecast production (e.g. DeWitt, 2005; Graham et al., 2011). Furthermore, it has been shown through the DEMETER (Development of a European Multimodel Ensemble system for seasonal to inTERannual prediction) project that fully coupled systems can predict both the evolution of SSTs and atmospheric conditions at elevated levels of skill (Palmer et al., 2004) relative to AGCM skill (Graham et al., 2005). The foundations laid by the DEMETER and other projects contributed towards the development of a coordinated system for seasonal to decadal prediction, assessed via a comprehensive set of 46 years of hindcasts produced by state-of-the-art climate models (Van der Linden and Mitchell, 2009). Notwithstanding these modelling developments, when skilful SST forecasts are used AGCMs may perform equally as well as the current CGCMs (Troccoli et al., 2008), and so CGCMs can benefit AGCMs by applying their predictions of SST evolution to force AGCMs (Li et al., 2008). This study investigates to what extent an AGCM's mid-summer seasonal forecasts for South Africa is sensitive to the SST forecasting strategy selected to force the atmospheric model. Mid-summer is the season often associated with the highest level of skill (Landman et al. 2012) and therefore the effect various modelled options of the forcing SST fields may have on the AGCM's forecast skill for specifically mid-summer rainfall totals over South Africa is the main focus of the paper.
DATA AND METHODS
The district rainfall data set of the South African Weather Service (Van Rooy, 1972) was used to calculate 3-month DJF seasonal rainfall totals for 94 evenly distributed locations across South Africa (cf. Fig. 4 for the locations of the centroids of the districts). This data set is available from 1921 and is updated every month. Here we consider only the rainfall data from 1968 through 2002 in order to match the available AGCM hindcasts used in this paper.
The ECHAM4.5 AGCM hindcast data used here are obtained from the Data Library of the IRI (IRI, 2013) and consists of 3 sets. Each of the three AGCM experiments was composed of an ensemble of 24 integrations. The atmospheric initial conditions for all three experiments are described in Li et al. (2008). In summary the atmospheric initial conditions for each of the three sets of experiments at any given start time are identical and were generated by adding random machine precision level perturbations to the wind field during the model spinup period; thus no observed initial conditions were used for any of the experiments. The first AGCM set (available from 1957 to July 2008) consists of 24 ensemble members and was produced by forcing each of the 24 runs with identical SST anomalies that were predicted using constructed analogues (Van den Dool, 1994). The two additional AGCMs sets, also consisting of 24 ensemble members each and available from 1958 to 2001, were a result of forcing the atmospheric model with two separate configurations of dynamically predicted SST. The first of these sets was a result of forcing each of the 24 AGCM runs with the identical ensemble mean of ECMWF SST forecasts (9 members) created during the DEMETER project. The second set of AGCM forecasts forced with dynamically predicted SST was created by considering each of the nine ECMWF SST ensemble members - a scenario of SST forecasts was therefore considered by using some SST ensemble members 3 times, and some only 2 times, in order to produce a set of 24 AGCM ensemble members. The least number of times an SST ensemble member was used was 2 and no ensemble members were identical. The three experiments only differ in their prescribed SST forcing. Take note that the SST anomalies from the coupled model runs were added to the observed climatology, subsequently removing the mean bias in the SST from the coupled model. Owing to the availability of archived DEMETER hindcasts, only a 1-month lead-time is considered here which implies that DJF hindcasts were produced near the beginning of November.
Empirical downscaling or recalibration of GCM fields to regional rainfall has already been successfully employed for southern Africa (e.g. Landman and Goddard, 2002, Landman and Beraki, 2012) and it has been shown conclusively that empirically post-processing GCM large-scale fields is a necessary requirement for optimal seasonal rainfall forecast performance for South Africa, especially for mid-summer predictions (e.g., Landman and Goddard, 2002; Shongwe et al., 2006). Model output statistics (MOS; Glahn and Lowry, 1972) equations are developed here because they can compensate for systematic deficiencies in the global models directly in the regression equations (Wilks, 2011). Variables such as large-scale atmospheric circulation are better simulated by most models than rainfall and should probably be used instead in a MOS system to predict seasonal rainfall totals. In fact, the model's 850 hPa geopotential heights have been found to be a proven southern African seasonal rainfall predictor using MOS (Landman and Goddard, 2002; Landman et al., 2005; Landman et al., 2009, 2012; Landman and Beraki, 2012) and this field is again used here as predictor. The predictor sets are the ensemble means for each of the three 24-member AGCM experiments and the predictand the 94 South African districts which remain the same for each experiment. The predictor fields used in the MOS are restricted over a domain that covers an area between the Equator and 45°S, and 15°W to 60°E. This domain is large enough in order to capture both the rain- and drought-producing low-level circulations as represented by the various model configurations. The MOS equations are developed by using the canonical correlation analysis (CCA) approach described in Barnett and Preisendorfer (1987); the downscaling procedure is reported on in detail in earlier work as applied to southern African seasonal rainfall prediction (Landman et al., 2001; Landman and Beraki, 2012; Landman et al., 2012).
In order to minimise artificial inflation of forecast skill, the downscaled forecast performance should mimic a true operational forecasting environment where no prior knowledge of the coming season is available. The MOS models are first trained with information from 1968/69 leading up to and including 1977/78. The first MOS training period is therefore 10 years. The seasonal rainfall of the next year, 1978/79, is then predicted using the trained MOS model. The MOS model is subsequently retrained using information leading up to and including 1978/79 (11 years) to predict for 1979/80 conditions. This procedure is continued until the 2001/02 DJF rainfall is predicted using a MOS system trained with data from 1968/69 to 2000/01, resulting in 24 years (1978/79 to 2001/02) of independent downscaled forecast data. Such a procedure is referred to as retro-active forecasting (e.g. Landman et al. 2001). Cross-validation (Michaelsen, 1987) is performed over the entire 34-year period from 1968/69 to 2001/02. In order to minimise the chance of obtaining biased results a large 5-year-out window is used. The first 10 years are subsequently discarded resulting in 24 years of cross-validated downscaled hindcast (deterministic) over the same period as the retro-active down-scaled forecasts, i.e., 1978/79 to 2001/02.
The skill of the three AGCM-MOS systems (the AGCM forced with statistically predicted SST and the same AGCM forced with two different configurations of ECMWF SST forecasts) is determined both probabilistically and deterministically. Probabilistic verification is conducted on the 24 years of retro-active DJF rainfall forecasts, while deterministic verification is performed on the 24 years of cross-validated hindcasts. For the former, the observed and predicted fields are separated into 3 categories, defining above-normal, near-normal and below-normal DJF rainfall totals. Two approaches are adopted here: The first is the familiar equi-probable 3-category description (the thresholds are respectively the 33rd and 67th percentile of the climatological record) and the second approach defines the below- and above-normal threshold values respectively by the 15th and 85th percentile values of the climatological record, i.e., seasonal extremes. Probabilistic MOS forecasts for each of the 24 retro-active years are obtained from the error variance of the cross-validated predictions using the ensemble mean (Troccoli et al., 2008) for each of the various training periods required for generating the retro-active forecasts. Verification results of only the above-normal and below-normal categories are presented owing to the low skill found for the near-normal category.
Two of the main attributes of interest for probabilistic forecasts are discrimination (whether the forecasts are discernibly different given different outcomes), and reliability (whether the confidence communicated in the forecast is appropriate). The forecast verification measures presented here for testing of the aforementioned attributes are the relative operating characteristic (ROC) (e.g. Mason and Graham, 2002), and the reliability diagram (Hamill, 1997). A ROC graph can be constructed by plotting the forecast hit rates against the false-alarm rates. For good forecasts the hit rate will accumulate faster than the false-alarm rate, resulting in a ROC graph that curves towards the upper left. For perfect discrimination the area beneath the curve would be 1.0, and for no skill the area beneath the curve would be 0.5 (the ROC curve will coincide with the diagonal) or lower. ROC applied to probabilistic forecasts indicates whether the forecast probability was consistently higher when a flood or drought season occurred compared to when it did not occur. Although the ROC is a verification procedure recommended by the World Meteorological Organisation, it has been criticised because the reliability of the forecast probabilities is ignored (Troccoli et al., 2008).
Forecasts are considered reliable if there is consistency between the predicted probabilities of the defined rainfall categories and the observed relative frequencies of the observed rainfall being assigned to these categories. The reliability diagrams presented below are used to assess if the downscaled models are able to produce well-calibrated probability forecasts and include reliability curves for the above- and below-normal categories along with their respective least-squares regression lines. The regression lines are calculated with weighting relative to how frequently forecasts are issued at a given confidence. Forecasts are considered perfectly reliable when these weighted regression lines lie perfectly along the diagonal of the reliability diagram, but when the regression lines lie above (below) the diagonal observed above- or below-normal values tends to occur more (less) frequently and then the forecasts are considered under-confident (over-confident). Frequency histograms are also included and show the frequencies with which forecasts occur in probability intervals of 10%, starting at 5%. The ROC graph has an advantage over the reliability diagram in being less sensitive to sampling errors, and so can be more meaningfully constructed given the small sample sizes typical of seasonal forecasting (Troccoli et al. 2008). The interpretation of ROC scores and reliability diagrams in general can be found in Troccoli et al. (2008), Barnston et al. (2010), Wilks (2011) and Jolliffe and Stephenson (2012), among others.
For the deterministic verification work 3 correlation values are calculated: Pearson or 'ordinary' correlation to measure the association between the deterministic cross-validated hindcasts and the DJF rainfall at each district over the 24 years, and the robust and resistant alternatives to the Pearson correlations, namely, the Spearman rank correlation and Kendall's tau. The Spearman correlation is simply the Pearson correlation, but using the ranks of the hindcasts and of the observations. Kendall's tau is calculated by considering the relationships among all possible matchings of the hindcast and observation pairs (Wilks, 2011). Spearman and Kendall's tau (both are non-parametric tests) are better suited than Pearson for verification of precipitation since rainfall has a non-Gaussian distribution. What additionally makes the Kendall's tau attractive is that it has close affinities to the area beneath the ROC curve (Jolliffe and Stephenson, 2012), used here for verification of the probabilistic retro-active forecasts.
Model performance
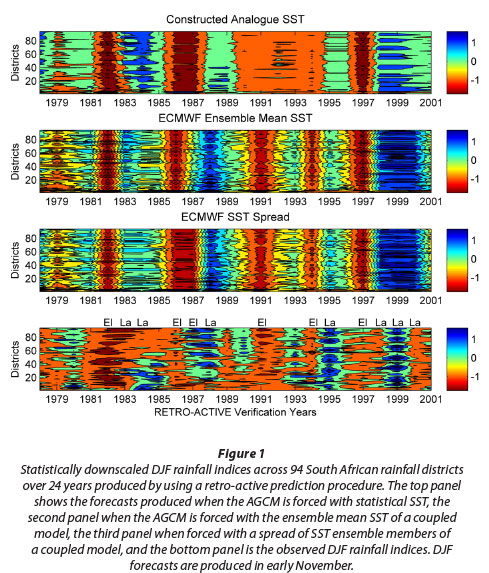
The deterministic retro-active DJF rainfall forecasts across the 94 districts and over the 24-year test period (1978/79 to 2001/02), from each of the three AGCM-MOS models along with the observed, are shown in Fig. 1. Both predicted and observed values are normalised since the rainfall distribution over South Africa varies from wet over the eastern parts to semi-arid to arid over the western parts. El Niqo (marked 'El') and La Niqa (marked 'La') seasons are also shown on the figure. El Nino and La Nina seasons are identified according to the Oceanic Niqo Index (CPC, 2013). The top panel of Fig. 1 shows each district's DJF rainfall index as predicted by the AGCM forced with statistical SST. Below that are the rainfall index forecasts produced by the AGCM forced with the two SSTs configurations of the ECMWF coupled model. From the figure one notices the similarities between the middle two panels (AGCM forced with ECMWF SST) and that these two forecasts are somewhat different to the forecasts shown in the top panel (forcing the AGCM with statistical SST), especially during the late 1980s and the first half of the 1990s. Take note that the three forecast systems tend to predict dry (wet) conditions during El Niqo (La Niqa) seasons, although it may not always turn out to be dry (wet) during El Niqo (La Niqa) seasons as can be seen when the forecasts are compared to the observed (bottom panel). Next we will do proper verification over the 24-year test period in order to determine how the various forecast systems compare with the observed and subsequently with each other.
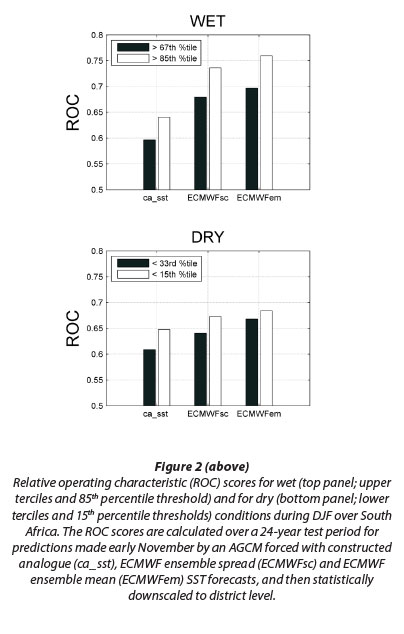
Skill levels of the retro-active downscaled probabilistic forecasts of the three AGCM-MOS models are shown in Figs 2 and 3 (ROC scores and reliability diagrams, respectively). Figure 2 shows that the highest ROC scores are found when forcing the AGCM with the SST forecasts from the coupled ECMWF model. Moreover, the forecasts associated with the ECMWF SST ensemble mean are also somewhat superior to the forecasts associated with the ECMWF SST ensemble spread. Furthermore, the higher ROC scores are found for the extreme cases (respectively lower and higher than the 15th and 85th percentile values), especially when predicting for extremely wet seasons. The reliability plots of Fig. 3 are for the extreme cases only and show very similar results for both cases of ECMWF SST predictions, but show lower reliability when using this statistical SST forecast model: The regression lines on Fig. 3 (weighted least-squares regression of the respective reliability curves) are close to the diagonal for the ECMWF SST forced extreme forecasts, but show over-confidence (regression lines are shallower than the diagonal) for the statistical SST forced forecasts, especially for predicting extremely dry years. None of the three forecast systems show strong sharpness (the level of confidence that is communicated in the forecasts), since the most frequent forecast category is near 15%, the climatologi-cal probability for the extreme cases. The verification results presented thus far agree with what has been suggested by the forecasts shown in Fig. 1: The AGCMs forced with SSTs predicted by the coupled model are superior to the AGCM forced with statistical SST, and that the two SST scenarios resulted in similar levels of skill although the AGCM forced with an ensemble mean SST seems superior.

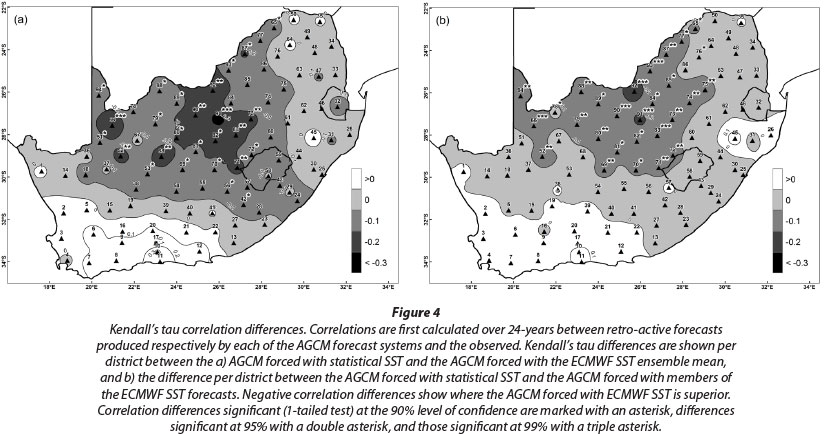
The AGCM forced with statistical SST is thus considered to be the weakest of the three systems and so we subsequently find out the locations in South Africa where the AGCMs forced with ECMWF SST are superior. For this analysis we use Kendall's tau owing to its close affinities to ROC scores (Jolliffe and Stephenson, 2012). Kendall's tau correlations between retroactive forecasts of the three AGCM-MOS models and observed DJF rainfall indices are subsequently calculated. Figures 4a and 4b respectively show the Kendall's tau difference per district between the AGCM forced with statistical SST and the AGCM forced with the ECMWF SST ensemble mean, and the difference per district between the AGCM forced with statistical SST and the AGCM forced with members of the ECMWF SST forecasts. Negative correlation differences show where the AGCM forced with ECMWF SST is superior. The statistical significance of these differences is calculated by a re-randomisation or Monte Carlo test (Livezey and Chen, 1983; Wilks, 2011). This test is done by randomly resampling the observed data of each district, followed by calculating the Kendall's tau correlations for each retro-active forecast set using the re-randomised observed data, and then calculating the correlation differences. The procedure is repeated 1 000 times and the differences for each district sorted. Districts with Kendall's tau differences significant at the 90% level of confidence are marked with an asterisk, those at 95% with a double asterisk, and those at 99% with a triple asterisk. Most of the districts are associated with negative differences and the biggest improvement is found over the central parts of South Africa where most of the statistically significant differences are also found.
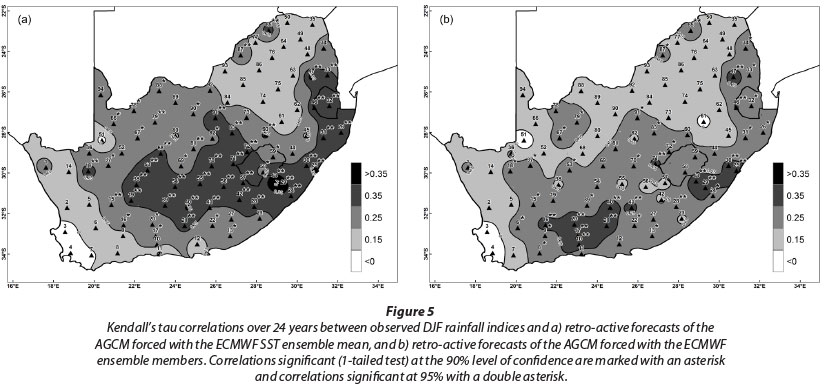
The AGCM forced with the ECMWF SST ensemble mean shows the largest improvement over the AGCM forced with statistical SST. Figures 5a and 5b show the Kendall's tau correlations between the retro-active forecasts of the AGCM forced with the ECMWF SST ensemble mean, and the correlations between the retro-active forecasts of the AGCM forced with the ECMWF ensemble members, respectively. Significance is once again calculated using a Monte Carlo test. Correlations significant at the 90% level of confidence are marked with an asterisk and correlations significant at 95% with a double asterisk. Comparing Fig. 5a with Fig. 5b confirms the verification results above, and shows the AGCM forced with the ensemble mean SST to be superior. Moreover, this conclusion is further confirmed using the Spearman rank as well as the (ordinary) Pearson correlation. Figure 6 represents the number of districts (out of 94) with local significance at respectively the 90% and 95% level of confidence for all three correlation parameters calculated from the retro-active forecasts. A larger number of districts found to be significant implies that a larger area of South Africa is associated with significant correlations. For both levels of confidence and all three correlations, the AGCM forced with the ensemble mean SST of the ECMWF coupled model is found to be the best configuration for DJF rainfall predictions over South Africa. Also take note that the non-parametric rank correlations are generally more conservative (fewer districts with local significance) than the Pearson correlation that requires that the predicted and observed values are normally distributed.

Two approaches for creating model forecasts for testing have been presented here: cross-validation and retroactive forecasting. For the MOS downscaling, the Climate Predictability Tool is used, and this software uses cross-validation to generate the required error variances for the subsequent creation of retro-active probability forecasts (Troccoli et al., 2008). This configuration may pose problems with short data sets owing to the even shorter initial training period. In fact, the initial training period used in this paper for predicting the first retro-active year (1978/79) is only 10 years (1968/69 to 1977/78), and so the question arises whether such an initial small sample, albeit incrementally increased by one year during the retro-active forecast procedure, impacts negatively on the forecast skill of the systems being tested. Figure 7 shows, for each AGCM system, the differences of the predicted DJF rainfall indices between the cross-validation hindcasts and the retro-active forecasts. Shadings of blue (red) show where and when the retro-active process has predicted anomalies larger (smaller) than those of the cross-validation hindcasts. At the bottom of the figure an area-averaged time-series over the verification period for each AGCM configuration is also presented. The time-series represent the observed (grey), cross-validated (red) and retro-active (blue) area-averaged values. With the exception of a small number of cases (e.g. 1987/88 of the ECMWF SST spread), the cross-validated and retro-active forecasts are in strong agreement. This result has provided evidence that the retro-active procedure followed in this paper may not have been negatively impacted by the initial small samples used to predict over the 24-year test period, since it produced similar results to the cross-validation procedure.

DISCUSSION AND CONCLUSIONS
Coupled models represent the state-of-the-art in seasonal climate forecasting. However, given perfect SST to force an AGCM, i.e., in an AMIP-like integration (Gates, 1992), such runs have been shown to perform as well as a coupled model that uses the same AGCM when simulating South African seasonal rainfall totals (Landman et al., 2012). Thus, AGCMs may perform at least as well as fully coupled models over South Africa when skilful SST forecasts are used to force the AGCM. Since AGCMs do not require the same amount of computing resources as coupled models, higher resolution, larger ensembles and longer lead-time forecasts can be produced by an AGCM. Moreover, the generation of hindcasts (re-forecasts) to assess model performance and to calibrate model output are more easily achieved with an AGCM (Troccoli et al., 2008). Although coupled modelling on seasonal time scales has recently been launched in South Africa (Beraki et al., 2014), the use of AGCMs in this country may thus continue for quite a few years to come.
Modellers need to consider options on how to describe the lower boundary forcing, and in this case SST, in an effort to optimise AGCM-based systems for operational forecast production. In this paper three different strategies to predict the forcing SST were investigated and the results have shown that AGCMs skill is strongly influenced by the choice of SST prediction strategy. Although it has been suggested that the best practice may be to utilise different sources of SST predictions which may be weighted according to region and season in a multi-model ensemble approach (Li et al., 2008), the results presented here are only for individual forecast systems and show that the best AGCM forecast for South African midsummer rainfall is from a single best SST forecast field (the ensemble mean is a more skilful representation than each of the individual members).
The verification results of the three downscaled 24-year probabilistic forecast sets show that none of the three SST forecast methodologies lead to AGCM skill levels over South Africa that are so low for a particular forecast system as to be completely discarded. In fact, ROC scores for all three cases are above 0.5 for both the usual 3-category terciles case as well as for seasonal extremes (15th and 85th percentile thresholds of the climatological rainfall record, respectively). Moreover, all three AGCM modelling strategies are associated with reliable above-normal forecasts. However, the best modelling strategy (improved discrimination as well as reliability) is found when using SST forecasts from a coupled model to force the AGCM, and in particular when using the ensemble mean SST forecasts as opposed to using the ensemble spread, i.e., the uncertainties involved with the predicted SST fields. The intent of testing both ensemble members and ensemble mean SST from the coupled model was to evaluate the impact ensemble member SST (or SST uncertainty) had on forecast skill. In the study conducted here, we used the ensemble mean 850 hPa geopotential heights from the different experiments as the predictor for a MOS-based forecast. Therefore, the model uncertainty (spread) due to the use of different SSTs for different ensemble members was averaged over. We attribute the higher skill for the MOS-forecasts using the ensemble mean SST to a larger signal-to-noise ratio for the ensemble mean SST case than for the ensemble member SST case.
Regarding the SST statistical forecast model, it should be noted that the lower rainfall forecast skill associated with the statistically predicted SSTs could be a result of the SST forecast method used and choice of testing region (South Africa), and not because statistical SST forecasts are of poor quality. In fact, there have been a number of studies presented on successful statistical prediction models for ENSO (e.g. Barnston and Ropelewski, 1992; Tangang et al., 1998) and for the larger part of the tropics and mid-latitude oceans (Landman and Mason, 2001). An appropriate selection of an SST prediction methodology has been shown to be important in order to ensure that seasonal rainfall predictions from AGCMs provide the best forecast guidance. Such a selection could include statistical model forecasts and coupled model forecasts, as well as combining these forecasts through multi-model ensemble methodologies.
Only verification results for the outer two categories were presented since there is usually little skill to be derived from predicting the near-normal category (Van den Dool and Toth, 1991). The same has been found here, even with a near-normal category that comprises more than half of the climatological data. The notion of low predictability of the middle category is also supported by earlier verification work on South African seasonal rainfall predictions (Landman and Beraki, 2012; Landman et al., 2012). Owing to this low predictability of forecasts for 'average rainfall conditions' for a coming season to occur, forecast producers in South Africa may want to reconsider issuing such forecasts to forecast users. This notion of excluding forecasts for the near-normal category is already being practised by SAWS, who act as the official disseminator of seasonal forecasts in South Africa.
The results presented here may be case specific, and so this modelling study may need to be expanded to other rainfall seasons such as the austral autumn season, which is also associated with useful forecast skill over South Africa (Landman et al., 2005), and for longer lead-times that will additionally add greater uncertainty in predicted SST anomalies. To this end, seasonal forecast modellers in South Africa have started to produce multi-decadal hindcast sets as well as real-time operational forecasts of global SSTs, based on a statistical model that uses antecedent SST as predictors (Landman and Mason, 2001), and on recalibrated CGCM forecasts by following the methodology presented by Tippet et al. (2005), but for the global oceans. These SST forecast sets are available on the same 1°x1° resolution as the Optimum Interpolation v2 data (Reynolds and Smith, 1994), and are available from the Council for Scientific and Industrial Research. The hind-cast set can be used to develop a set of retro-active AGCM hindcasts and for operational AGCM forecast production. Optimising SST forecasts with sufficient lead-times is a very important endeavour in a country such as South Africa where computing infrastructure is sufficient to run AGCMs with fairly high resolution, and also to produce multi-ensemble forecasts operationally in real-time, but where it still remains challenging to run coupled ocean-atmosphere models operationally and in real-time with the same resolution and ensemble size as the current AGCMs. Moreover, optimised AGCM configurations are important for the establishment of baseline skill levels against which current and future coupled models can be compared.
ACKNOWLEDGEMENTS
This material is based upon work partly supported financially by the Water Research Commission (K5/2050) and by the National Research Foundation (NRF) of South Africa. The computing to produce the retrospective forecasts at IRI was provided by a US multi-agency computing grant through the Climate Simulation Laboratory (CSL) program (DeWitt, PI). Dave DeWitt's time working on this project was paid for by a grant/cooperative agreement from the National Oceanic and Atmospheric Administration, NA100AR4310210.
REFERENCES
BARNETT TP and PREISENDORFER (1987) Origins and levels of monthly and seasonal forecast skill for United States air temperature determined by canonical correlation analysis. Mon. Weather Rev. 115 1825-1850. [ Links ]
BARNSTON AG and ROPELEWSKI CF (1992) Prediction of ENSO using canonical correlation analysis. J. Clim. 5 1316-1245. [ Links ]
BARNSTON AG, LI S, MASON SJ, DEWITT DG, GODDARD L and GONG X (2010) Verification of the first 11 years or IRI's seasonal climate forecasts. J. Appl. Meteorol. Climatol. 49 493-520. [ Links ]
BERAKI A, DEWITT D, LANDMAN WA and OLIVIER C (2014) Dynamical seasonal climate prediction using an ocean-atmosphere coupled climate model developed in partnership between South Africa and the IRI. J. Clim. 27 1719-1741. DOI:10.1175/ JCLI-D-13-00275.1. [ Links ]
CPC (CLIMATE PREDICTION CENTER) (2013). Historical El Nino/ La Nina episodes (1950-present). URL: http://www.cpc.ncep.noaa.gov/products/analysismonitoring/ ensostuff/ensoyears.shtml (Accessed 6 December 2013). [ Links ]
DEWITT DG (2005) Retrospective forecasts of interannual sea surface temperature anomalies from 1982 to present using a directly coupled atmosphere-ocean general circulation model. Mon. Weather Rev. 133 2972-2995. [ Links ]
GATES WL (1992) AMIP: The Atmospheric Model Intercomparison Project. Bull. Am. Meteorol. Soc. 73 1962-1970. [ Links ]
GLAHN H and LOWRY D (1972) The use of model output statistics (MOS) in objective weather forecasting. J. Appl. Meteorol. 11 1203-1211. [ Links ]
GODDARD L and MASON SJ (2002) Sensitivity of seasonal climate forecasts to persisted SST anomalies. Clim. Dyn. 19 619-631. [ Links ]
GRAHAM RJ, EVANS ADL, MILNE KR, HARRISON MSJ and ROBERTSON KB (2000) As assessment of seasonal predictability using atmospheric general circulation models. Q. J. R. Meteorol. Soc. 126 2211-2240. [ Links ]
GRAHAM RJ, GORDON M, McLEAN PJ, INESON S, HUDDLE-STON MR, DAVEY MK, BROOKSHAW A and BARNES RTH (2005) Performance comparison of coupled and uncoupled versions of the Met Office seasonal prediction general circulation model. Tellus 57A 320-339. [ Links ]
GRAHAM RJ, YUN W-T, KIM J, KUMAR A, JONES D, BETTIO L, GAGNON N, KOLLI RK and SMITH D (2011) Long-range forecasting and the Global Framework for Climate Services. Clim. Res. 47 47-55. DOI: 10.3354/cr00963. [ Links ]
HAMILL TM (1997) Reliability diagrams for multicategory probabilistic forecasts. Weather Forecast. 12 736-741. [ Links ]
IRI (INTERNATIONAL RESEARCH INSTITUTE FOR CLIMATE AND SOCIETY) (2013) The IRI/LDEO Climate Data Library. URL: http://iridl.Ideo.columbia.edu/ (Accessed 6 December 2013). [ Links ]
JOLLIFFE IT and STEPHENSON DB (2011) Forecast Verification. A Practitioner's Guide in Atmospheric Science (2nd edn). Wiley, Oxford. 274 pp. [ Links ]
LANDMAN WA and BERAKI A (2012) Multi-model forecast skill for mid-summer rainfall over southern Africa. Int. J. Climatol. 32 303314 DOI: 10.1002/joc.2273. [ Links ]
LANDMAN WA and GODDARD L (2002) Statistical recalibration of GCM forecast over southern Africa using model output statistics. J. Clim. 15 2038-2055. [ Links ]
LANDMAN WA and MASON SJ (1999) Operational long-lead prediction of South African rainfall using canonical correlation analysis. Int. J. Climatol. 19 1073-1090. [ Links ]
LANDMAN WA and MASON SJ (2001) Forecasts of near-global sea surface temperatures using canonical correlation analysis. J. Clim. 14 3819-3833. [ Links ]
LANDMAN WA, BOTES S, GODDARD L and SHONGWE M (2005) Assessing the predictability of extreme rainfall seasons over southern Africa. Geophys. Res. Lett. 32 L23818. DOI: 10.1029/2005GL023965. [ Links ]
LANDMAN WA, MASON SJ, TYSON PD and TENNANT WJ (2001) Retro-active skill of multi-tiered forecasts of summer rainfall over southern Africa. Int. J. Climatol. 21 1-19. [ Links ]
LANDMAN WA, KGATUKE M-J, MBEDZI M, BERAKI A, BART-MAN A and DU PIESANIE A (2009) Performance comparison of some dynamical and empirical downscaling methods for South Africa from a seasonal climate modelling perspective. Int. J. Climatol. 29 1535-1549. [ Links ]
LANDMAN WA, DEWITT D, LEE D-E, BERAKI A and LOTTER D (2012) Seasonal rainfall prediction skill over South Africa: 1- vs. 2-tiered forecasting systems. Weather Forecast. 27 489-501. DOI: 10.1175/WAF-D-11-00078.1. [ Links ]
LI S, GODDARD L, DEWITT DG (2008) Predictive skill of AGCM seasonal climate forecasts subject to different SST prediction methodologies. J. Clim. 21 2169-2186. [ Links ]
LIVEZEY RE, CHEN WY (1983) Statistical field significance and its determination by Monte Carlo techniques. Mon. Weather Rev. 111 46-59. [ Links ]
MASON SJ and Graham NE (2002) Areas beneath the relative operating characteristics (ROC) and levels (ROL) curves: Statistical significance and interpretation. Q. J. R. Meteorol. Soc. 128 2145-2166. [ Links ]
MASON SJ, JOUBERT AM, COSIJN C and CRIMP SJ (1996) Review of seasonal forecast techniques and their applicability to southern Africa. Water SA 22 203-209. [ Links ]
MICHAELSEN J (1987) Cross-validation in statistical climate forecast models. J. Clim. Appl. Meteorol. 26 1589-1600. [ Links ]
PALMER T, ANDERSEN U, CANTELAUBE P, DAVEY M, DEQUE M, DOBLAS-REYES FJ, FEDDERSEN H, GRAHAM R, GUALDI S, GUEREMY J-F and co-authors (2004) Development of a European multimodel ensemble system for seasonal-to-interannual prediction (DEMETER). Bull. Am. Meteorol. Soc. DOI: 10.1175/ BAMS-85-6-853. [ Links ]
REYNOLDS RW and SMITH TM (1994) Improved global sea surface temperature analyses using optimum interpolation. J. Clim. 7 929-948. [ Links ]
ROECKNER E, ARPE K, BENGTSSON L, BRINKOP S, DUMENIL L, ESCH M, KIRK E, LUNKEIT F, PONAATER M, ROCKEL B and co-authors (1996) Simulation of present-day climate with the ECHAM4 model: Impact of model physics and resolution. Report No. 93, Max-Planck-Institut fur Meteorologie, Hamburg. [ Links ]
SHONGWE ME, LANDMAN WA and MASON SJ (2006) Performance of recalibration systems for GCM forecasts for southern Africa. Int. J. Climatol. 26 1567-1585. [ Links ]
TANGANG FT, TANG B, MONAHAN AH and HSIEH WW (1998) Forecasting ENSO events: A neural network-extended EOF approach. J. Clim. 11 29-41. [ Links ]
TIPPETT MK, BARNSTON AG and DEWITT D (2005) Statistical correction of tropical Pacific sea surface temperature forecasts. J. Clim. 18 5141-5162. [ Links ]
TROCCOLI A, HARRISON M, ANDERSON DLT and MASON SJ (2008) Seasonal Climate: Forecasting and Managing Risk. NATO Science Series. Earth and Environmental Sciences Vol 82. Springer, Dordrecht. 467 pp. [ Links ]
VAN DEN DOOL HM (1994) Searching for analogues, how long must we wait? Tellus 46A 314-324. [ Links ]
VAN DEN DOOL HM and TOTH Z (1991) Why do forecasts for near normal often fail? Weather Forecast. 6 76-85. [ Links ]
VAN DER LINDEN P and MITCHELL JFB (eds.) (2009) ENSEMBLES: Climate Change and its Impacts: Summary of research and results from the ENSEMBLES project. Met Office Hadley Centre, Exeter. 160 pp. [ Links ]
VAN ROOY MP (1972) District rainfall for South Africa and the annual march of rainfall over southern Africa. Climate of South Africa. Part 10 (WB 35). SA Weather Bureau, Dept of Transport, Pretoria. [ Links ]
WILKS DS (2011) Statistical Methods in the Atmospheric Sciences (3rd edn.). Academic Press: Amsterdam. 676 pp. [ Links ]
 Correspondence:
Willem A Landman
Tel: +27 12 841-3395; Fax: +27 12 841-4863
e-mail: WALandman@csir.co.za
Received 14 January 2013
Accepted in revised form 5 September 2014

