


Serviços Personalizados
Artigo
 Inglês (pdf)
 Artigo em XML
 Referências do artigo
Indicadores

Links relacionados
-
 Citado por Google
 -
 Similares em Google
Compartilhar

 Permalink
Water SA
versão On-line ISSN 1816-7950
versão impressa ISSN 0378-4738
Water SA vol.40 no.4 Pretoria Out. 2014
A feasibility study of in-line rheological characterisation of a wastewater sludge using ultrasound technology
R KotzéI; R HaldenwangI; V FesterI; W RössleII
IFlow Process & Rheology Centre (FPRC), Cape Peninsula University of Technology, PO Box 652, Cape Town 8000, South Africa
IIWastewater Branch, Water and Sanitation Department, City of Cape Town, 38 Wale Street, Cape Town, South Africa
ABSTRACT
The rheological characteristics of sludge affect transportation, treatment and the disposal processes involved in sludge system design and management operations such as dewatering, including flocculation and filtration. The concentration of solid matter in the sludge has an effect on rheological parameters such as yield stress and viscosity. These rheological properties of sludge are almost exclusively obtained today using commercially available instruments, such as conventional rotational rheometers or tube (capillary) viscometers. Since these methods are time-consuming and unsuitable for realtime process monitoring, the ultrasonic velocity profiling coupled with pressure drop (UVP+PD) methodology becomes very attractive for in-line flow behaviour monitoring for quality control and process optimisation. The main objective of this research work was to evaluate the UVP+PD technique in a concentrated sludge as found in a wastewater treatment plant. A portable pump test rig with tube viscometer fitted with a UVP+PD system was used to determine the rheological parameters. Conventional UVP installation techniques were tested as well as a new delay line UVP transducer. The results obtained from different installation techniques and transducers are compared. Finally, rheological parameters obtained using UVP+PD compared within 15% of that obtained using the tube viscometer. The results showed that UVP+PD is a feasible and promising technique for in-line real time flow visualisation and rheological characterisation for treated wastewater sludge which, when used as in-line process control, could lead to significant savings in chemicals and will optimise processes producing drier sludges and filter cakes.
Keywords: Ultrasonic velocity profiling, UVP+PD methodology, sludge rheology, non-Newtonian, tube viscometry
NOTATION
A total area, (m2)
D pipe inner diameter, (m)
K fluid consistency index, (Pa sn)
L unit length, (m)
n flow behaviour index, dimensionless
Q volumetric flow rate, (ℓ/s)
r radial position, (m)
R pipe radius, (m)
v velocity, (m/s)
ΔP pressure drop, (Pa)
Re2 Reynolds number, dimensionless
Rplug Plug radius, (m)
V bulk velocity, (m/s)
Greek letters
τ shear stress, (Pa)
τy yield stress, (Pa)
 shear rate, (ℓ/s)
INTRODUCTION
When sludge suspensions increase in solids concentration they become non-Newtonian in behaviour. Rheology is a tool used for characterising the hydrodynamics of such materials and has been successfully applied in the wastewater treatment industry, from optimising process parameters of plants to excess sludge treatment processes (Seyssiecq et al., 2003). Seyssiecq et al. (2003) give an extensive overview of research conducted on the rheological characterisation of wastewater treatment sludges. Different models used for characterisation of sludges, such as power law, Bingham, Herchel-Bulkley, Casson, etc., are listed and rheological properties are linked by various authors to physico-chemical parameters of suspensions or to operating parameters such as mixing.
In dewatering operations the main objective is to produce the driest sludge at the optimum chemical conditions, which is most often a water-soluble organic polyelectrolyte usually termed a polymer. The flow properties and variability, mixing intensity, and time allowed for mixing all effect the optimal dosing of the flocculation process (Dental et al., 2000).
Örmeci (2007) links the optimal sludge dewatering operation, in terms of polymer dose and mixing intensity, to the rheological properties of wastewater sludge, and a reduction of 50% polymer consumption was achieved with the off-line methods used for both conditioned and unconditioned sludges. Wang and Dentel (2011) investigated the effect of polymer doses and mixing intensity on the rheology of anaerobic digested sludge. The effect of addition of polymers could be distinguished from the rheograms. According to Abu-Orf and Dentel (1999), whose investigation attempted linking the rheological characteristics to the control of sludges conditioned with polymers, this is a complex process where mixing parameters have a substantial effect. The previous authors all used offline rheometers to establish the rheological properties of the sludges. The early work of Lotito et al. (1997), who tested the rheology of waste-activated, raw mixed, anaerobically-digested and mechanically-dewatered sludge, clearly showed the difficulties of the application of rotational viscometers. They identified the major obstacles when using rotational viscometers as aggregate particles which form and could settle at times, the time-dependent structure generated and the lack of reproducibility. This could be a reason why, after so much rheological work has been done to date and has confirmed that rheology is an important parameter, the successful introduction of rheology as a basis for control systems in wastewater treatment works has not been realised. In a very recent review of optimal sludge management in wastewater treatment, Tang and Zhang (2014) state that measuring the yield stress and fluid viscosity are both essential for successfully controlling the dewatering process. Currently these are measured off-line, and even with these traditional off-line systems large savings in polymer dosing were reported by Örmeci (2007).
Ultrasonic velocity profiling (UVP) was originally developed as a medical technique for measuring an instantaneous velocity profile in blood flow along the ultrasonic beam axis. The UVP technique for determining a one-dimensional velocity profile in fluid flow was introduced for general fluids by Takeda (1991, 1996). The UVP technique and its applications in academia and industry are now well described in several scientific publications (see Jensen, 1996; Povey, 1997; Powell, 2008). UVP has previously been used in sewage applications for determining flow rates and concentrations of suspended particles (turbidity measurements), e.g., see Abda et al. (2009) and Schmitt et al. (2010). However, these studies were based in large open-channel geometries in sewer networks and in-line rheology was not part of the objectives. The UVP technique can, however, be combined with pressure difference (PD) measurements in order to obtain in-line rheological parameters of opaque fluids with suspended particles, usually referred to as the UVP+PD methodology (Wunderlich and Brunn 1999; Wiklund et al., 2007; Kotzé et al., 2008). It is based on the traditional tube viscometry concept where the shear rate is obtained from the measurements of the volumetric flow rate and the shear stress at the wall is obtained from simultaneous measurement of the pressure difference over a fixed distance. The UVP+PD method and similar methods for determining the rheological parameters of a suspension or emulsion are already known and are described in several publications (Wunderlich and Brunn 1999; Dogan et al., 2005; Pfund et al., 2006; Wiklund et al., 2007; Birkhofer et al., 2008; Wiklund and Stading, 2008; Fock et al., 2009; Wassell et al., 2010; Wiklund et al., 2010; Kotze et al., 2008, 2012). The UVP+PD methodology allows measurements not possible with commercial off-line rheometers such as radial velocity profiles and yield stress directly in-line and under dynamic process conditions. Furthermore, it has advantages over commercially available process rheometers and off-line instruments in being non-invasive, applicable to opaque and concentrated suspensions and to monitoring processes in real-time. It has been evaluated for several potential industrial applications including, e.g., paper pulp, foods, transient flows and model mineral suspensions.
The objective of this research work was to evaluate the UVP+PD technique for in-line rheology measurement of wastewater sludge. The main problem when using UVP with complex industrial fluids such as sludge is the attenuation of ultrasound energy that prevents velocity measurements of the fluid flowing in the pipe. This problem can be solved by introducing new ultrasound transducers as well as using different methods for installing the transducers onto the pipe test section. Conventional UVP installation techniques were tested as well as a new delay line UVP transducer. The results obtained from different installation techniques and transducers are compared, and, finally, rheological parameters obtained using UVP+PD were compared to those obtained using tube viscometry.
Theoretical considerations
This section briefly describes non-Newtonian flow and the associated rheological parameters that were used to characterise the sludge tested in this work.
The equation for the Herschel-Bulkley model is as follows:
where:

K, n and τy are the consistency index, flow behaviour index and yield stress, respectively (Chhabra and Richardson, 2008).
These parameters can be obtained by using a curve-fitting procedure. Eq. (1) can be integrated to give the velocity (v) profile across the pipe radius:

where:
Rplug is the plug radius and is related to the fluid yield stress according to:

The Herschel-Bulkley model can easily be modified to describe the power-law and Bingham plastic models (Chhabra and Richardson, 2008). The identification of the transition between laminar and turbulent flow is of great importance because the fluid flow behaviour changes fundamentally at the transition zone. Slatter and Lazarus (1993) formulated a Reynolds number (Re2) for non-Newtonian pipe flow (assumed plug-flow):

Note that in order to calculate rheological parameters all velo city pro files were measured in laminar flow. Equation (4) was used as an indication of the flow regimes in which tests were conducted in this work.
MATERIALS AND METHODS
Material
During this study one sludge concentration of 6.3% w/w was tested at the Zeekoeivlei Wastewater Treatment Plant in Cape Town. This fluid suspension was a mixture of thickened primary and waste-activated sludge; see Haldenwang et al. (2012).
UVP+PD flow loop and tube viscometer
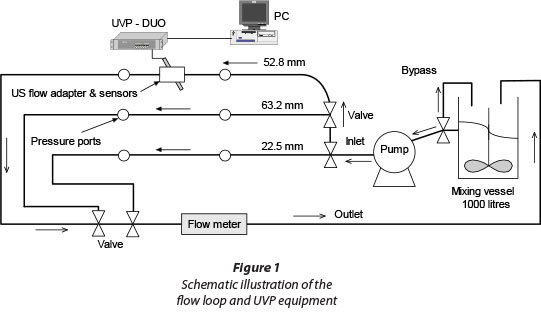
The pipe rig consisted of 3 polyvinyl chloride (PVC) pipes with inner diameters of 63.2, 52.8 and 22.5 mm and was used for tube viscometry tests. The wall shear stress data were obtained from pressure drop measurements (D∆P/4L) and the nominal wall shear rate from flow rate measurements (8V/D), corrected for by the Rabinowitch-Mooney factor. Procedures and methods for obtaining accurate in-line experimental data as well as post-data analyses are discussed in detail by Chhabra and Richardson (2008). The pipe rig was fitted with a thermocouple (accuracy ±1°C) and a 50 mm electromagnetic flow meter (Krohne Optiflux 4000). Pressure measurements were conducted using differential pressure transducers (Fuji Electric) with maximum ranges of 0-6 kPa and 0-130 kPa and an accuracy of ±0.25%. The complete pipe viscometer setup is described in more detail in Haldenwang et al. (2010, 2012). A UVP flow adapter was installed in-line in the 52.8 mm pipe for UVP measurements in the sludge. Figure 1 shows a schematic diagram of the flow loop and the flow adapter installed in the pipe rig.
UVP+PD experimental setup and methodology
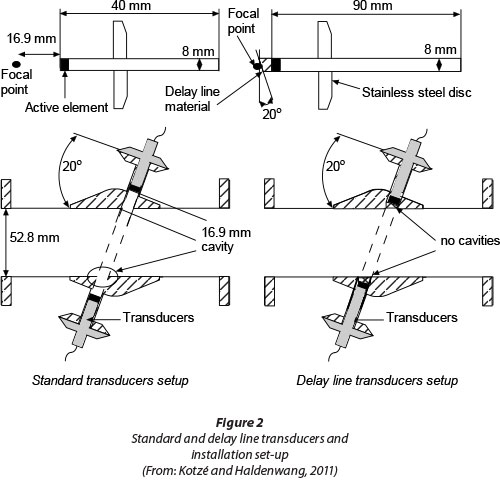
In this work a commercial UVP instrument (UVP-DUO-MX, Met-Flow SA, Lausanne, Switzerland) was used for velocity profile measurements. A new transducer, which incorporates a delay line, was used for velocity profile measurements. The delay line is a material optimised for beam forming that contains the near-field distance. This delay line is fixed ahead of the transducer and is flush with the pipe wall, thus making it possible to have the focal point (position where sound energy is highest) of the ultrasonic beam at the wall interface (see Wiklund et al., 2010; Kotzé and Haldenwang, 2011; Kotzé et al., 2012, 2013). Standard transducers with a central basic frequency of 2 and 4 MHz were chosen in order to obtain a good compromise between spatial resolution, which is due to their short wavelength, and penetration depth (less attenuation). Doppler, immersion-type standard ultrasonic transducers (TN and TX-line, Imasonic, Bensancon, France) were used for comparison with results obtained using the delay line transducers.
A special flow adapter cell made from stainless steel was designed for in-line measurements of velocity profiles. Ultrasonic transducers (TDX) were installed at 20° with respect to the lateral direction (see Fig. 2) and in direct contact with the fluid to avoid attenuation and reflection of the pressure wave. To avoid measurements where the ultrasonic sound wave is irregular, the standard transducers were also pulled back creating a cavity equal to the transducer near-field distance (~17 mm) between the transducer surface and actual pipe wall interface (focal point at pipe wall). This transducer installation has previously been described in Wiklund et al. (2007) and the same setup was used in Kotzé et al. (2008, 2012). Figure 2 shows a schematic diagram of the flow adapters with standard and delay line transducers. Two transducers are installed at opposite positions to one another in order to determine the velocity of sound in the fluid by using time-of-flight measurements (see Povey, 2007). However, unfortunately it was not possible to measure the velocity of sound in this work due to the high attenuation of the ultrasound wave.
It should be noted that the flow adapters were only designed for use with 4 MHz transducers. The 2 MHz transducer has larger sensor dimensions (outer diameter 16 mm) and could not be installed into the flow adapters with housing diameters of 8 mm. Instead, the 2 MHz transducer was installed non-invasively at the outer pipe wall and using acoustic coupling gel in order to ensure that there was no air between the transducer and pipe surface. Figure 3 shows the transducer installed at an angle (20°) using a specially designed PVC housing block. In this setup the measurements were done completely non-invasively (ultrasound wave through the PVC pipe wall into the sludge suspension) and provided another form of feasibility test in the sludge suspension.

The UVP+PD technique
The UVP+PD methodology consists of several components, starting with an instrument designed to measure profiles using a pulsed ultrasonic technique. Accurate ultrasonic transducers, flow adapters for transducer installation, pressure sensors, and data acquisition schemes, as well as software development and data processing, are required for this in-line rheometric method. Regardless of the actual set-up (experimental flow loops and ultrasound equipment), the UVP+PD methodology requires several processing steps; see e.g. Kotzé et al. (2012). A flowchart of the data acquisition and processing steps involved in an in-line rheometer based on the UVP+PD methodology is given in Fig. 4. More information on the UVP+PD methodology and experimental setup can be found in Wiklund et al. (2007), Wikund and Stading (2008), Kotzé et al. (2008, 2012) and Norton et al. (2011). Firstly, inphase and quadrature-phase (IQ) data (demodulated echoes) and pressure measurements are captured using a data acquisition interface. It is also possible to include extra sensor outputs, e.g., temperature, flow rate and density. A velocity profile for each IQ dataset is calculated using velocity estimation algorithms and then the average is determined. The number of profiles averaged depends on the application and fluid characteristics. From the velocity profile measurement the flow rate can be calculated by integration as well as rheological parameters by using the pressure drop data. The rheological parameters are obtained by a least squares curve-fitting procedure using rheological models (Eq. (1)). Finally, results can be plotted as rheograms (shear stress vs. shear rate) or flow curves (viscosity vs. shear rate).

The processing steps may, of course, vary from one application to another, depending on what kind of information the operator/user wants in each particular situation.
RESULTS AND DISCUSSION
Velocity profile measurements
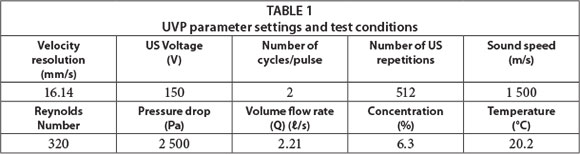
An average velocity profile was calculated from 100 measured profiles in order to minimise the standard deviation of the measurement and the total measurement time was approximately 100 ms. It was found that the sludge attenuated the ultrasonic energy significantly. For this reason a compromise between spatial and time resolution had to be made. In this case it was decided to optimise the spatial resolution but at a loss of time resolution. The spatial resolution is defined as the distance between velocity data points along the measurement distance or pipe diameter and the time resolution is the amount of time taken for one velocity profile measurement. Table 1 depicts the UVP parameter settings and test conditions. The number of ultrasound (US) repetitions was increased to 512 pulse repetitions which increased the time between consecutive measured profiles (one velocity profile is determined after 512 repetitions). The number of US cycles per emitted pulse could be kept to 2 cycles per pulse, thus keeping the spatial resolution (0.37 mm) at a maximum. The US input voltage was also set to the maximum value of 150 V in order to increase the signal strength and to minimise the effect of ultrasound attenuation and absorption. Figure 5 shows velocity profile measurements in 6.3% w/w wastewater for the two standard transducers (2/4 MHz) and delay line transducer (4 MHz).

The velocity profile measured using the 2 MHz standard transducer (triangles, Fig. 5) was significantly distorted across the entire pipe radius (compared to the profile measured using delay line transducer, diamonds, Fig. 5). However, the result also indicates that it is possible to measure through solid material layers (in this case PVC pipe material). Distortion of the velocity profile could be due to ultrasonic beam refraction and absorption that causes errors in parameters such as the Doppler angle and sound speed. Furthermore, physical changes of the ultrasonic beam can occur when measuring through material layers and could cause increased sample volume dimensions and thus more errors are introduced due to increased averaging effects; see, e.g., Messer and Aidun (2009). Despite the distortion of the non-invasive velocity profile measurement, it can still be observed that the ultrasound beam was able to penetrate to the pipe radius (26.4 mm), which is encouraging for future improvements to this non-invasive transducer setup. Since this profile contains distorted velocity data close to the pipe wall (profile gradient) and beyond the plug radius, it was decided not to use this result for determining rheological properties of the sludge suspension.
Due to the attenuating properties of the sludge suspension, it was not possible to measure velocity profiles using a standard transducer (circles, Fig. 5). According to the acoustic measurements of the different transducers (Kotzé et al., 2013), the standard transducers generated more acoustic energy than when compared to the delay line transducer. However, due to the cavity between the transducer surface and pipe wall, which was filled with the sludge suspension, most of the energy was absorbed before the ultrasonic pulse could propagate across the pipe diameter. This is illustrated in Fig. 6.

Although good qualitative velocity profiles could be measured using the delay line transducer, it was still not possible to penetrate beyond the pipe radius. Furthermore, the delay line material absorbs ultrasonic energy and prevents measurements in larger pipe diameters in attenuating fluids. As a result the velocity of sound could not be measured in-line and can cause errors in flow rate monitoring and visualisation. New transducer development is required so that maximum energy transfer into the fluid medium is achieved. Another important limitation is that, currently, the transducer installation (delay transducer setup) is not non-invasive. This means that the transducer front will be subjected to harsh industrial conditions and the surface could wear over time which will influence measurements. The non-invasive transducer setup yielded a distorted profile; however, the results showed potential for future improvements. The non-invasive set-up was installed onto a PVC pipe and ultimately a set-up capable of measuring through steel would be required for successful implementation within industrial conditions.
Comparison of UVP+PD and tube viscometry
An experimental (symbols) velocity profile along the pipe diameter for the sludge suspension (6.3% w/w) measured by the in-line UVP+PD method is shown in Fig. 7. These are represented by the theoretical profile (curve) obtained by fitting the experimental data and pressure drop using the Bingham plastic model (Eq. (1)) with the values of K and τy (listed in Table 2). The flow behaviour index (n) for a Bingham plastic fluid is equal to 1 and was constant during the fitting procedure. The flow is laminar, since the value of the Reynolds number (Re2) is equal to 320 (Table 1), validating the use of the theoretical point velocity distribution equations (Eq. (2)).


Rheological results for the sludge suspension are depicted in Fig. 8. From Fig. 8 it can be observed that results are in good agreement (within 15%) with each other across the whole shear rate region (100 to 1 000 s-1).
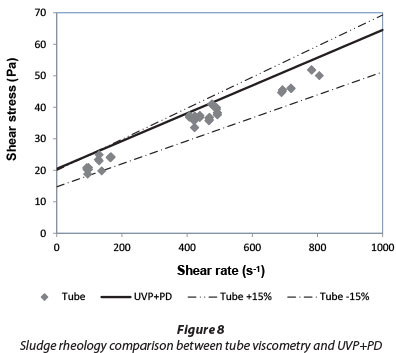
The rheological parameters (K, n and τy) determined by the two in-line methods are depicted in Table 2. When observing the estimated yield stress values, one can see that the results obtained from the two rheological methods are in agreement within ±15% when compared to one another. Also, the high estimated yield stress value of the investigated fluid is an indication of the highly viscous structure of this highly concentrated sludge suspension.
CONCLUSIONS AND RECOMMENDATIONS
This article presents the UVP+PD methodology for in-line rheological characterisation of wastewater sludge. Feasibility tests were carried out and were achieved by using delay line and standard transducers as well as different installation techniques. It was possible to measure detailed flow behaviour in real-time for a viscous wastewater sludge, for the first time. Industrial fluids, such as sludges, exhibit wide particle-size distributions, large particle sizes and very high viscosities. These industrial fluids cause strong attenuation of the ultrasound energy, which can significantly distort velocity profiles measured with the UVP technique or even make it impossible to conduct flow measurements at all with, e.g., optical techniques. Initial results obtained in a concentrated sludge suspension showed that UVP is a feasible and promising technique for flow visualisation and rheological characterisation in the wastewater engineering or treatment industry. Rheological parameters obtained from the velocity profile measurement using the delay line transducer showed good agreement with tube viscometry (within 15%). Currently there is no in-line measuring system commercially available that can measure the rheology in real time.
A new advanced ultrasonic sensor capable of complete non-invasive and accurate measurements is needed in order to completely implement the UVP+PD in a robust industrial application. The application of this technology in the wastewater sludge environment to measure the rheology in-line and in real-time has huge potential to improve process control as rheological parameters can be linked to, e.g., polymer dosing for sludge dewatering. This could lead to large savings due to a reduction in the use of polymers and the optimisation of filter belt presses and centrifuges which will lead to more consistent and higher solids concentration filter cakes.
ACKNOWLEDGEMENTS
The authors would like to thank the Cape Peninsula University of Technology (CPUT) for financially supporting this work. The support of the staff at Biwater, situated at the Zeekoeivlei Wastewater Treatment Plant, who prepared the sludges, is much appreciated.
REFERENCES
ABDA F, AZBAID A, ENSMINGER D, FISCHER S, FRANCOIS P, SCHMITT P and PALLARES A (2009) Ultrasonic device for real-time sewage velocity and suspended particles concentration measurements. Water Sci. Technol. 60 (1) 117-125. [ Links ]
ABU-ORF M and DENTEL S (1999) Rheology as tool for polymer dose assessment and control. J. Environ. Eng. 125 (12) 1133-1141. [ Links ]
BIRKHOFER B (2011) In: NORTON IT, SPYROPOULOS F and COX P (eds) Practical Food Rheology: An Interpretive Approach. Chapter 3: Doppler Ultrasound-Based Rheology. Wiley-Blackwell. ISBN-10: 1405199784. [ Links ]
BIRKHOFER BH, SHAIK JAK, WINDHAB EJ, OURIEV B, LISNER K, BRAUN P and ZENG Y (2008) Monitoring of fat crystallization process using UVP-PD technique. FlowMeas. Instrum. 19 (3-4) 163-169. [ Links ]
CHHABRA RP and RICHARDSON JF (2008) Non-Newtonian Flow and Applied Rheology: Engineering Applications. ButterworthHeinemann, Oxford. [ Links ]
DENTAL SK, ABU-ORF MM and WALKER CA. (2000) Optimization of slurry flocculation and dewatering based on electrokinetic and rheological phenomena. Chem. Eng. J. 80 65-72. [ Links ]
DOGAN N, McCARTHY M J and POWELL RL (2005) Measurement of polymer melt rheology using ultrasonics-based in-line rheometry. Meas. Sci. Tech. 16 1684-1690. [ Links ]
FOCK H WIKLUND J and RASMUSON A (2009) Ultrasound velocity profile (UVP) measurements of pulp suspension flow near the wall. J. Pulp Paper Sci. 35 (1) 26-33. [ Links ]
HALDENWANG R, FESTER V, SUTHERLAND A, HOLM R and DU TOIT R (2010) Design construction, commissioning and testing of a portable tube viscometer and pump rig. Proc. 18th International Conference on Hydrotransport, 22-24 September 2010, Rio de Janeiro. Hydrotransport 18 287-298. [ Links ]
HALDENWANG R, SUTHERLAND APN, FESTER VG, HOLM R and CHHABRA RP (2012) Sludge pipe flow pressure drop prediction using composite power law friction factor-Reynolds number correlations based on different non-Newtonian Reynolds numbers. Water SA 38 (4) 615-622. [ Links ]
JENSEN JA (1996) Estimation of Blood Velocities Using Ultrasound: A Signal Processing Approach. Cambridge University Press, Cambridge. [ Links ]
KOTZÉ R and HALDENWANG R (2011) Development of an ultrasonic in-line rheometer: Evaluation, optimisation and verification. 15th Int. Conf. Trans. Sedimentation Solid Particles 15 49-61. [ Links ]
KOTZÉ R, HALDENWANG R and SLATTER P (2008) Rheological characterisation of highly concentrated mineral suspensions using an ultrasonic velocity profiling with combined pressure difference method. Appl. Rheol. 18 (6) 62114. [ Links ]
KOTZÉ R, WIKLUND J and HALDENWANG R (2012) Optimization of the UVP+PD rheometric method for flow behavior monitoring of industrial fluid suspensions. Appl. Rheol. 22 42760. [ Links ]
KOTZÉ R, WIKLUND J and HALDENWANG R (2013). Optimisation of pulsed ultrasonic velocimetry and transducer technology for industrial applications. Ultrasonics 53 459-469. [ Links ]
LOTITO V, SPINOSA L, MININI G and ANTONACCI R (1997) The rheology of sewage sludge at different steps of treatment. Water Sci. Technol. 36 (11) 79-85. [ Links ]
MESSER M and AIDUN CK (2009) Main effects on the accuracy of pulsed-ultrasound-Doppler-velocimetry in the presence of rigid impermeable walls. Flow Meas. Instrum. 20 85-94. [ Links ]
ÖRMECI B (2007) Optimisation of a full-scale dewatering operation based on the rheological characteristics of wastewater sludge. Water Res. 41 (6) 1243-1252. [ Links ]
PFUND DM, GREENWOOD MS, BAMBERGER JA and PAPPAS RA (2006) Inline ultrasonic rheometry by pulsed Doppler. Ultrasonics 44 e477-e482.
POVEY MJW (2007) Ultrasound Techniques For Fluids Characterization. Academic Press, San Diego. [ Links ]
POWELL RL (2008) Experimental techniques for multiphase flows. Phys. Fluids. 20 1-22. [ Links ]
SCHMITT P, PALLARES A, FRANCOIS P and PONS M (2010) Suspended particles in wastewater: acoustical characterization and modeling. Proceedings of the 7th International Symposium on Ultrasonic Doppler Methods for Fluid Mechanics and Fluid Engineering, 7 April 2010, Gothenburg. 43-46. [ Links ]
SEYSSIECQ I, FERRASSE J-H, and ROCHE N (2003) State-of-the-art: rheological characterisation of wastewater treatment sludge. Biochem. Eng. J. 16 41-56. [ Links ]
SLATTER PT and LAZARUS JH (1993) Critical flow in slurry pipelines. Paper presented at: British Hydromechanics Research Group 12th International Conference on Slurry Handling and Pipeline Transport. Hydrotransport 12 639-654. [ Links ]
TAKEDA Y (1991) Development of an ultrasound velocity profile monitor. Nucl. Eng. Des. 126 277-284. [ Links ]
TAKEDA Y (1996) Velocity profile measurement by ultrasound Doppler shift method. Int. J. Heat Fluid Flow 7 313-318. [ Links ]
TANG B and ZHANG Z (2014) Essence of disposing the excess sludge and optimizing the operation of wastewater treatment: Rheological behavior and microbial ecosystem. Chemosphere 105 1-13. [ Links ]
WANG YL and DENTEL SK (2011) The effect of polymer doses and extended mixing intensity on the geometric and rheological characteristics of conditioned anaerobic digested sludge (ADS). Chem. Eng. J. 166 (3) 850-858. [ Links ]
WASSELL P, WIKLUND J, STADING M, BONWICK G, SMITH C, ALMIRON-ROIG E and YOUNG NWG (2010) Ultrasound Doppler based in-line viscosity and solid fat profile measurement of fat blends. Int. J. Food Sci. Tech. 45 (5) 877-883. [ Links ]
WIKLUND J and STADING M (2008) Application of in-line ultrasound Doppler based UVP-PD method to concentrated model and industrial suspensions. Flow Meas. Instr. 19 171-179. [ Links ]
WIKLUND J, RAHMAN M and HAKANSSON U (2012) In-line rheometry of micro cement based grouts - A promising new industrial application of the ultrasound based UVP+PD method. Appl. Rheol. 22 (4) 42783-1-42783-11. [ Links ]
WIKLUND J, SHAHRAM I and STADING M (2007) Methodology for in-line rheology by ultrasound Doppler velocity profiling and pressure difference techniques. Chem. Eng. Sci. 62 4159-4500. [ Links ]
WIKLUND J, STADING M and TRÄGÄRDH C (2010) Monitoring liquid displacement of model and industrial fluids in pipes by inline ultrasonic rheometry. J. Food Eng. 99 330-337. [ Links ]
WUNDERLICH TH and BRUNN PO (1999) Ultrasound pulse Doppler method as a viscometer for process monitoring. Flow Meas. Instrum. 10 201-205. [ Links ]
 Correspondence:
R Kotzé
+27 83 299 2345
reinhardtkotze@yahoo.com
Received 2 September 2013
Accepted in revised form 4 September 2014

